
|
 |
 |
 |
 |
 |
 |
 |
 |
 Proactive Market Timing Proactive Market Timing
| 
|
|
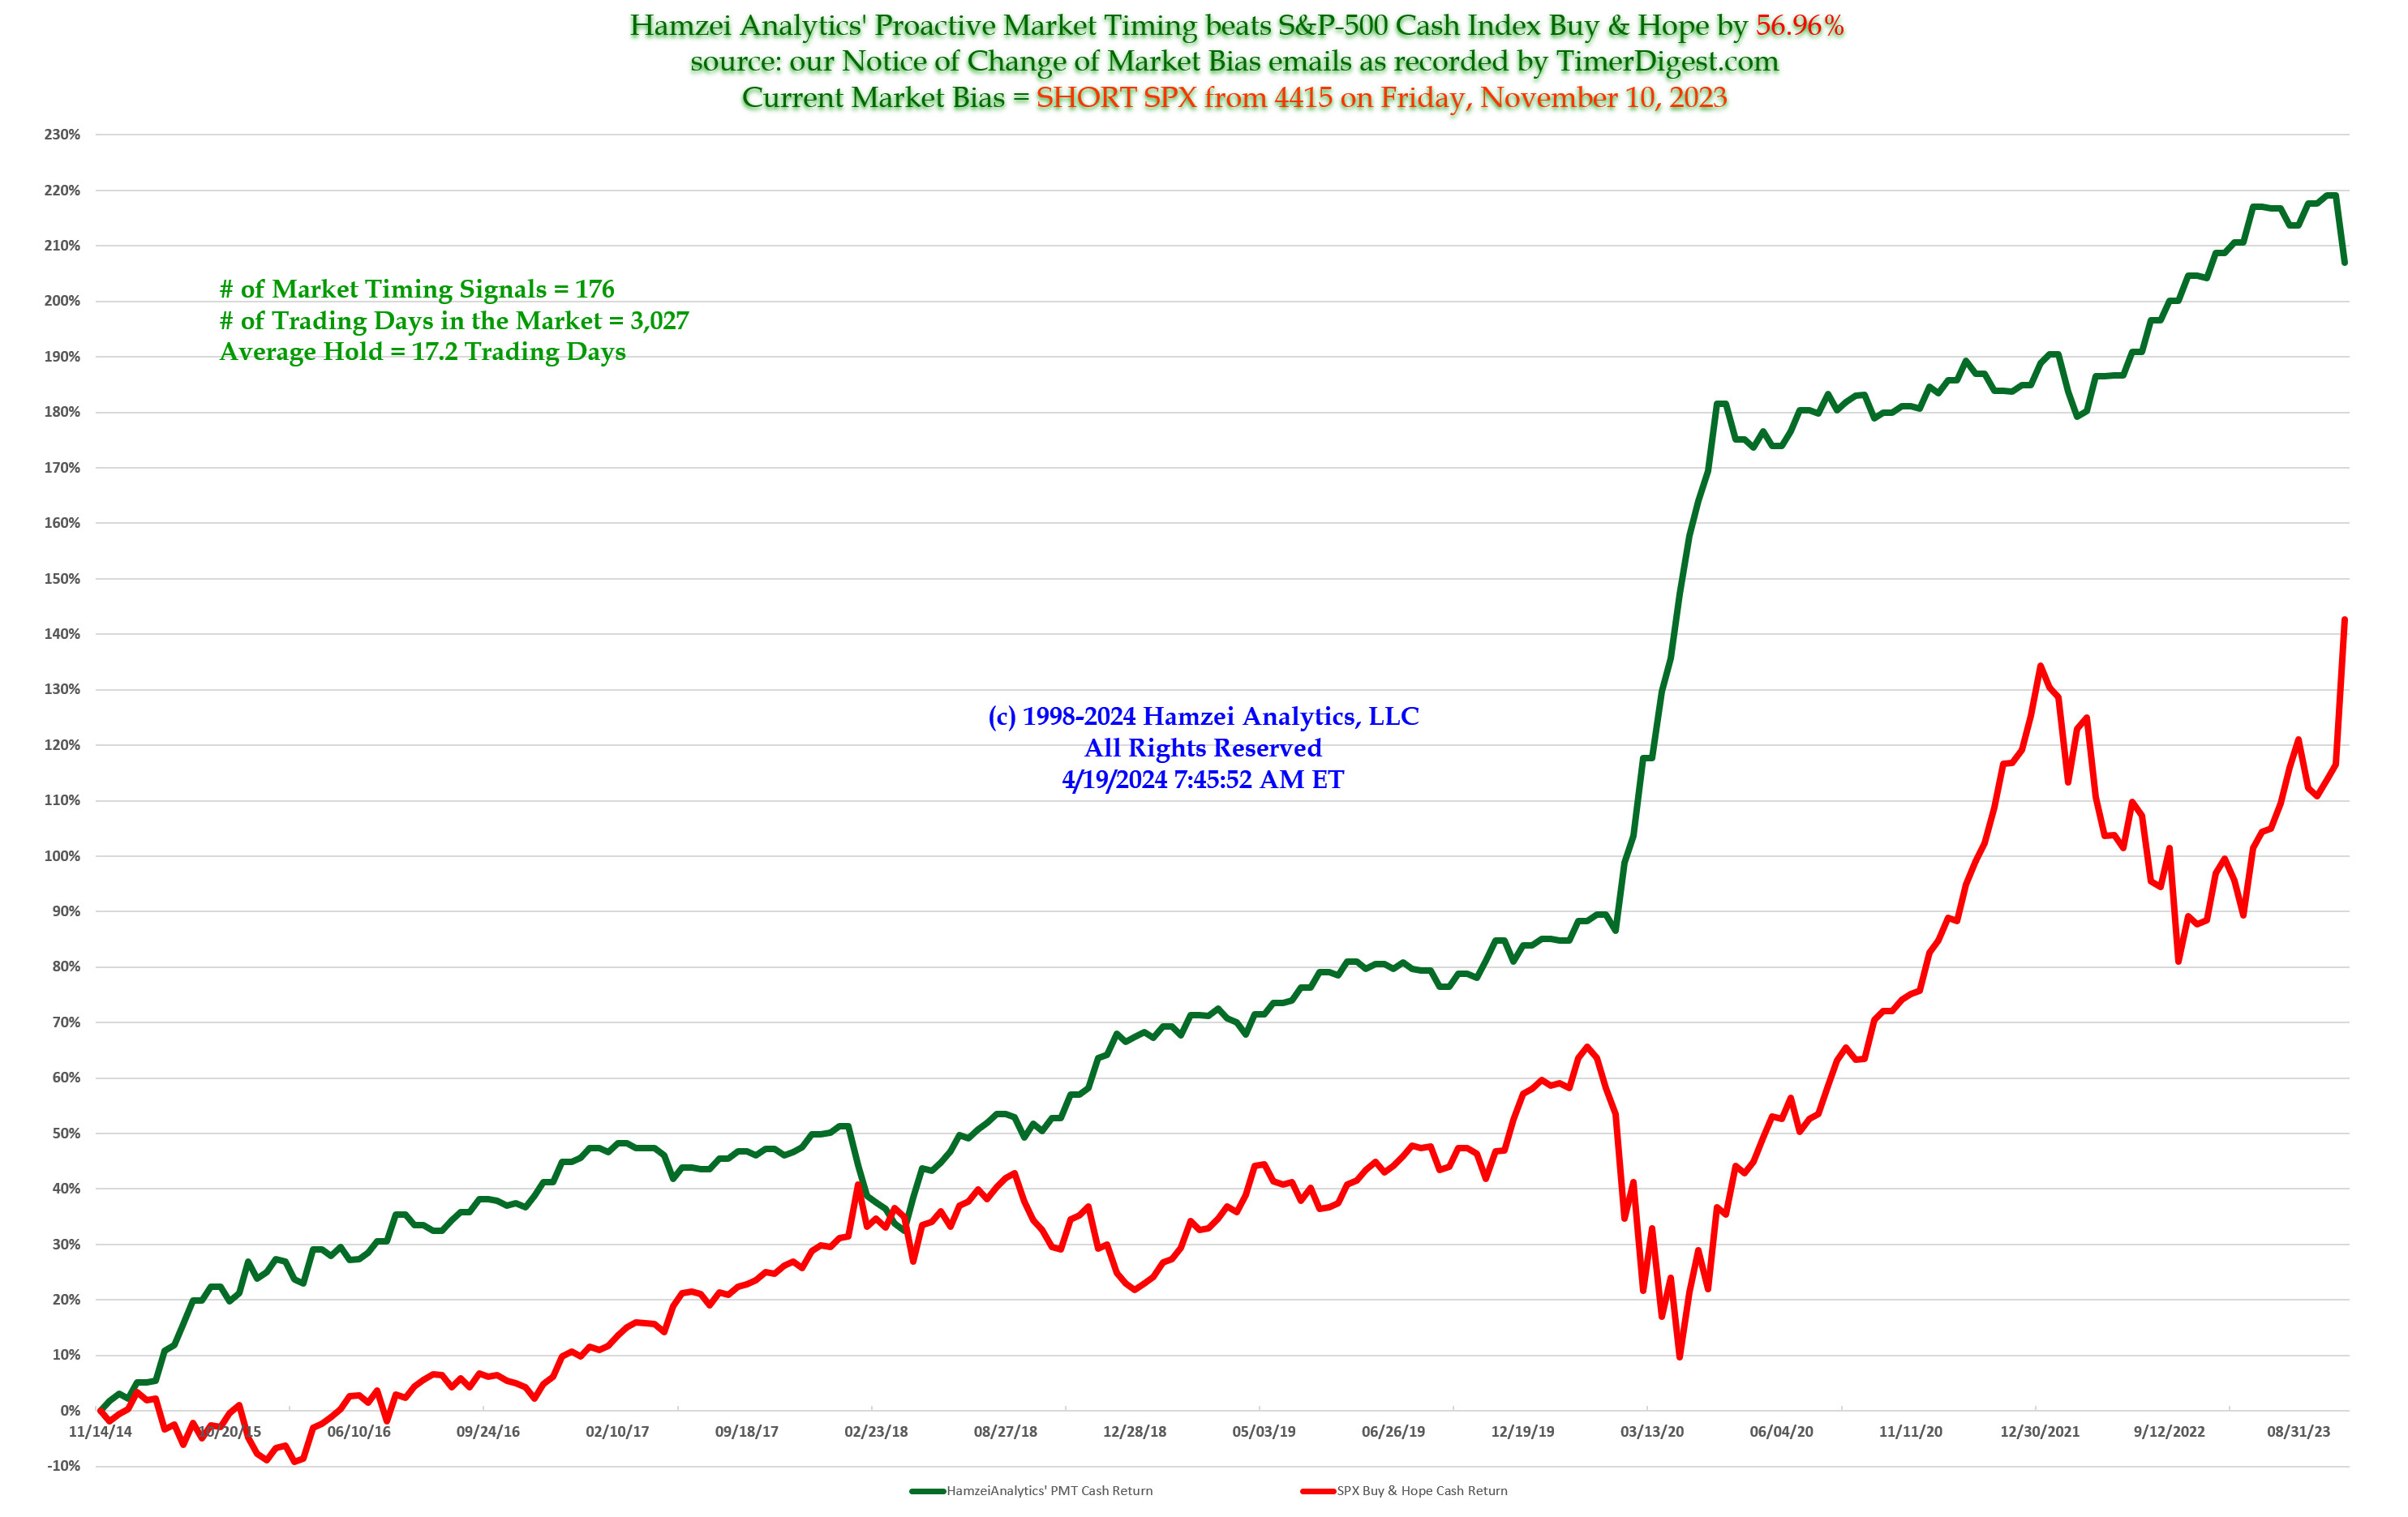
Most Recent PMT vs SPX Performance Chart
|
|
|
|
Friday, April 17, 2020, 0923ET
PMT Update for Issue #322 SECOND TRADE
Two items are worth noting:
SPX closed at ~2800 last night
ES Futures are up 63 handles as of this writing on news from GILD https://www.statnews.com/2020/04/16/early-peek-at-data-on-gilead-coronavirus-drug-suggests-patients-are-responding-to-treatment/
A) Our Money Management Stop for Issue #322 (second trade) is at 2855, which most likely will be overrun at the open.
B) We were slightly overbought as of last night. The move overnight will push us way up there back into clearly uber overbought territory and sets us up for a test of 50 day MA (which stood at 2872 as of last night). Although we think there may be some profit taking on select names and ES and NQ will come back down to more realistic numbers, still we think as of this time that, depending how the day progresses, we should also go FLAT SPX with Timer Digest today by the H-Hour (last hour of trading today).
++++++++++++++++++++++++++++++++++++++++++++++
after the Cash Open, this is what we observed:
SPX is trading at 2861.18
SPY is trading at 285.38
The midpoint price for our Long Put leg is trading approximately at 7.92
The midpoint price for our Short Put leg is trading approximately at 5.93
Therefore, the midpoint price for our Put Spread is trading approximately at 1.99
Fari Hamzei
|
|
|
|
|
|
Wednesday, April 15, 2020, 1108ET
LAUNCH COMMAND EMAIL >>> Trade for PMT Issue #322 SECOND TRADE
SPX is trading at 2768.4 now
SPY is trading at 276.2 now
The midpoint price for our Long Put leg is trading approximately at 11.92 now
The midpoint price for our Short Put leg is trading approximately at 9.16 now
Therefore, the midpoint price for our Put Spread is trading approximately at 2.72 now
@Admiral_Tiko: EXECUTE….. EXECUTE…..
Fari Hamzei
|
|
|
|
|
|
Wednesday, April 15, 2020, 1055ET
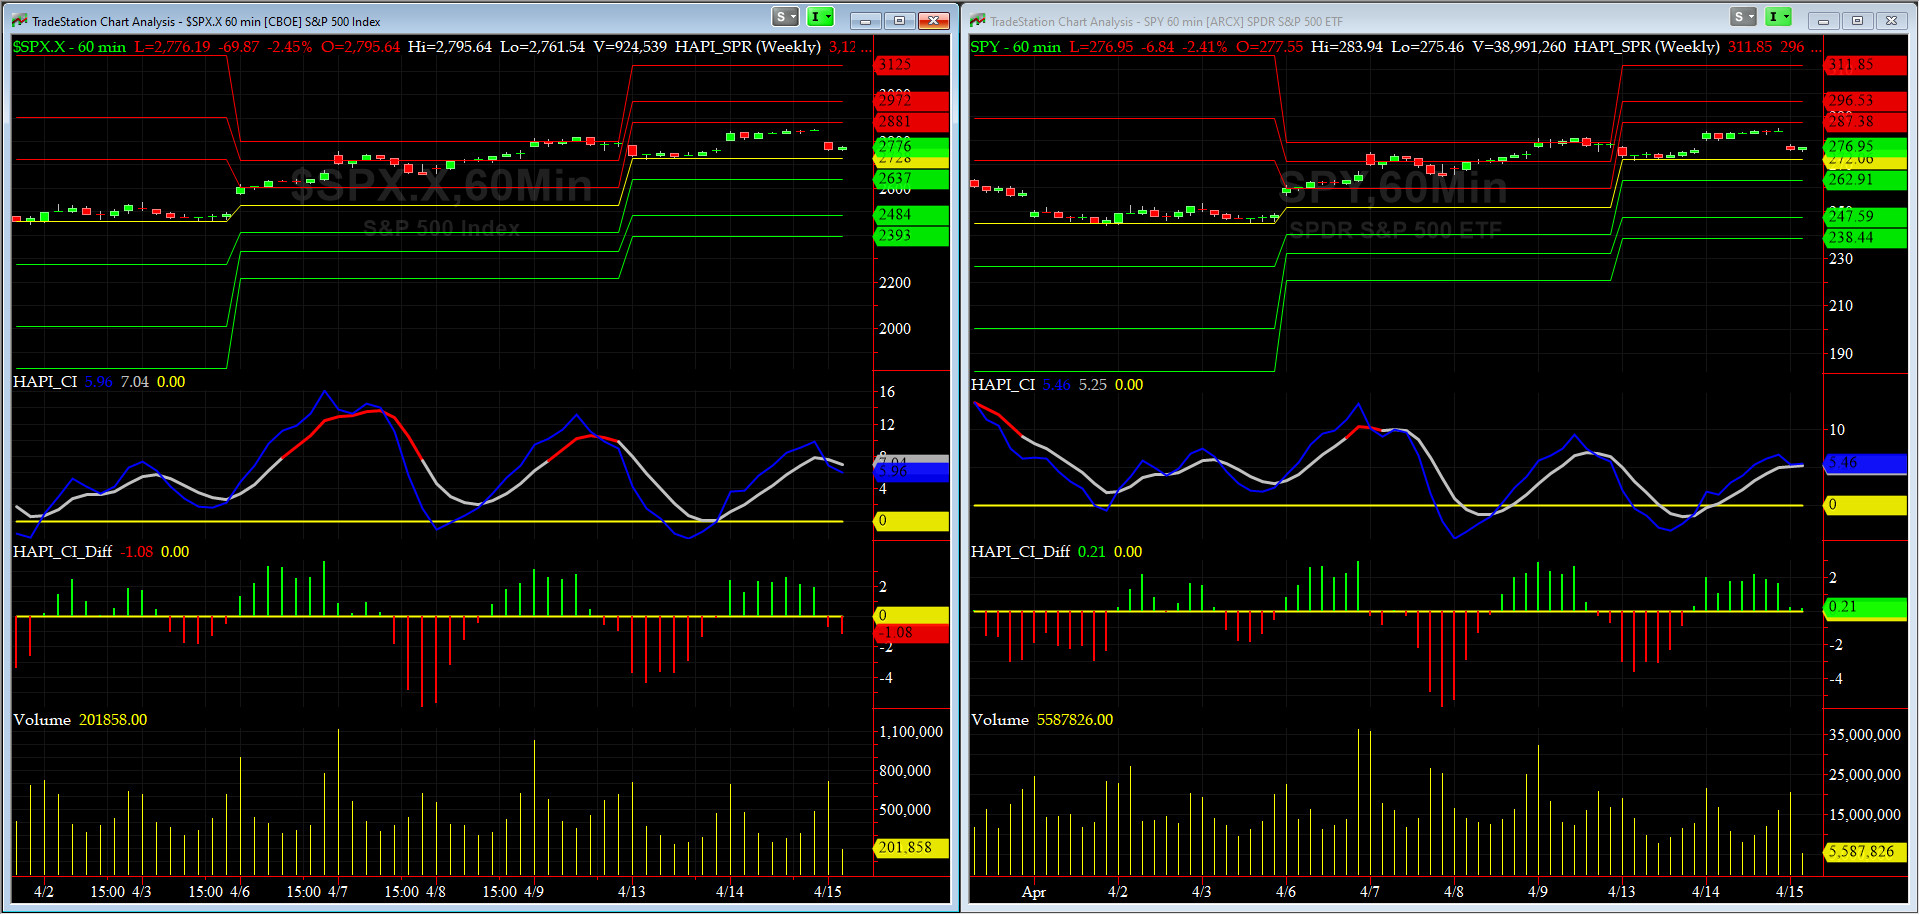
WEEKLY Support, Pivot & Resistance Levels Chart for Issue #322 SECOND TRADE
|
|
|
|
|
|
Wednesday, April 15, 2020, 1055ET
Market Bias for Issue #322 SECOND TRADE
Our current Market Bias with Timer Digest is FLAT SPX as of APR 13 at 2761
Our previous Market Bias was FLAT SPX as of APR 9 at 2790
Here are the trade parameters for this week:
SPX Money Management Stop for 100% of our position = 2855
SPX BreakEven Stop (Current Price) for last 20% of our position = 2770
SPX Primary Profit Target for first 80% of our position = 2720
SPX Secondary Profit Target for last 20% of our position = 2640
|
| Action |
Asset |
Expiration |
Strike |
Option |
Mid-Point |
| BUY |
SPY |
Friday MAY 15 |
276 |
Puts |
11.83 |
| SELL SHORT |
SPY |
Friday MAY 15 |
268 |
Puts |
8.93 |
| You need to execute both legs and hold it as a Put-Spread.
|
Note A:
Once the Primary Profit Target has been reached, traders are advised to close 80% of their position in order to lock in profits. The remaining balance can be carried over with a BreakEven STOP, based on the SPX level at the time of entry, in order to make the trade a zero-risk trade with the final position running to reach the Secondary Profit Target.
Once either Secondary Profit or Money Management (BreakEven STOP after the 80% peel-off) is hit, our Option/ETF trade for that week is over. Go to Cash and wait for the next PMT Issue.
Note B:
When we change our Market Bias with Timer Digest, You need to go FLAT asap. With PMT Pro, that is before the Close that day and with the basic PMT, at the open of the next day. The following trading day, we will issue new SPX targets and a new SPY options trade, as long as our new market bias with Timer Digest is NOT flat.
Fari Hamzei
|
|
|
|
|
|
Tuesday, April 14, 2020, 1745ET
PMT Issue #322 was stopped out today at 1550 ET
Some folks say it was NEWMAN who did it (he only shows up at 5 or 10 min to go LOL).
Since it is only Tuesday, we are looking at the updated PMT Charts and plotting our next course.
So please stay tuned……..
++++++++++++++++++++++++++++++++++++++++++++++++++++
SPX is trading at 2850 now
SPY is trading at 284.4 now
The midpoint price for our Long Put leg is trading approximately at 6.99 now
The midpoint price for our Short Put leg is trading approximately at 4.83 now
Therefore, the midpoint price for our Put Spread is trading approximately at 2.16 now
Fari Hamzei
|
|
|
|
|
|
Monday, April 13, 2020, 1425ET
Notice of Change of Market Bias with Timer Digest
Dear Jim,
This is a very news-driven market and we have been ovebought for about 2 weeks and we are about 50% retracement of drop since Valentine’s Day.
So odds of going higher from here are slim to none while any bad news can capsize this ship we are on (as we still look to observe a retest failure if bullish divergence back in mid-March has any validity).
Therefore, we are taking a small bearish stand here for next few days…..
Cheers......
Fari Hamzei
|
|
|
|
|
|
Monday, April 13, 2020, 1414ET
LAUNCH COMMAND EMAIL >>> Trade for PMT Issue #322
SPX is trading at 2743 now
SPY is trading at 273.4 now
The midpoint price for our Long Put leg is trading approximately at 11.51 now
The midpoint price for our Short Put leg is trading approximately at 8.73 now
Therefore, the midpoint price for our Put Spread is trading approximately at 2.78 now
@Admiral_Tiko: EXECUTE….. EXECUTE…..
Fari Hamzei
|
|
|
|
|
|
Monday, April 13, 2020, 1410ET
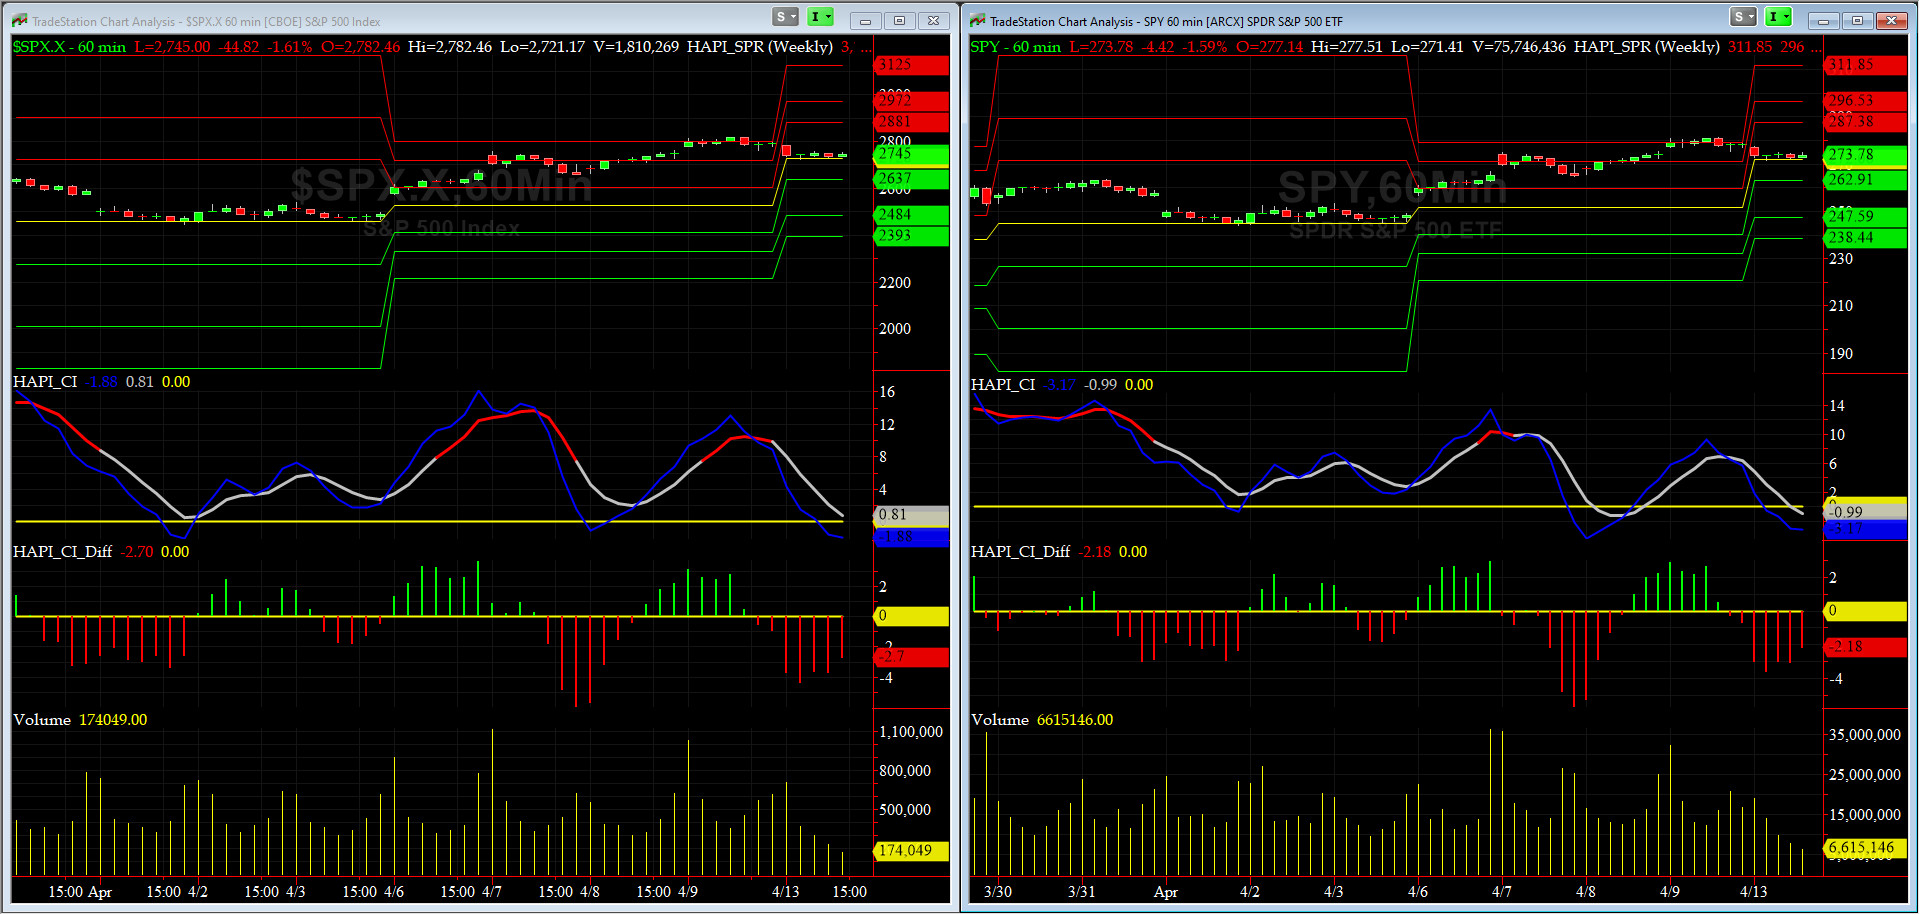
**UPDATED** WEEKLY Support, Pivot & Resistance Levels Chart for Issue #322
|
|
|
|
|
|
Monday, April 13, 2020, 1405ET
**UPDATED** Market Bias for Issue #322
Our current Market Bias with Timer Digest is FLAT SPX as of APR 9 at 2790
Our previous Market Bias was LONG SPX as of APR 3 at 2488
Here are the trade parameters for this week:
SPX Money Management Stop for 100% of our position = 2850
SPX BreakEven Stop (Current Price) for last 20% of our position = 2750
SPX Primary Profit Target for first 80% of our position = 2680
SPX Secondary Profit Target for last 20% of our position = 2540
|
| Action |
Asset |
Expiration |
Strike |
Option |
Mid-Point |
| BUY |
SPY |
Friday MAY 8 |
274 |
Puts |
11.48 |
| SELL SHORT |
SPY |
Friday MAY 8 |
267 |
Puts |
8.73 |
| You need to execute both legs and hold it as a Put-Spread.
|
Note A:
Once the Primary Profit Target has been reached, traders are advised to close 80% of their position in order to lock in profits. The remaining balance can be carried over with a BreakEven STOP, based on the SPX level at the time of entry, in order to make the trade a zero-risk trade with the final position running to reach the Secondary Profit Target.
Once either Secondary Profit or Money Management (BreakEven STOP after the 80% peel-off) is hit, our Option/ETF trade for that week is over. Go to Cash and wait for the next PMT Issue.
Note B:
When we change our Market Bias with Timer Digest, You need to go FLAT asap. With PMT Pro, that is before the Close that day and with the basic PMT, at the open of the next day. The following trading day, we will issue new SPX targets and a new SPY options trade, as long as our new market bias with Timer Digest is NOT flat.
Fari Hamzei
|
|
|
|
|
|
Sunday, April 12, 2020, 1845ET
Market Timing Charts, Analysis & Commentary for Issue #322

Timer Charts of S&P-500 Cash Index (SPX) + NASDAQ-100 Cash Index (NDX)
Most recent S&P-500 Cash Index (SPX) Close: 2790 up 302 (up +12%) for last 4 trading days ending on Monday, April 6, 2020, which closed very near its +1 sigma.
DJIA ALL TIME INTRADAY HIGH = 29568 reached on Wednesday, February 12, 2020
DJT ALL TIME INTRADAY HIGH = 11623 reached on Friday, September 14, 2018
SPX ALL TIME INTRADAY HIGH = 3258 reached on Wednesday, February 19, 2020
NDX ALL TIME INTRADAY HIGH = 8873 reached on Wednesday, February 19, 2020
RUT ALL TIME INTRADAY HIGH = 1742 reached on Friday, August 31, 2018
Current DAILY +2 Sigma SPX = 2818 with WEEKLY +2 Sigma = 3677
Current DAILY 0 Sigma SPX = 2532 with WEEKLY 0 Sigma = 3054
Current DAILY -2 Sigma SPX = 2245 with WEEKLY -2 Sigma = 2431
NYSE McClellan Oscillator = +355 (-150 is start of the O/S area; around -275 to -300 area or lower, we go into the “launch-pad” mode; over +150, we are in O/B area)
NYSE Breadth Thrust = 55.5 (40 is considered as oversold and 65 as overbought)
This market continues to be totally news driven..... we hit +2 sigma in 4 days and we should see a pullback the extent of which will be news driven. If SPX trades this week above 2910-2960, all bearish bets are off.
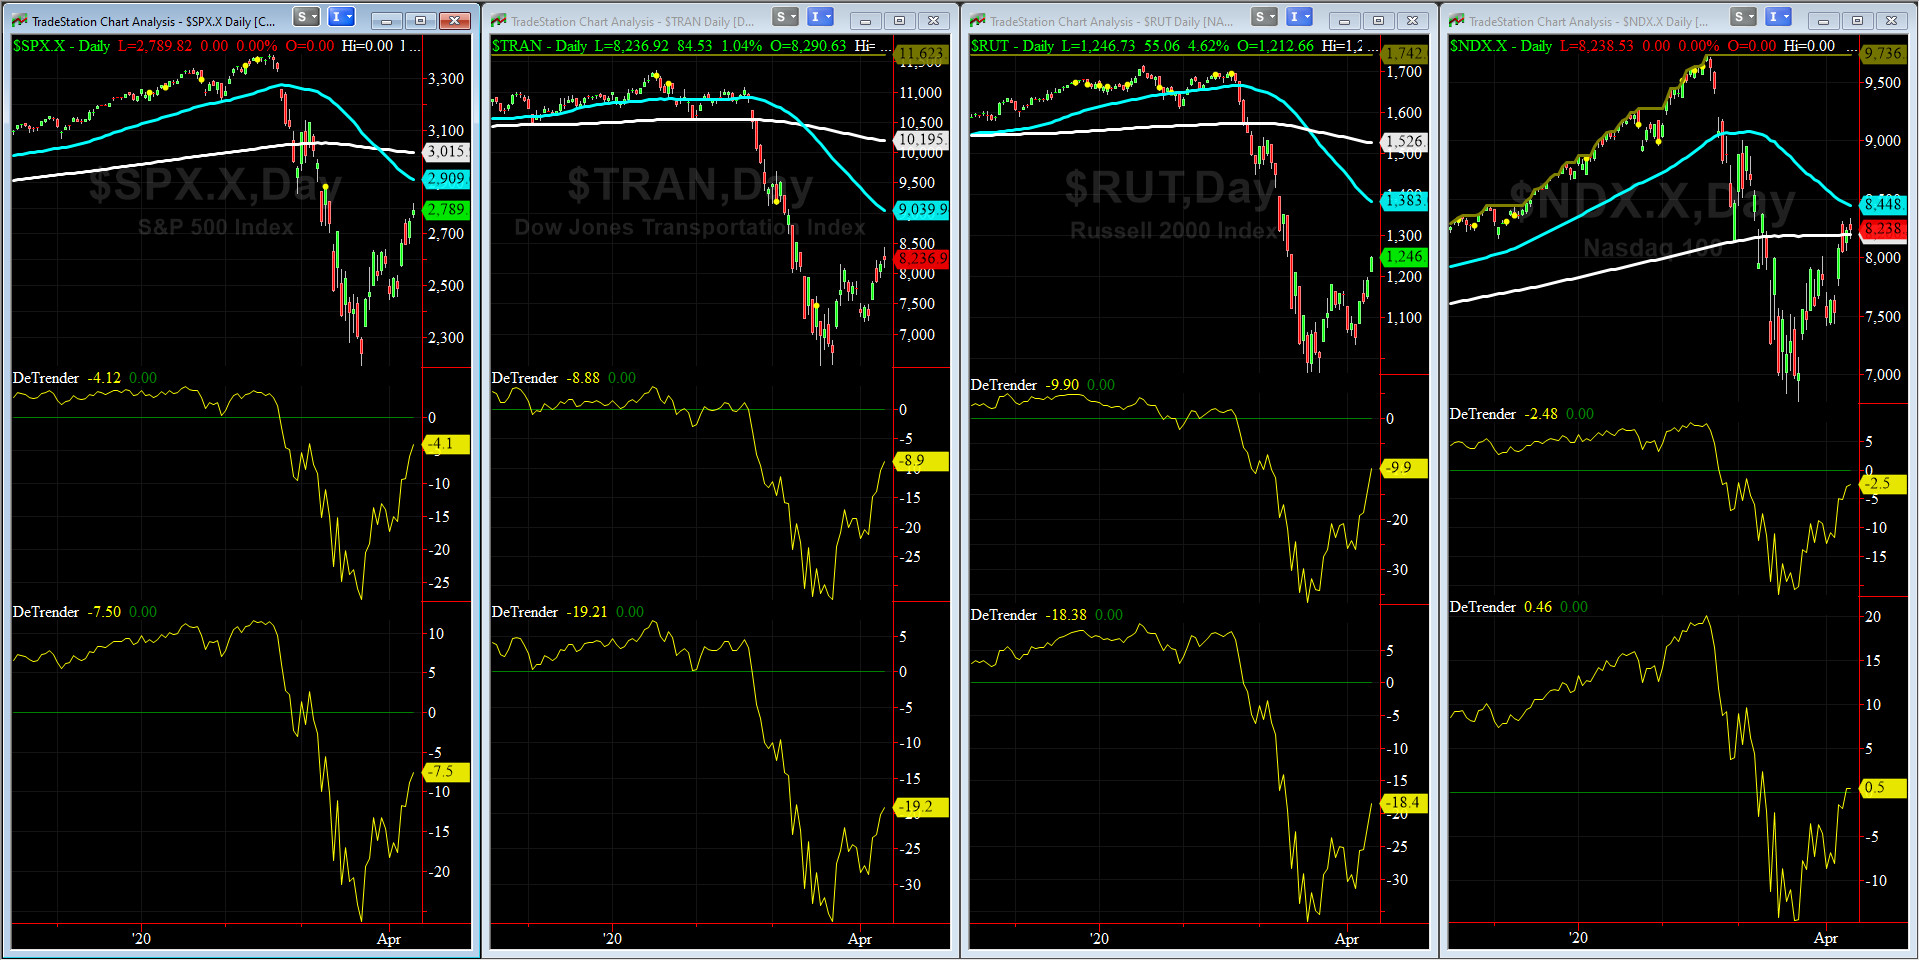
DeTrenders Charts for SPX, NDX, TRAN & RUT Indices
200-Day MA DJ TRAN = 10,195 or 19.2% ABOVE the DJ TRAN (max observed in last 7 yrs = 20.2%, min = -20.3%)
200-Day MA RUT = 1526 or 18.4% ABOVE RUT (max observed in last 7 yrs = 21.3%, min = -22.6%)
50-Day MA SPX = 2909 or 4.1% ABOVE SPX (max observed in last 7 yrs = +8.6%, min = -9.3%)
200-Day MA SPX = 3016 or 7.5% ABOVE SPX (max observed in last 7 yrs = 15.2%, min = -14%)
DJ Transportation Index (proxy for economic conditions 6 to 9 months hence) had a nice week and rallied.
Russell 2000 Small Caps Index (proxy for Risk ON/OFF) also behaved pretty much the same. RISK still remains nonexistent for now.
Only ONE of our EIGHT DeTrenders are in the POSITIVE territory. The DeTrenders for DJ Tran & RUT will continue to be harbingers of future price behavior in broad indices.
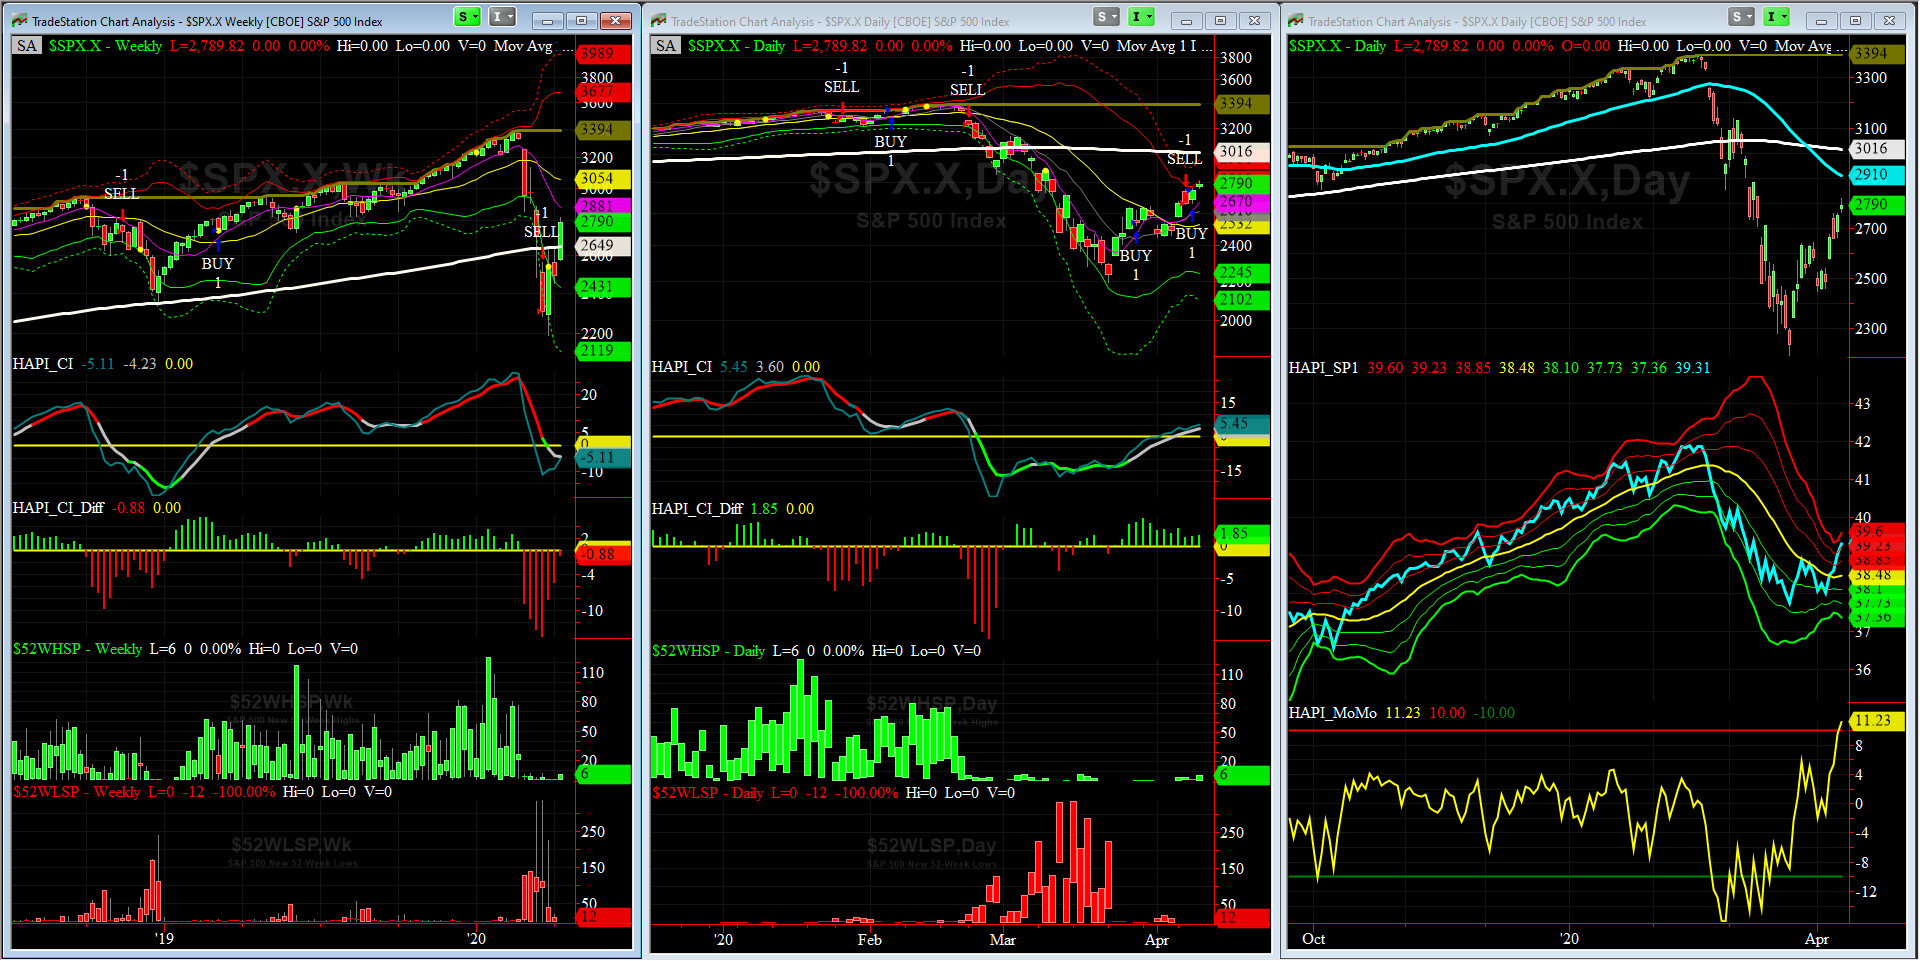
HA_SP1_Momo Chart
WEEKLY Timing Model = on a SELL Signal since Friday, March 20, 2019 CLOSE at 2304
DAILY Timing Model = on a BUY Signal since Friday, April 8, 2020 CLOSE at 2750
Max SPX 52wk-highs reading last week = 6 (over 120-140, the local maxima is in)
Max SPX 52wk-Lows reading last week = 21 (over 40-60, the local minima is in)
HA_SP1 closed over its +2 sigma channels
HA_Momo = +11.23 (reversals most likely occur above +10 or below -10)
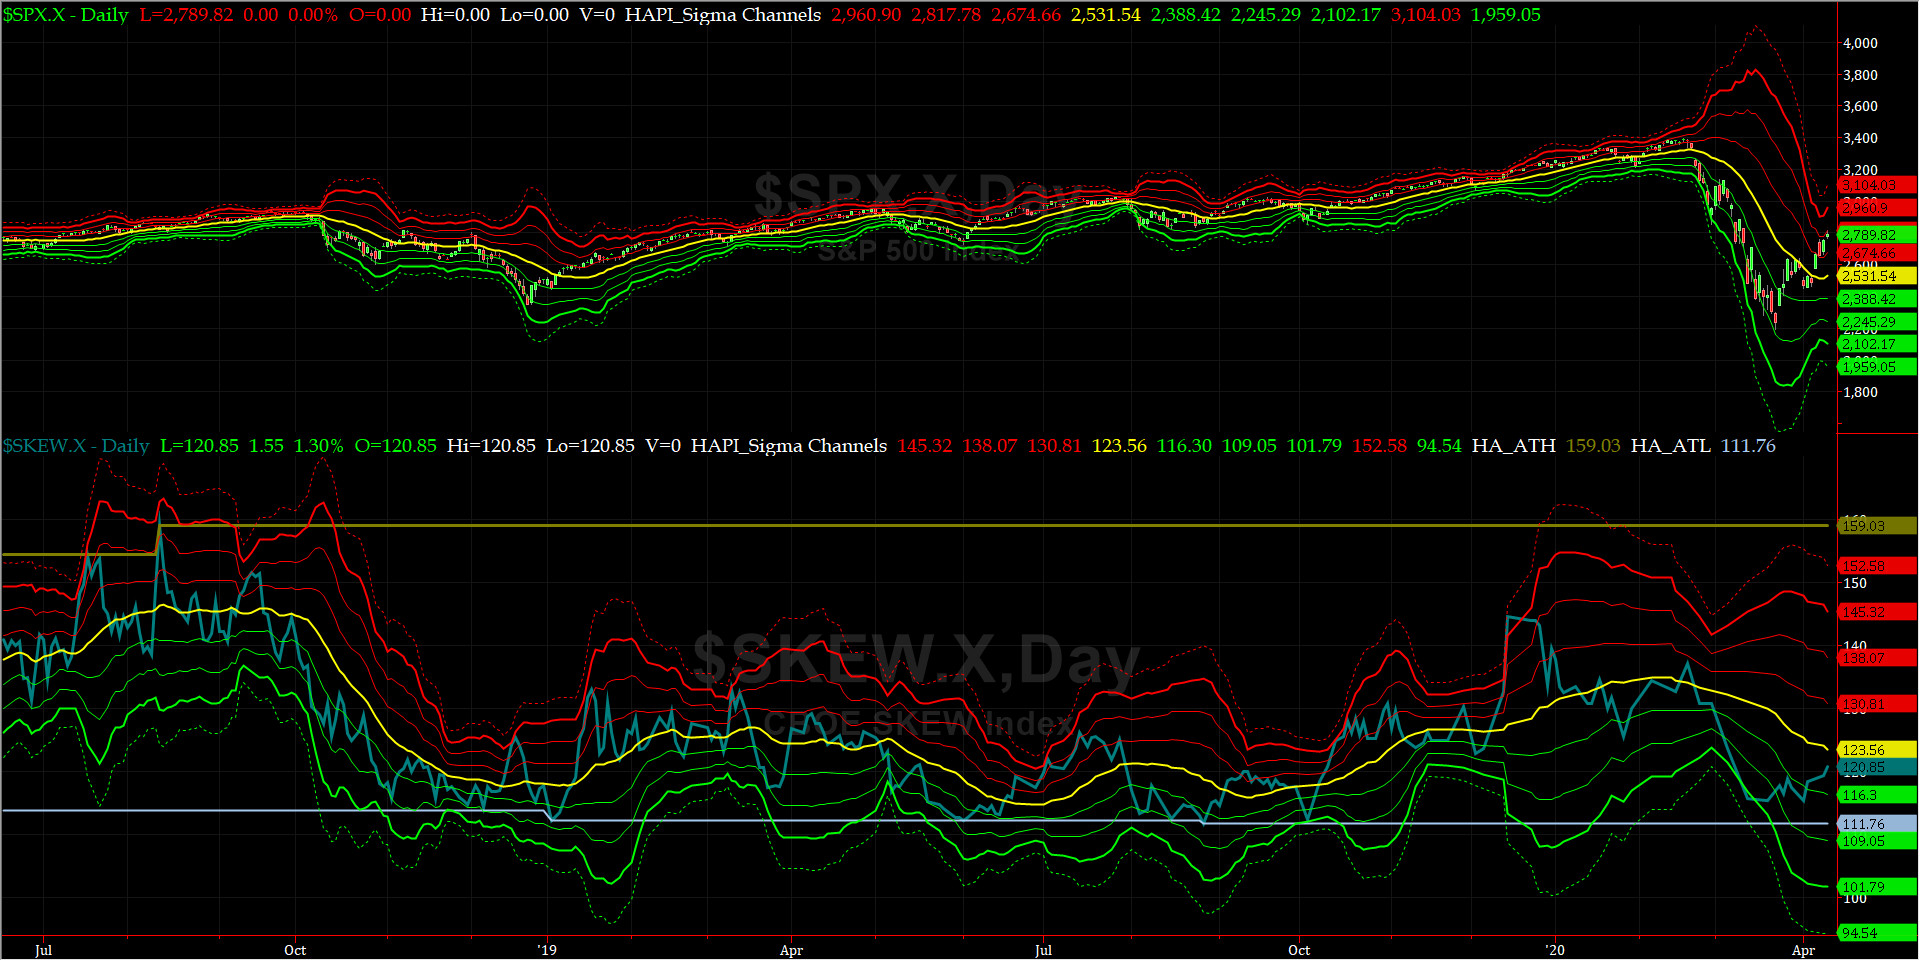
SPX SKEW (Downside Tail Risk) Chart
1
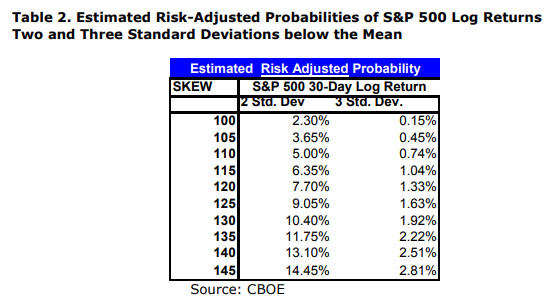
This week SPX SKEW (Downside Tail Risk) eased off on Thursday (SKEW is NOT computed every day any more) and closed at 120.8, about its negative 0.5 sigma (normal = 115, range 100-150).
All quiet on the Eastern & Mid-Western Fronts? our beloved & newly promoted HRH Admiral Tiko, KCPE, says NO, ALL IS NOT WELL
How to interpret the value of SPX SKEW? (from CBOE white paper on SKEW)
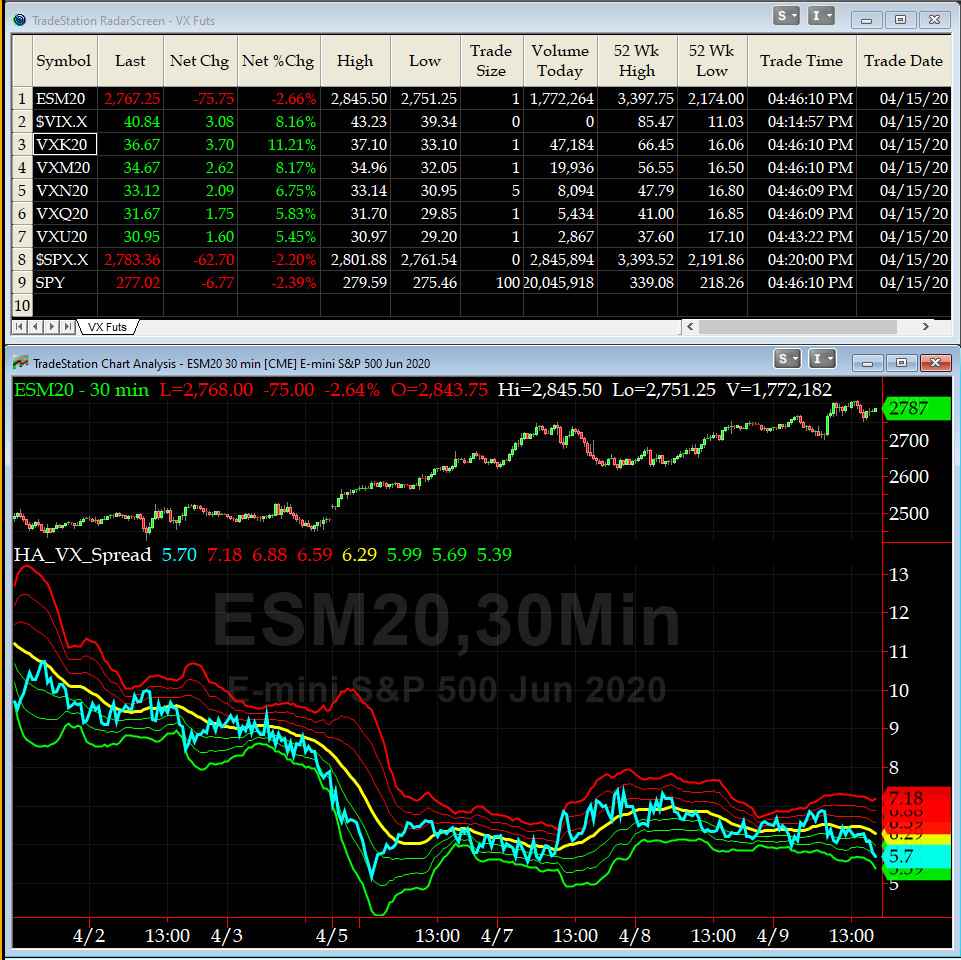
3-month VIX Futures Spread(VX) Chart
This popular timing indicator for identifying tradable bottoms, (now long MAY20, & short AUG20 VIX Futures) hit +5.7 Thursday at the Close. We continue to observe values for this spread that we have never seen before (note: we were NOT running this chart during 2008-2009 financial debacle).

HA_SP2 Chart
HA_SP2 = 74.9 (Buy signal <= 25, Sell Signal >= 75)
This indicator says we are now at overbought conditions.
Fari Hamzei
|
|
|
|
|
|
Customer Care:
|
|
|
|
|
|
|
 |
 |
|
 |
|
 |
 |
 |
HA YouTube Channel ::: HA Blog ::: Testimonials ::: Tutorials & FAQs ::: Privacy Policy
|
Trading Derivatives (Options & Futures) contains substantial risk and is not for every investor. An investor could potentially lose all or more than his/her initial investment.
Only risk capital should be used for trading and only those with sufficient risk capital should consider trading derivatives. Past performance is not
necessarily indicative of future results. Testimonials appearing on this website may not be representative of other clients or customers
and are not a guarantee of future performance or success.
|
| (c) 1998-2025, Hamzei Analytics, LLC.® All Rights Reserved. |
|
|

