
|
 |
 |
 |
 |
 |
 |
 |
 |
 Proactive Market Timing Proactive Market Timing
|
|
|
Most Recent PMT vs SPX Performance Chart

|
|
|
|
Thursday, April 30, 2020, 2025ET
Notice of Change of Bias with Timer Digest
Obviously we panicked yesterday and missed a 27-handle reprieve given out to all today in SPX.
Going back to SHORT SPX again��.
As a CIA subcontractor, Joubert, said to Turner, in Three days of Condor (1975): No need to believe in either side, or any side. There is no cause. There's only yourself. The belief is in your own precision.
Joubert & Turner
Cheers����.
Fari Hamzei
|
|
|
|
|
|
Thrusday, April 30, 2020, 1130ET
a quick review for PMT Members
As expected in our last night email to you, we are extremely overbought here (specially as one of our more astute & loyal clients noted to us yesterday: SPX is underneath its 200-day MA = 3006 level as of this writing).
Also worth noting is that SPX hit our MMStop of 2950 for PMT Issue #323 at about 3pm ET yesterday � HoD was 2954 � yes it was a wider than normal stop and that is why we were so shocked that it was breached.
But that is all in the past��.
Now we are at
SPX = ~2914, down 25 handles
HoD = ~2931
LoD = ~2903
Here is our current decision matrix:
a) If you are still long the PMT Issue #323 Put Spread (short bias held overnight), then continue holding it at least for today, but need be on close watch tomorrow as it is first of the month � although we would doubt much that fresh money will be coming in, in size, like most �normal� months. When we issue a new short bias trade, you need to roll it over. If we give you a long bias trade, then that is a no-brainer. You cover PMT Issue #323 Put Spread and get into the long Call Spread trade.
b) If you did get out yesterday, well, you did the right thing given our over all trade protocol. We will most likely get short again and will issue a new trade when that time comes.
You will have another update tomorrow about the same time, ceteris paribus.
Be Safe��.
Fari Hamzei
|
|
|
|
|
|
Wednesday, April 29, 2020, 1933ET
Notice of Change of Bias with Timer Digest
This just went to Timer Digest.
I was truly shocked today�s by SPX performance.
Tomorrow, very early in RTH (after options are open), we will make a decision to stay with or dump our put spreads.
I am very sorry about last two trades off same market bias.
The Remdesivir news from GILD is still very preliminary, according to biotech folks that I have talked to today, and yet, this market reacts like a bunch of teenagers at a Friday night football game.
This shall pass too��
-f
+++++++++++++++++++++++++++++++++++++++++++++++++++++++++
Dear Jim,
A super majority of our short-term market timing indicators show that we are at moderately to extremely overbought conditions, and, yet our markets continue to rally even as our total confirmed COVID-19 infected cases, hospitalizations & deaths continue to mount.
I can�t sit here and trade futures against my market bias.
We have given back 6% in last two weeks, but we are still ahead by 131% above SPX in last 5 years � see attached chart.
So, for now, we are going to go FLAT SPX for about a week. If markets turns south, we will jump back sooner. If it continues to rise, then we have recalibrate and make another call.
Fari Hamzei
|
|
|
|
|
|
Tuesday, April 28, 2020, 2100ET
Market Timing Charts, Analysis & Commentary for Issue #324

Timer Charts of S&P-500 Cash Index (SPX) + NASDAQ-100 Cash Index (NDX)
Most recent S&P-500 Cash Index (SPX) Close: 2863 up +40 (up +1.4%) for last six days ending on Tuesday, April 28, 2020, which closed very near its +1 sigma.
DJIA ALL TIME INTRADAY HIGH = 29568 reached on Wednesday, February 12, 2020
DJT ALL TIME INTRADAY HIGH = 11623 reached on Friday, September 14, 2018
SPX ALL TIME INTRADAY HIGH = 3258 reached on Wednesday, February 19, 2020
NDX ALL TIME INTRADAY HIGH = 8873 reached on Wednesday, February 19, 2020
RUT ALL TIME INTRADAY HIGH = 1742 reached on Friday, August 31, 2018
Current DAILY +2 Sigma SPX = 2987 with WEEKLY +2 Sigma = 3641
Current DAILY 0 Sigma SPX = 2737 with WEEKLY 0 Sigma = 3010
Current DAILY -2 Sigma SPX = 2487 with WEEKLY -2 Sigma = 2379
NYSE McClellan Oscillator = +236 (-150 is start of the O/S area; around -275 to -300 area or lower, we go into the �launch-pad� mode; over +150, we are in O/B area)
NYSE Breadth Thrust = 52.8 (40 is considered as oversold and 65 as overbought)
SPX is above its 50-day and below its 200-day MAs (death cross config). NDX is above both of its 50-day and 2009 day MAs (they are near their death cross).
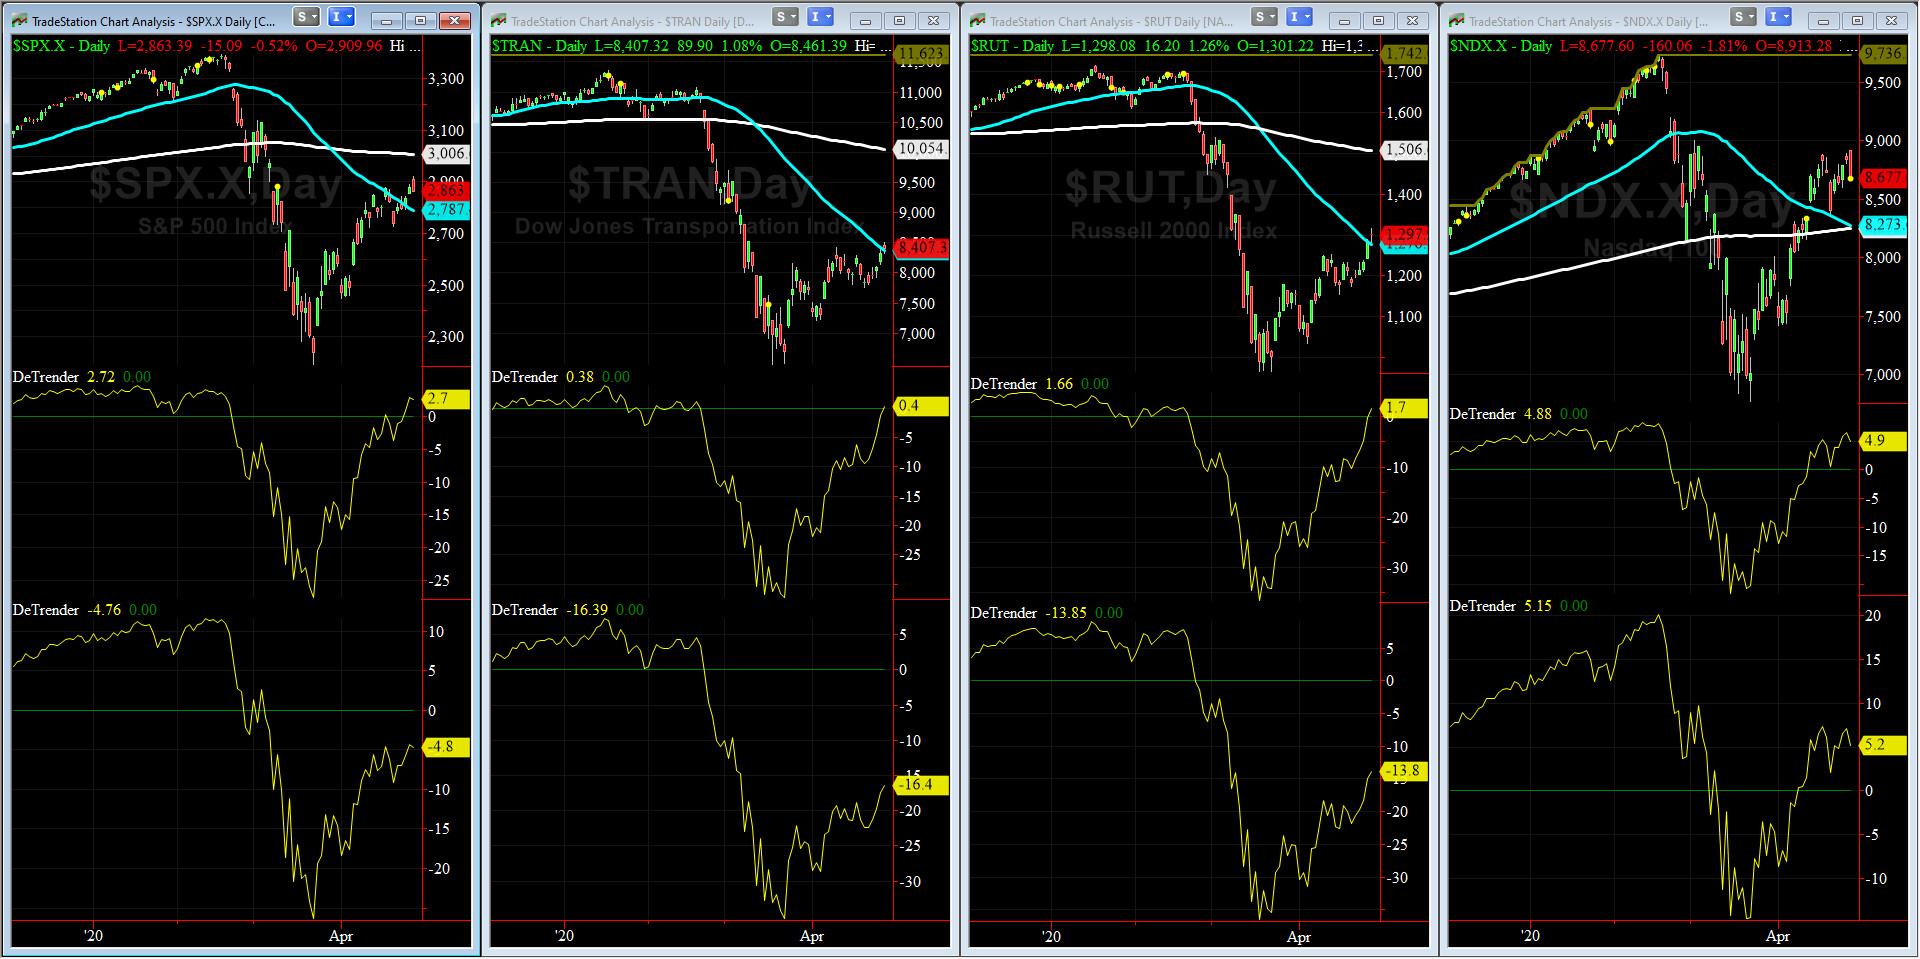
DeTrenders Charts for SPX, NDX, TRAN & RUT Indices
200-Day MA DJ TRAN = 10,054 or 16.4% ABOVE the DJ TRAN (max observed in last 7 yrs = 20.2%, min = -20.3%)
200-Day MA RUT = 1506 or 13.8% ABOVE RUT (max observed in last 7 yrs = 21.3%, min = -22.6%)
50-Day MA SPX = 2787 or 2.7% ABOVE SPX (max observed in last 7 yrs = +8.6%, min = -9.3%)
200-Day MA SPX = 3006 or 2.7% BELOW SPX (max observed in last 7 yrs = 15.2%, min = -14%)
DJ Transportation Index (proxy for economic conditions 6 to 9 months hence) has had a decent week and closed at its 50-day MA.
Russell 2000 Small Caps Index (proxy for Risk ON/OFF) had another excellent week and tested its 50-day MA. But, RISK remains OFF for now.
Only FIVE of our EIGHT DeTrenders are in the POSITIVE territory. The DeTrenders for DJ Tran & RUT will continue to be harbingers of future price behavior in broad indices.

HA_SP1_Momo Chart
WEEKLY Timing Model = on a SELL Signal since Friday, March 20, 2020 CLOSE at 2304
DAILY Timing Model = on a BUY Signal since Tuesday, April 28, 2020 CLOSE at 2863
Max SPX 52wk-highs reading last week = 2 (over 120-140, the local maxima is in)
Max SPX 52wk-Lows reading last week = 1 (over 40-60, the local minima is in)
HA_SP1 closed near its +2 sigma channels
HA_Momo = +9.36 (reversals most likely occur above +10 or below -10)
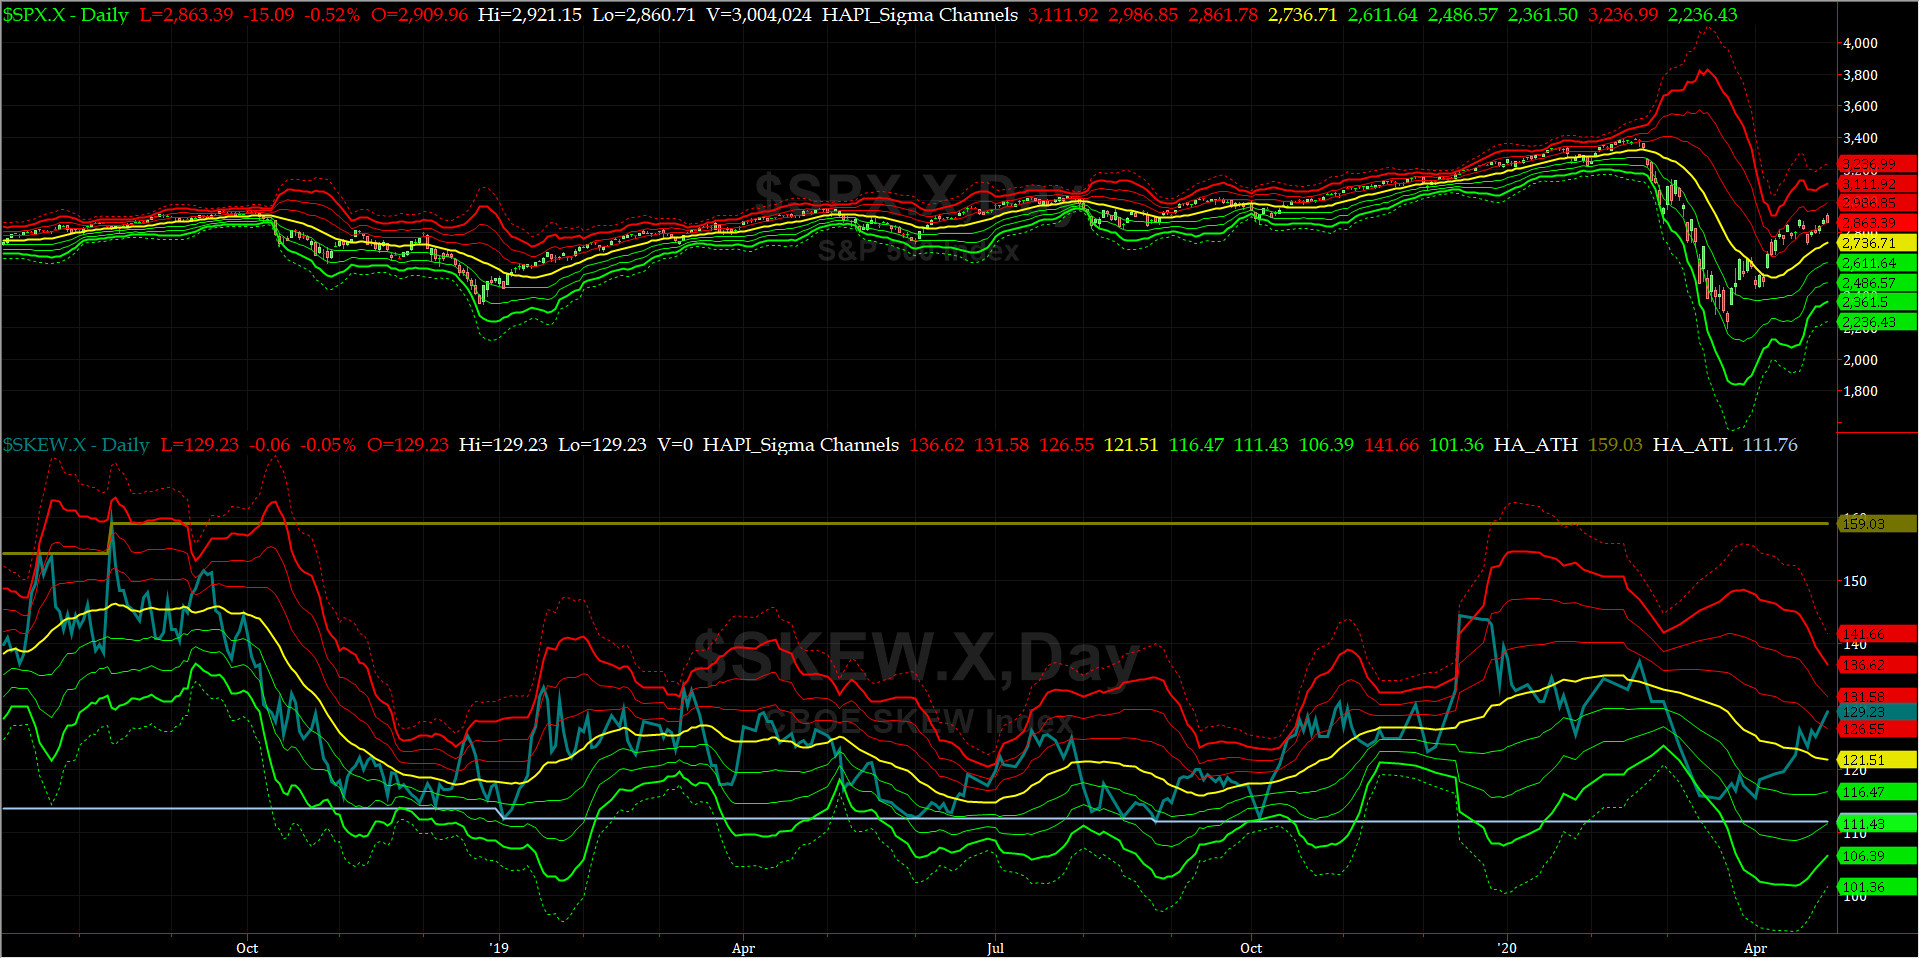
SPX SKEW (Downside Tail Risk) Chart
This week SPX SKEW (Downside Tail Risk) eased off on Thursday (SKEW is NOT computed every day any more) and closed at 129.2, now about its +1.5 sigma (normal = 115, range 100-150).
All quiet on the Eastern & Mid-Western Fronts? our beloved Admiral Tiko, KCPE, says NO, ALL IS NOT WELL..... (VADM Tiko notes that on Feb 20, SKEW was at 137+ or its +1 sigma)
How to interpret the value of SPX SKEW? (from CBOE white paper on SKEW)

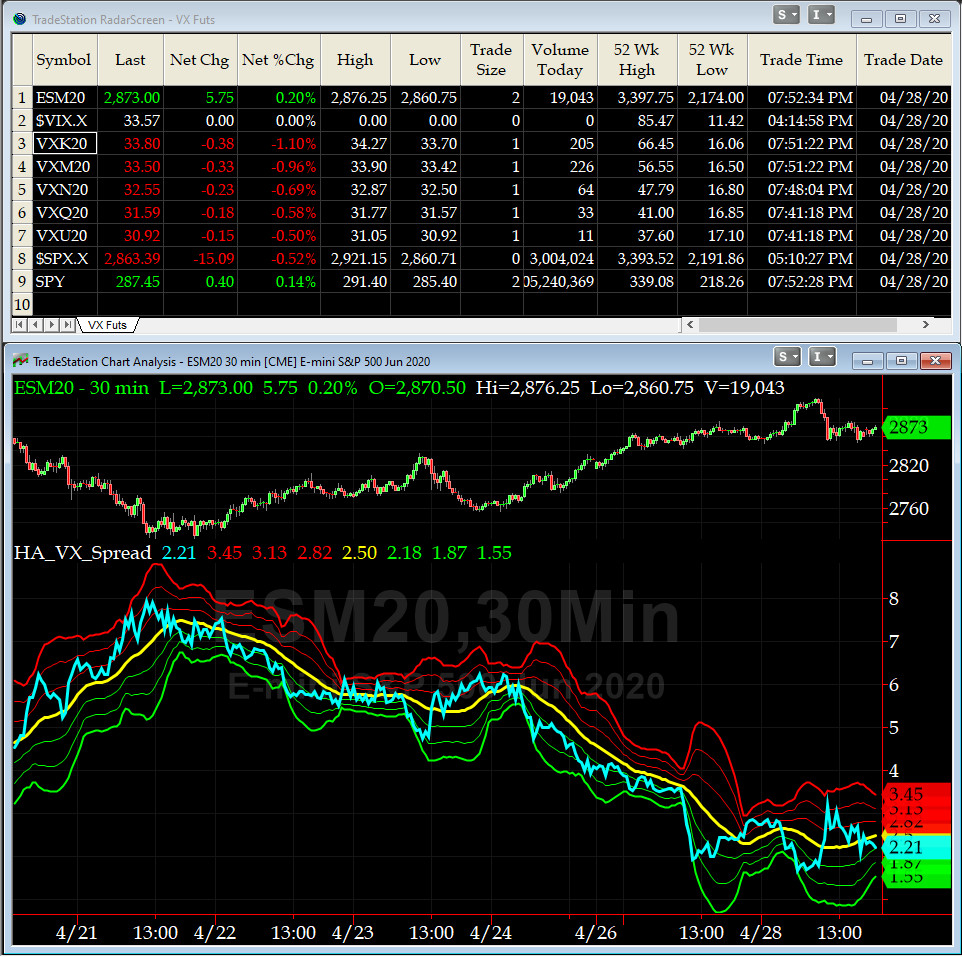
3-month VIX Futures Spread(VX) Chart
This popular timing indicator for identifying tradable bottoms, (now long MAY20, & short AUG20 VIX Futures) hit +2.2 at the Close. This reads more like a top.
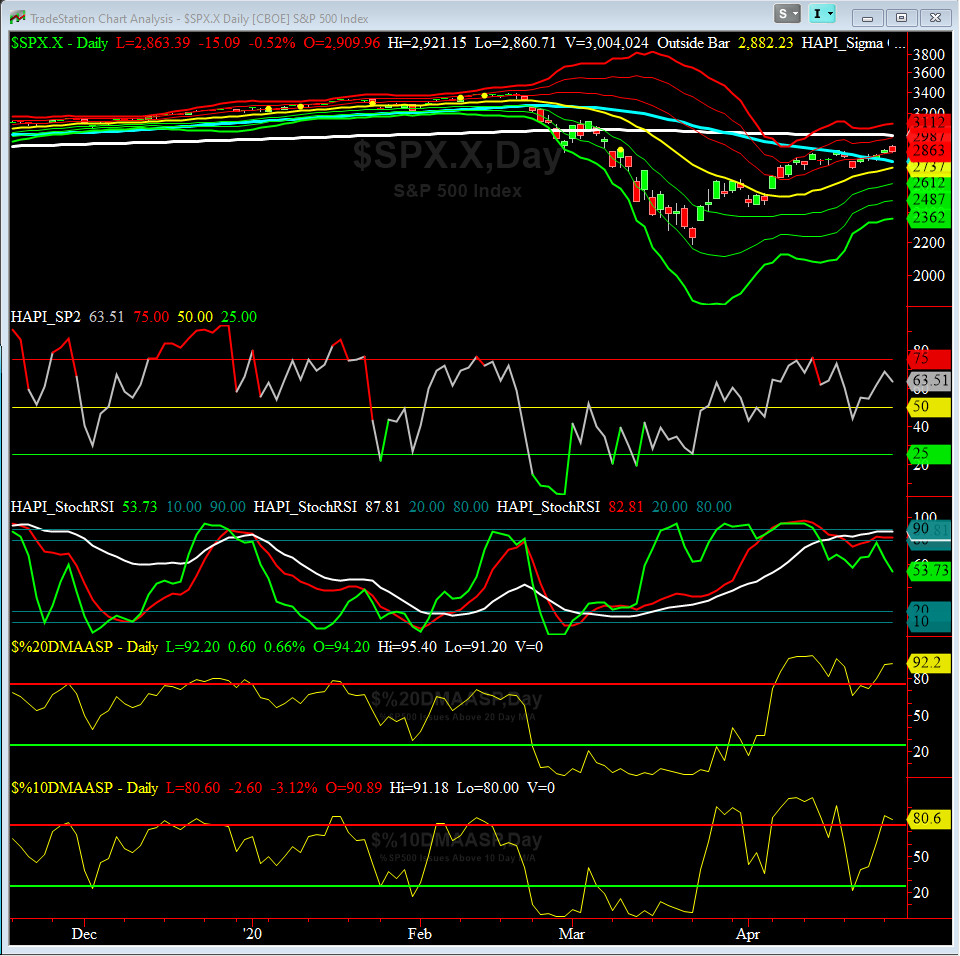
HA_SP2 Chart
HA_SP2 = 63.5 (Buy signal <= 25, Sell Signal >= 75)
This indicator says we were overobught and now we have pulled back and could be heading to neutral zone (50 area).
Fari Hamzei
|
|
|
|
|
|
Customer Care:
|
|
|
|
|
|
|
|
|
|


