|
Tuesday, May 12, 2020, 2000ET
Market Timing Charts, Analysis & Commentary for Issue #326
Timer Charts of S&P-500 Cash Index (SPX) + NASDAQ-100 Cash Index (NDX)
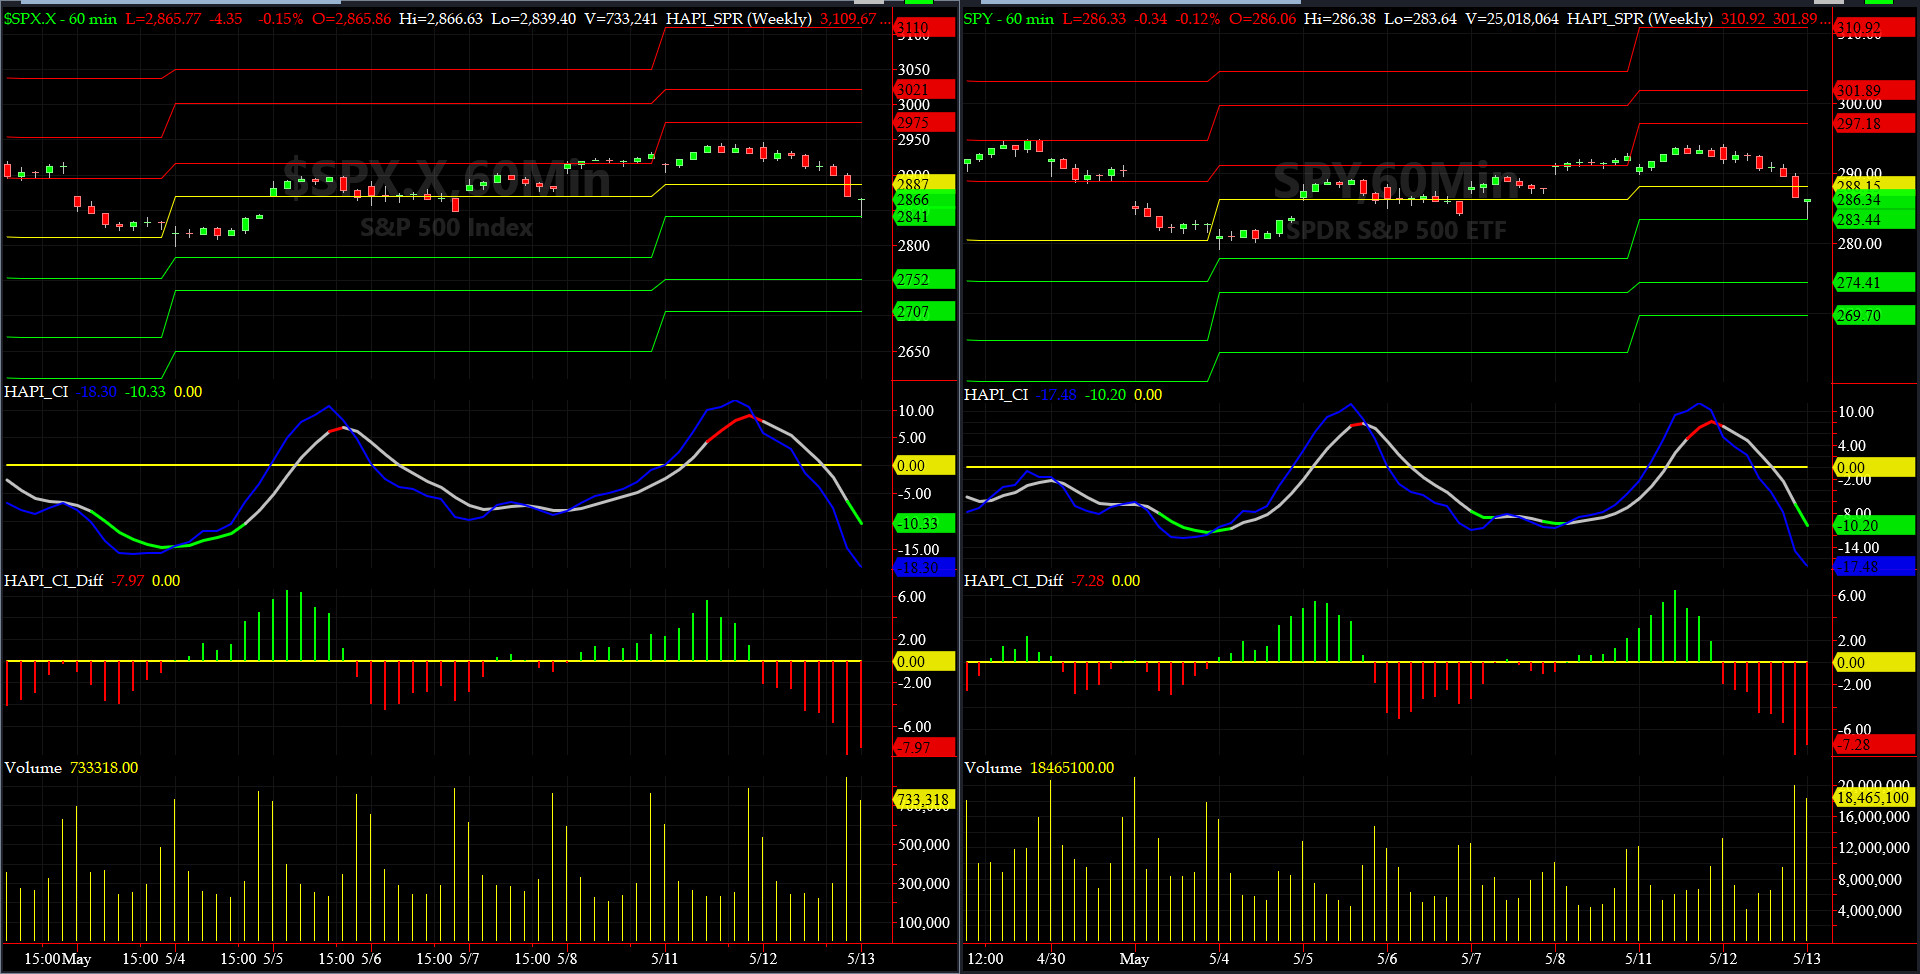
Most recent S&P-500 Cash Index (SPX) Close: 2870 up +40 (up +1.4%) for 6 days ending on Tuesday, May 12, 2020, which closed very near its zero sigma.
DJIA ALL TIME INTRADAY HIGH = 29568 reached on Wednesday, February 12, 2020
DJT ALL TIME INTRADAY HIGH = 11623 reached on Friday, September 14, 2018
SPX ALL TIME INTRADAY HIGH = 3258 reached on Wednesday, February 19, 2020
NDX ALL TIME INTRADAY HIGH = 8873 reached on Wednesday, February 19, 2020
RUT ALL TIME INTRADAY HIGH = 1742 reached on Friday, August 31, 2018
Current DAILY +2 Sigma SPX = 2957 with WEEKLY +2 Sigma = 3641
Current DAILY 0 Sigma SPX = 2852 with WEEKLY 0 Sigma = 3008
Current DAILY -2 Sigma SPX = 2748 with WEEKLY -2 Sigma = 2376
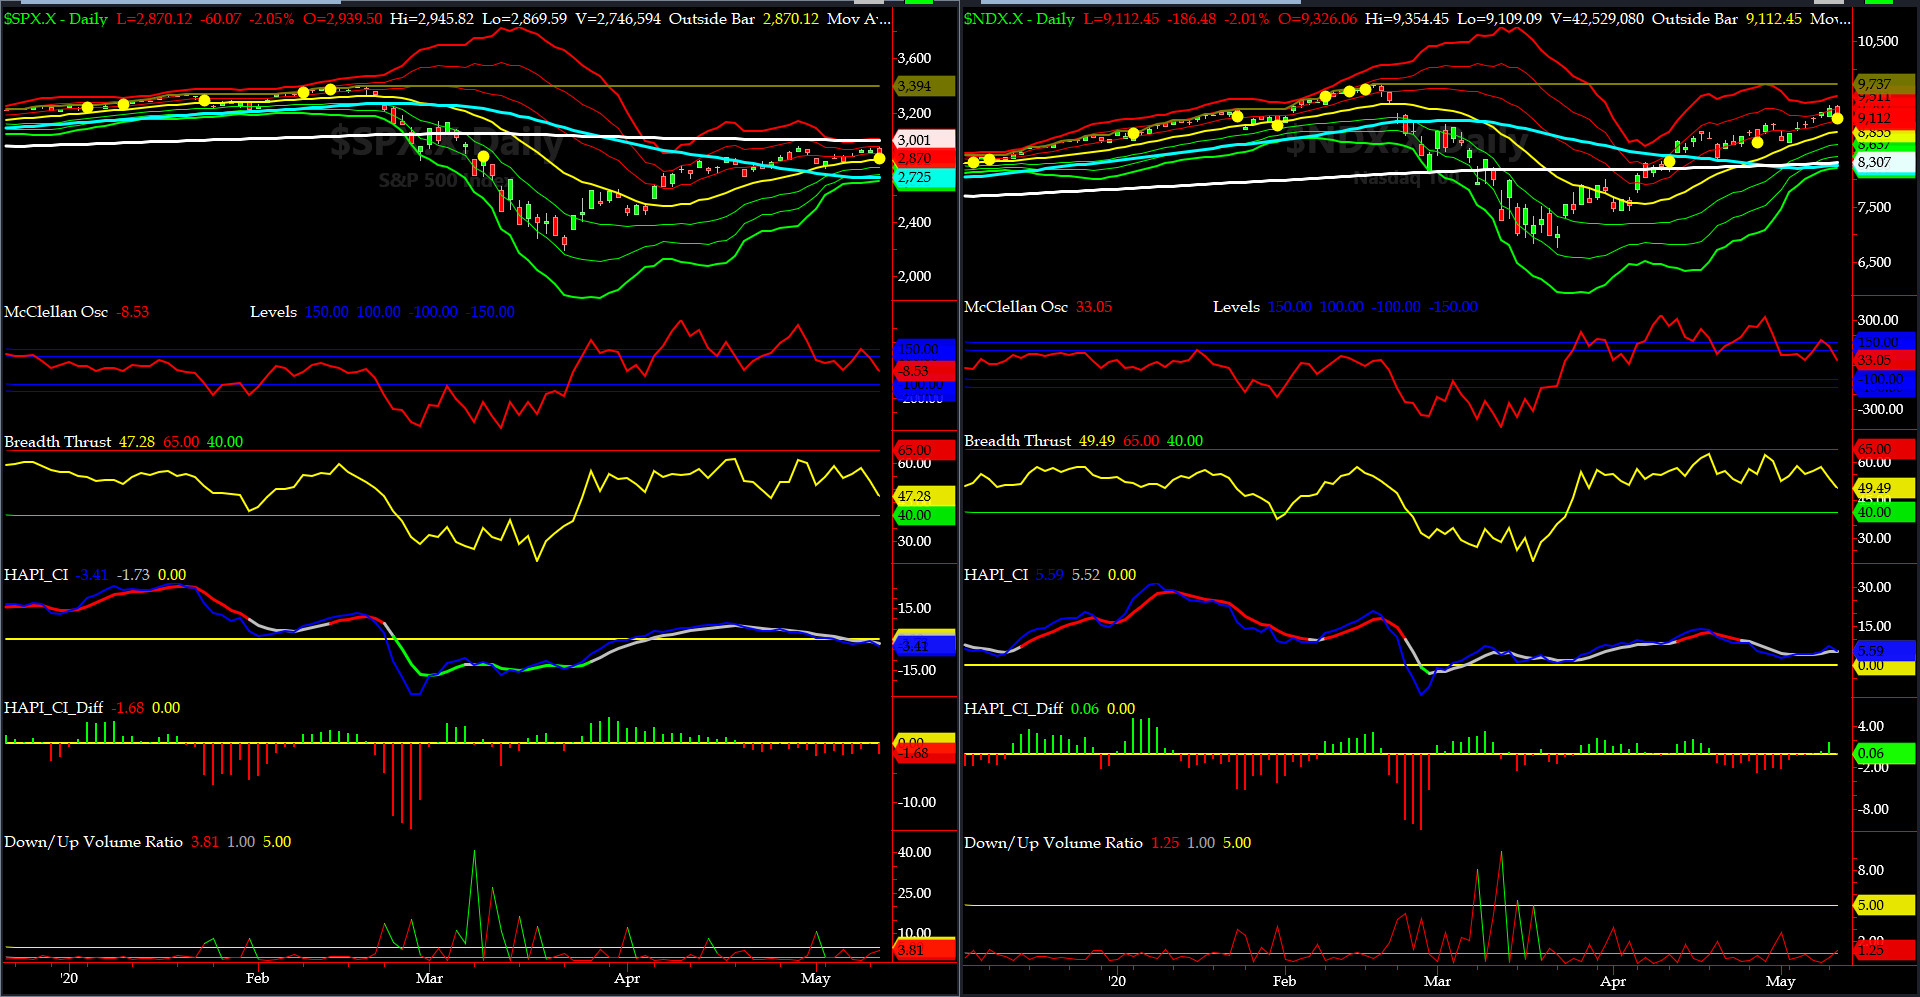
NYSE McClellan Oscillator = -9 (-150 is start of the O/S area; around -275 to -300 area or lower, we go into the �launch-pad� mode; over +150, we are in O/B area)
NYSE Breadth Thrust = 47.3 (40 is considered as oversold and 65 as overbought)
Looks to us that SPX is finally starting to rotate to the downside. Hearig some are expecting about 5% down move for SPX from here, which equates roughly to about 2725.
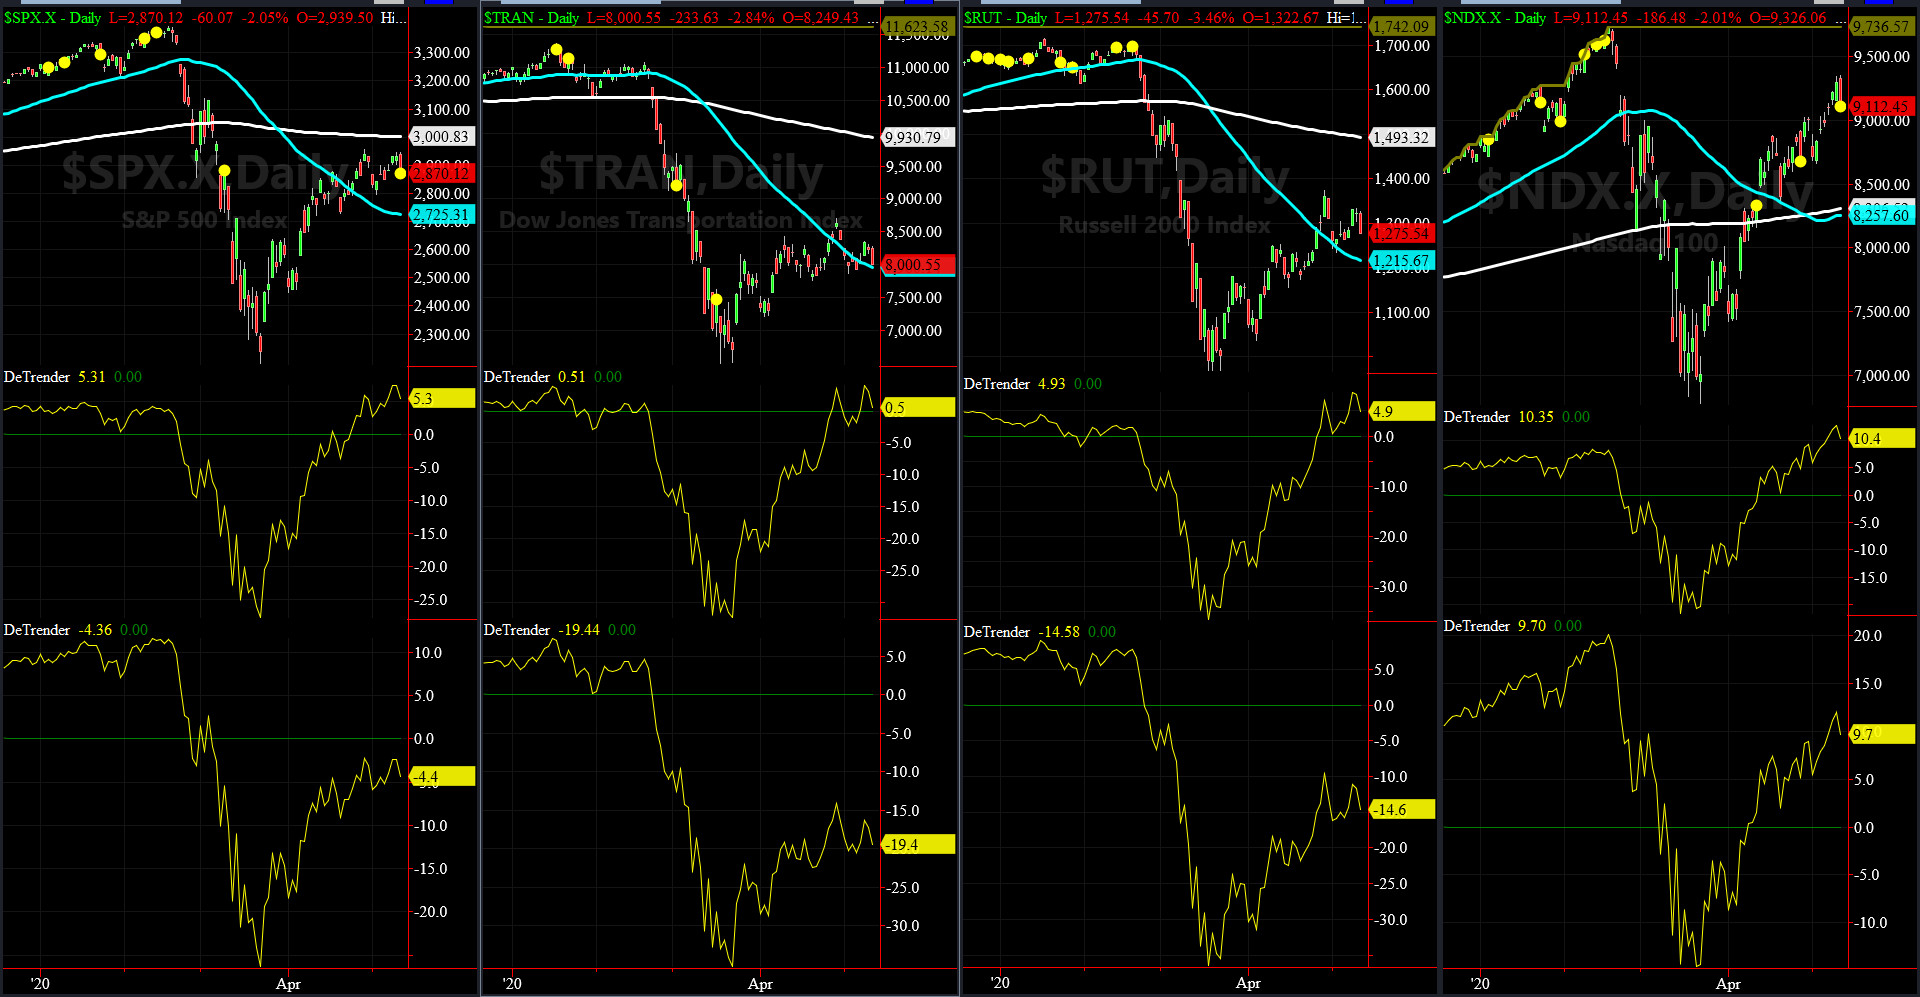
DeTrenders Charts for SPX, NDX, TRAN & RUT Indices
200-Day MA DJ TRAN = 9931 or 19.4% ABOVE the DJ TRAN (max observed in last 7 yrs = 20.2%, min = -20.3%)
200-Day MA RUT = 1493 or 14.6% ABOVE RUT (max observed in last 7 yrs = 21.3%, min = -22.6%)
50-Day MA SPX = 2725 or 5.6% ABOVE SPX (max observed in last 7 yrs = +8.6%, min = -9.3%)
200-Day MA SPX = 3001 or 4.4% BELOW SPX (max observed in last 7 yrs = 15.2%, min = -14%)
DJ Transportation Index (proxy for economic conditions 6 to 9 months hence) had a mixed week trading below & above its 50-day MA.
Russell 2000 Small Caps Index (proxy for Risk ON/OFF) also had a mixed week but stayed above its 50-day MA.
FIVE of our EIGHT DeTrenders are in the POSITIVE territory. The DeTrenders for DJ Tran & RUT will continue to be harbingers of future price behavior in broad indices.
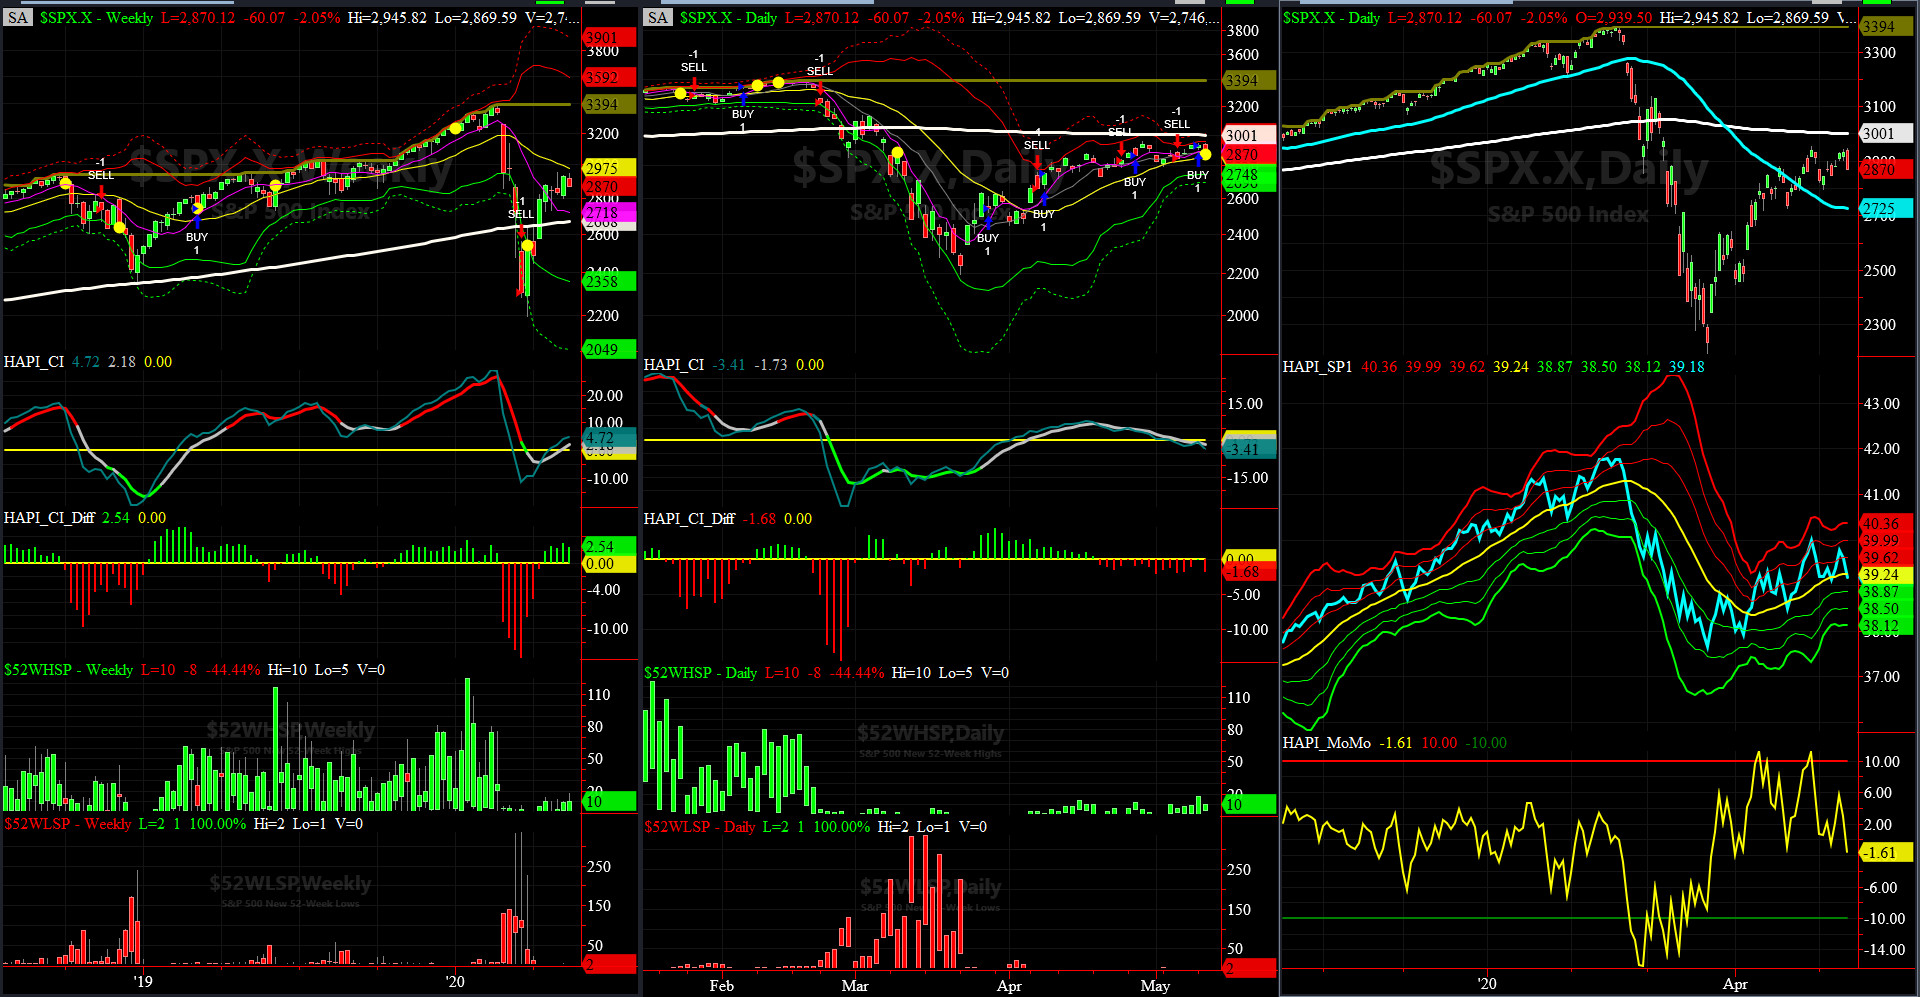
HA_SP1_Momo Chart
WEEKLY Timing Model = on a BUY Signal since Monday, May 11, 2020 CLOSE at 2930
DAILY Timing Model = on a BUY Signal since Tuesday, April 28, 2020 CLOSE at 2863
Max SPX 52wk-highs reading last week = 18 (over 120-140, the local maxima is in)
Max SPX 52wk-Lows reading last week = 3 (over 40-60, the local minima is in)
HA_SP1 again closed near its zero sigma channels
HA_Momo = -1.6 (reversals most likely occur above +10 or below -10)
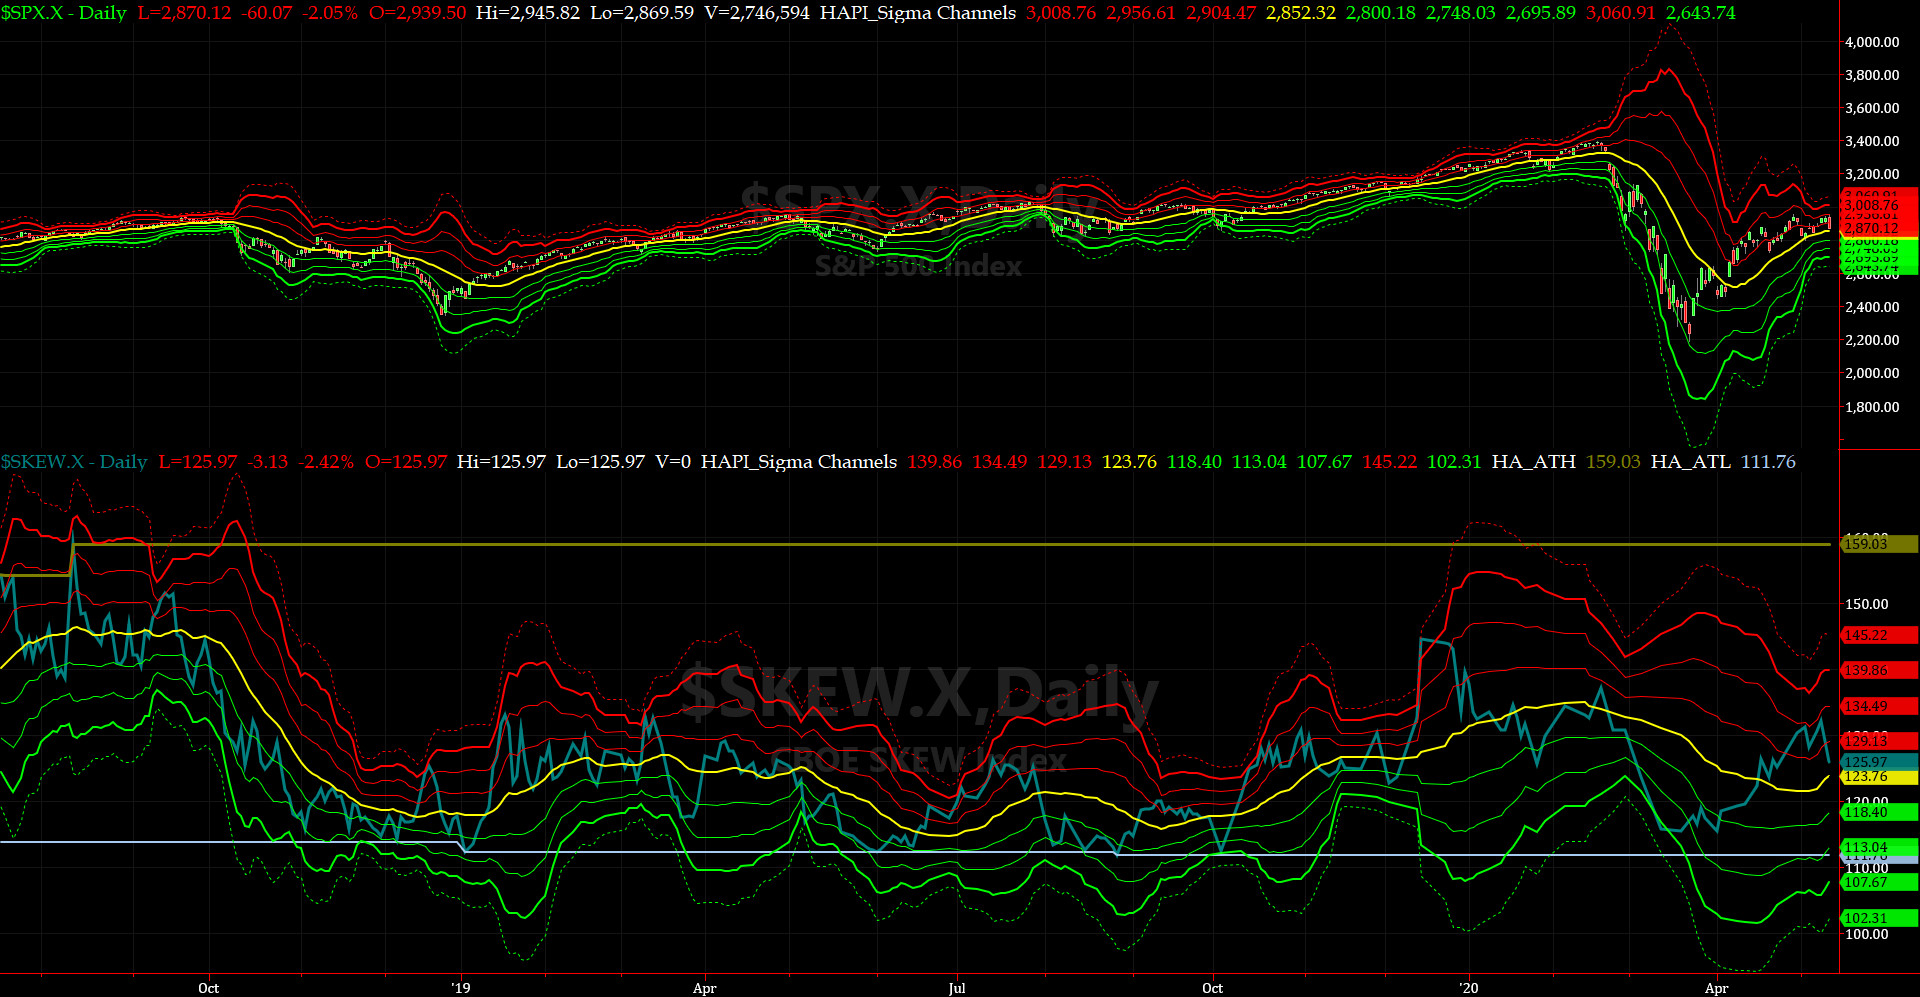
SPX SKEW (Downside Tail Risk) Chart
This week SPX SKEW (Downside Tail Risk) eased off on Thursday (SKEW is NOT computed every day any more) and closed at 126, now about its +0.5 sigma (normal = 115, range 100-150).
All quiet on the Eastern & Mid-Western Fronts? HRH Admiral Tiko, KCPE, says Oh NO, ALL IS NOT WELL..... he is not buying Jared's bravado!!
How to interpret the value of SPX SKEW? (from CBOE white paper on SKEW)

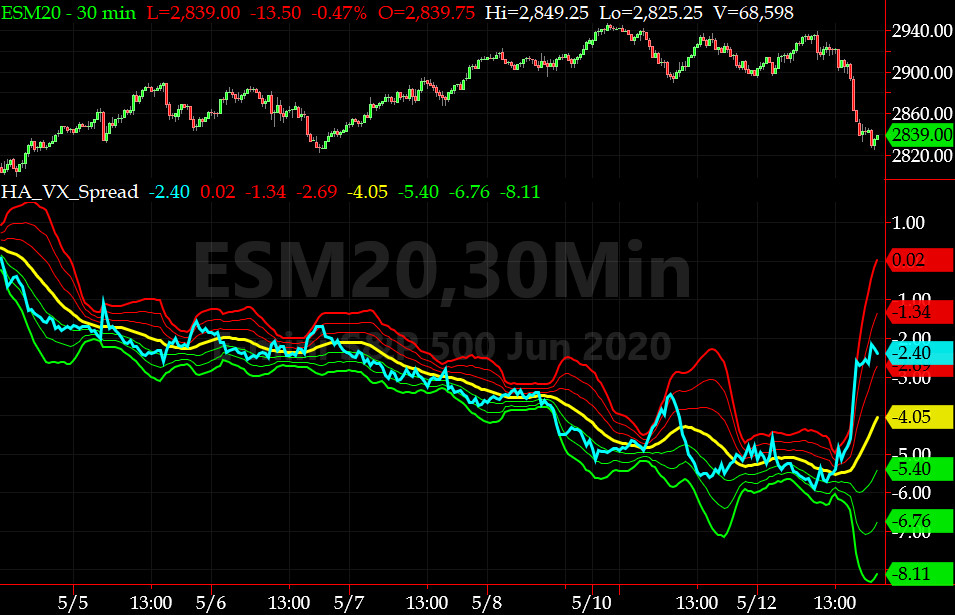
3-month VIX Futures Spread(VX) Chart
This shifted timing indicator for identifying tradable bottoms, (now long MAY20, & short AUG20 VIX Futures) hit -2.6 at the Close today. Once it hits zero, ceteris paribus, we are near the bottom.

HA_SP2 Chart
HA_SP2 = 27.55 (Buy signal <= 30, Sell Signal >= 70)
This updated indicator says we are at oversold right now, but most likely, heading further south.
Fari Hamzei
|


 Proactive Market Timing