Investment Advice via real time put call ratio real time investment advice
Contact Us Home Products News About Members
Proactive Market Timing
 
Proactive Market Timing Service

Market Timer: Fari Hamzei

Executive Officer: @Fleet_Adm_Tiko

Editors: Nancy Scott

Here is the most recent How the PMT Market Bias Service Works Video

Weekly PMT Webinars on YouTube   PMT Archives   Current PMT Issue

Most Recent PMT vs SPX Performance Chart

Wednesday, October 14, 2020, 1910ET
Link for Tonight's Market Timing Webinar #73

Click here to Play

Thanks for attending,
Fari Hamzei

Tuesday, October 13, 2020, 1225ET
LAUNCH COMMAND EMAIL (encrypted EAM sent from SSBN-731)
Options Trade for PMT Issue #338


SPX is trading at 3524 now
SPY is trading at 351.1 now

The midpoint of Bid/Ask prices for our Long CALL leg is trading approximately at 5.35 now
The midpoint of Bid/Ask prices for our Short CALL leg is trading approximately at 2.31 now

Therefore, the midpoint of Bid/Ask prices for our CALL Spread is trading approximately at 3.04 now

@Admiral_Tiko: EXECUTE….. EXECUTE…..

Tuesday, October 13, 2020, 1045ET
WEEKLY Support, Pivot & Resistance Levels Chart for Issue #338

Tuesday, October 13, 2020, 1040ET
Market Bias for Issue #338

Our current Market Bias with Timer Digest is LONG SPX since OCT 9 at 3477
Our previous Market Bias was SHORT SPX since SEPT 29 at 3335


            Here are the trade parameters for this week:

SPX Secondary Profit Target for last 20% of our position = 3610
SPX Primary Profit Target for first 80% of our position = 3570
SPX Money Management Stop for last 20% of our position = 3545
SPX Current Price is = 3520
SPX Money Management Stop for 100% of our position = 3420


Action Asset Expiration Strike Option Last Mid-Point
BUY SPY Friday OCT 30 352 Calls 5.35 5.34
SELL SHORT SPY Friday OCT 30 359 Calls 2.34 2.31
You need to execute both legs and hold it as a Call-Spread.

Note A: Once the Primary Profit Target has been reached, traders are advised to close 80% of their position in order to lock in profits. The remaining balance can be carried over with a BreakEven STOP, based on the SPX level at the time of entry, in order to make the trade a zero-risk trade with the final position running to reach the Secondary Profit Target. Once either Secondary Profit or Money Management (BreakEven STOP after the 80% peel-off) is hit, our Option/ETF trade for that week is over. Go to Cash and wait for the next PMT Issue.

Note B: When we change our Market Bias with Timer Digest, You need to go FLAT asap. With PMT Pro, that is before the Close that day and with the basic PMT, at the open of the next day. The following trading day, we will issue new SPX targets and a new SPY options trade, as long as our new market bias with Timer Digest is NOT flat.

Fari Hamzei

Tuesday, October 13, 2020, 0915ET
Market Timing Charts, Analysis & Commentary for Issue #338


Timer Charts of S&P-500 Cash Index (SPX) + NASDAQ-100 Cash Index (NDX)

Most recent S&P-500 Cash Index (SPX) Close: 3218 down -6 (down -0.2%) for the seven trading days ending on Tuesday, July 28, 2020, which closed very near its plus 0.5 sigma.

DJIA ALL TIME INTRADAY HIGH = 29568 reached on Wednesday, February 12, 2020
DJT ALL TIME INTRADAY HIGH = 11945 reached on Monday, October 12, 2020
SPX ALL TIME INTRADAY HIGH = 3588 reached on Wednesday, September 2, 2020
NDX ALL TIME INTRADAY HIGH = 8873 reached on Wednesday, September 2, 2020
RUT ALL TIME INTRADAY HIGH = 1742 reached on Friday, August 31, 2018

Current DAILY +2 Sigma SPX = 3507 with WEEKLY +2 Sigma = 3578
Current DAILY 0 Sigma SPX = 3363 with WEEKLY 0 Sigma = 3287
Current DAILY -2 Sigma SPX = 3220 with WEEKLY -2 Sigma = 2996

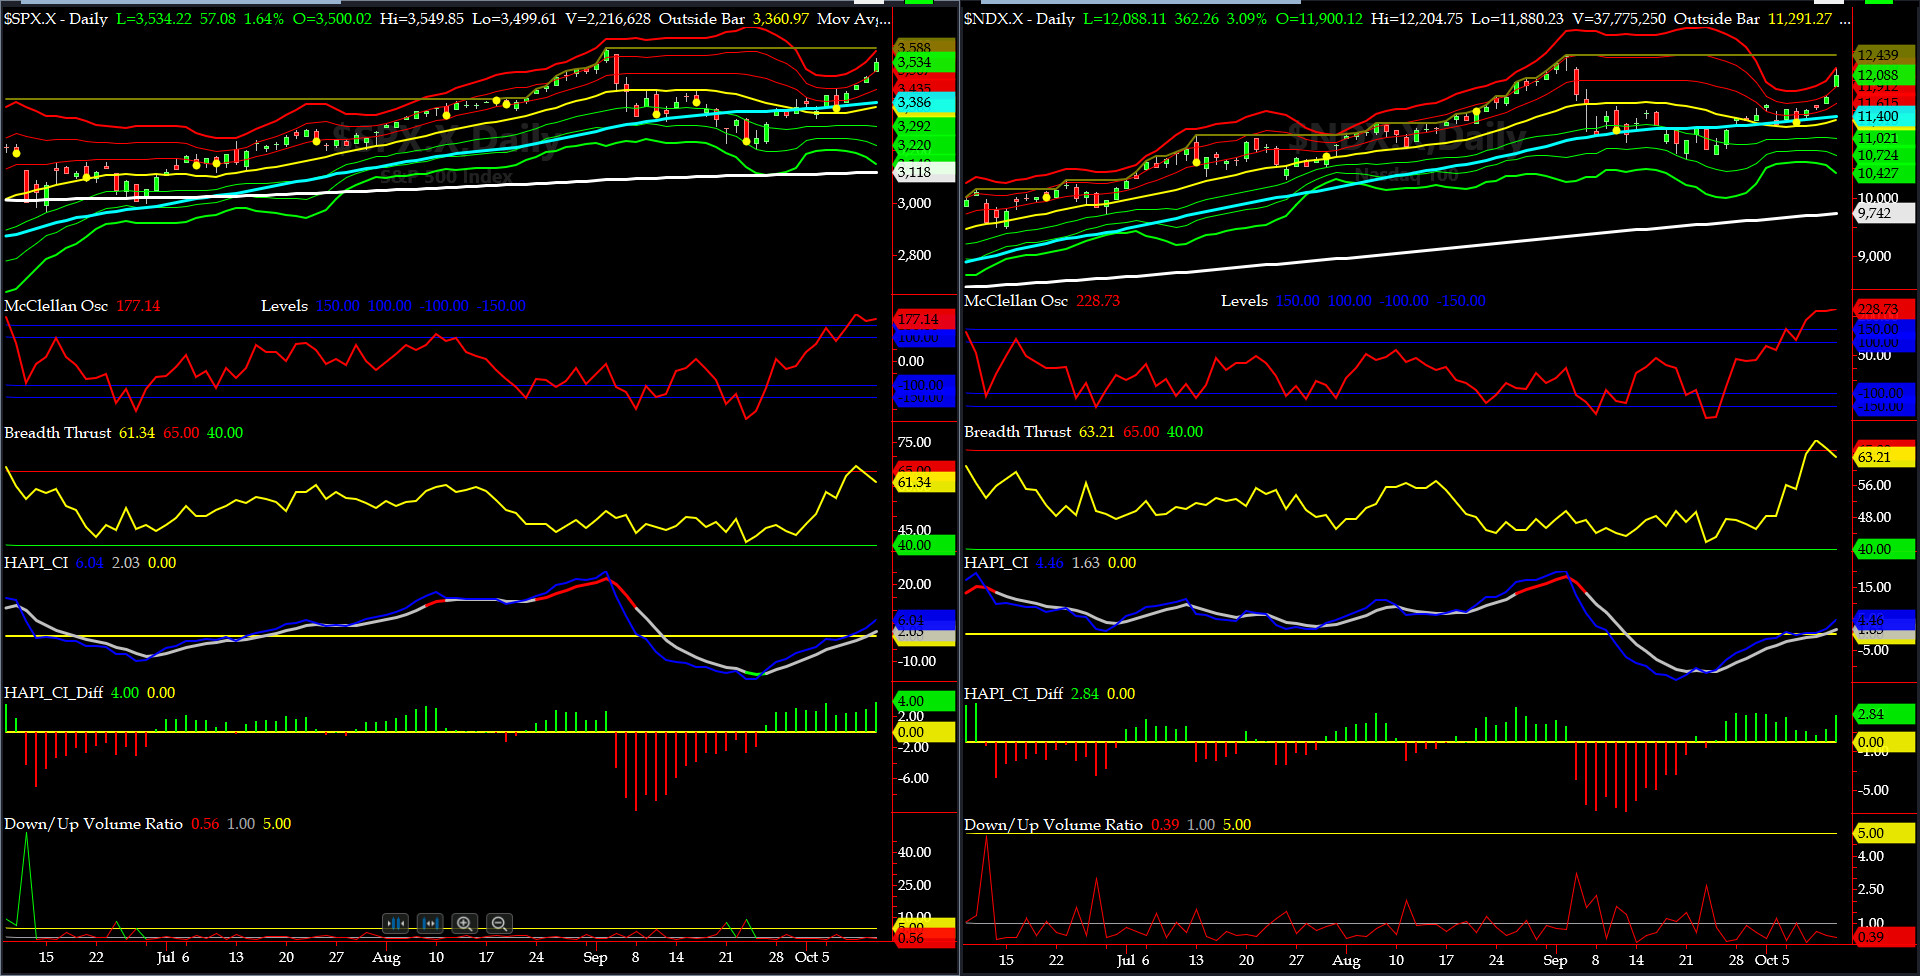
NYSE McClellan Oscillator = +177 (-150 is start of the O/S area; around -275 to -300 area or lower, we go into the “launch-pad” mode; over +150, we are in O/B area)
NYSE Breadth Thrust = 61.3(40 is considered as oversold and 65 as overbought)


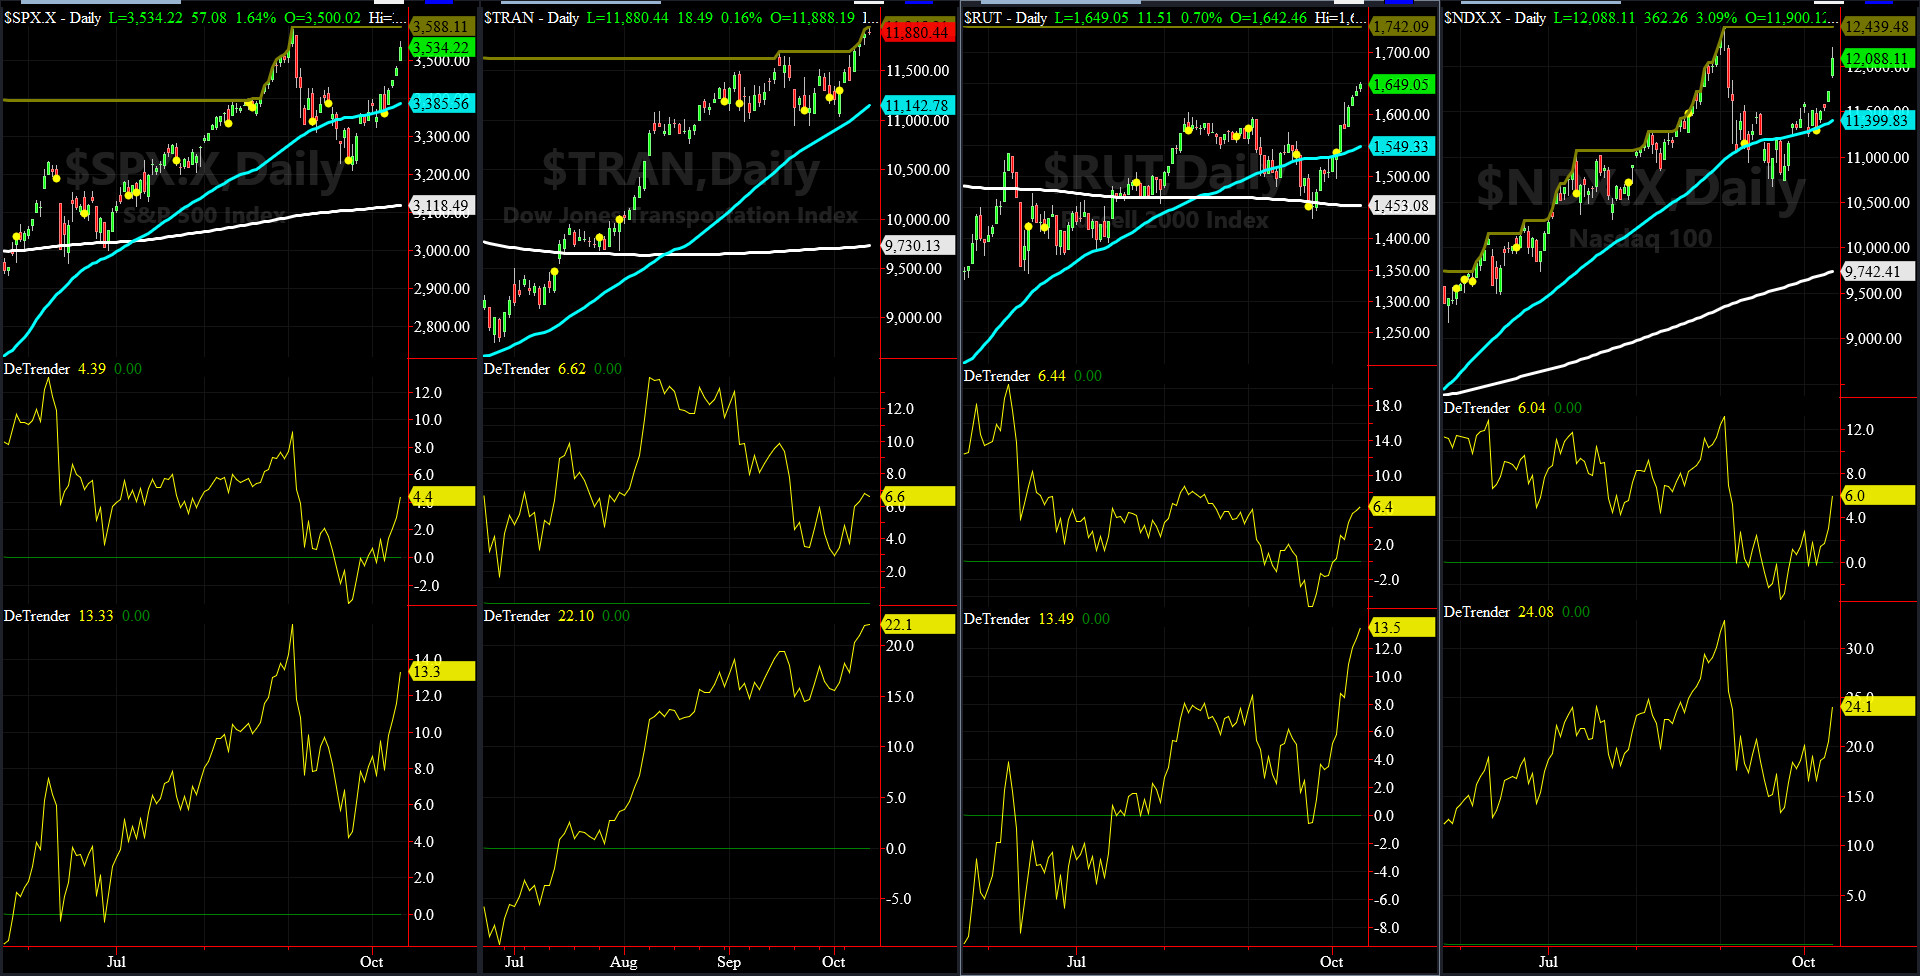
DeTrenders Charts for SPX, NDX, TRAN & RUT Indices

200-Day MA DJ TRAN = 9730 or 22.1% BELOW the DJ TRAN (max observed in last 7 yrs = 20.2%, min = -20.3%)
200-Day MA RUT = 1453 or 13.5% BELOW RUT (max observed in last 7 yrs = 21.3%, min = -22.6%)

50-Day MA SPX = 3385 or 4.4% BELOW SPX (max observed in last 7 yrs = +8.6%, min = -9.3%)
200-Day MA SPX = 3118 or 13.3% BELOW SPX (max observed in last 7 yrs = 15.2%, min = -14%)

DJ Transportation Index (proxy for economic conditions 6 to 9 months hence) had an excellent week making sequential ATHs.

Russell 2000 Small Caps Index (proxy for Risk ON/OFF) also put in a great week following DJ TRAN pattern.

Again, ALL of our EIGHT DeTrenders are in the POSITIVE territory. The DeTrenders for DJ Tran & RUT will continue to be harbingers of future price behavior in broad indices.
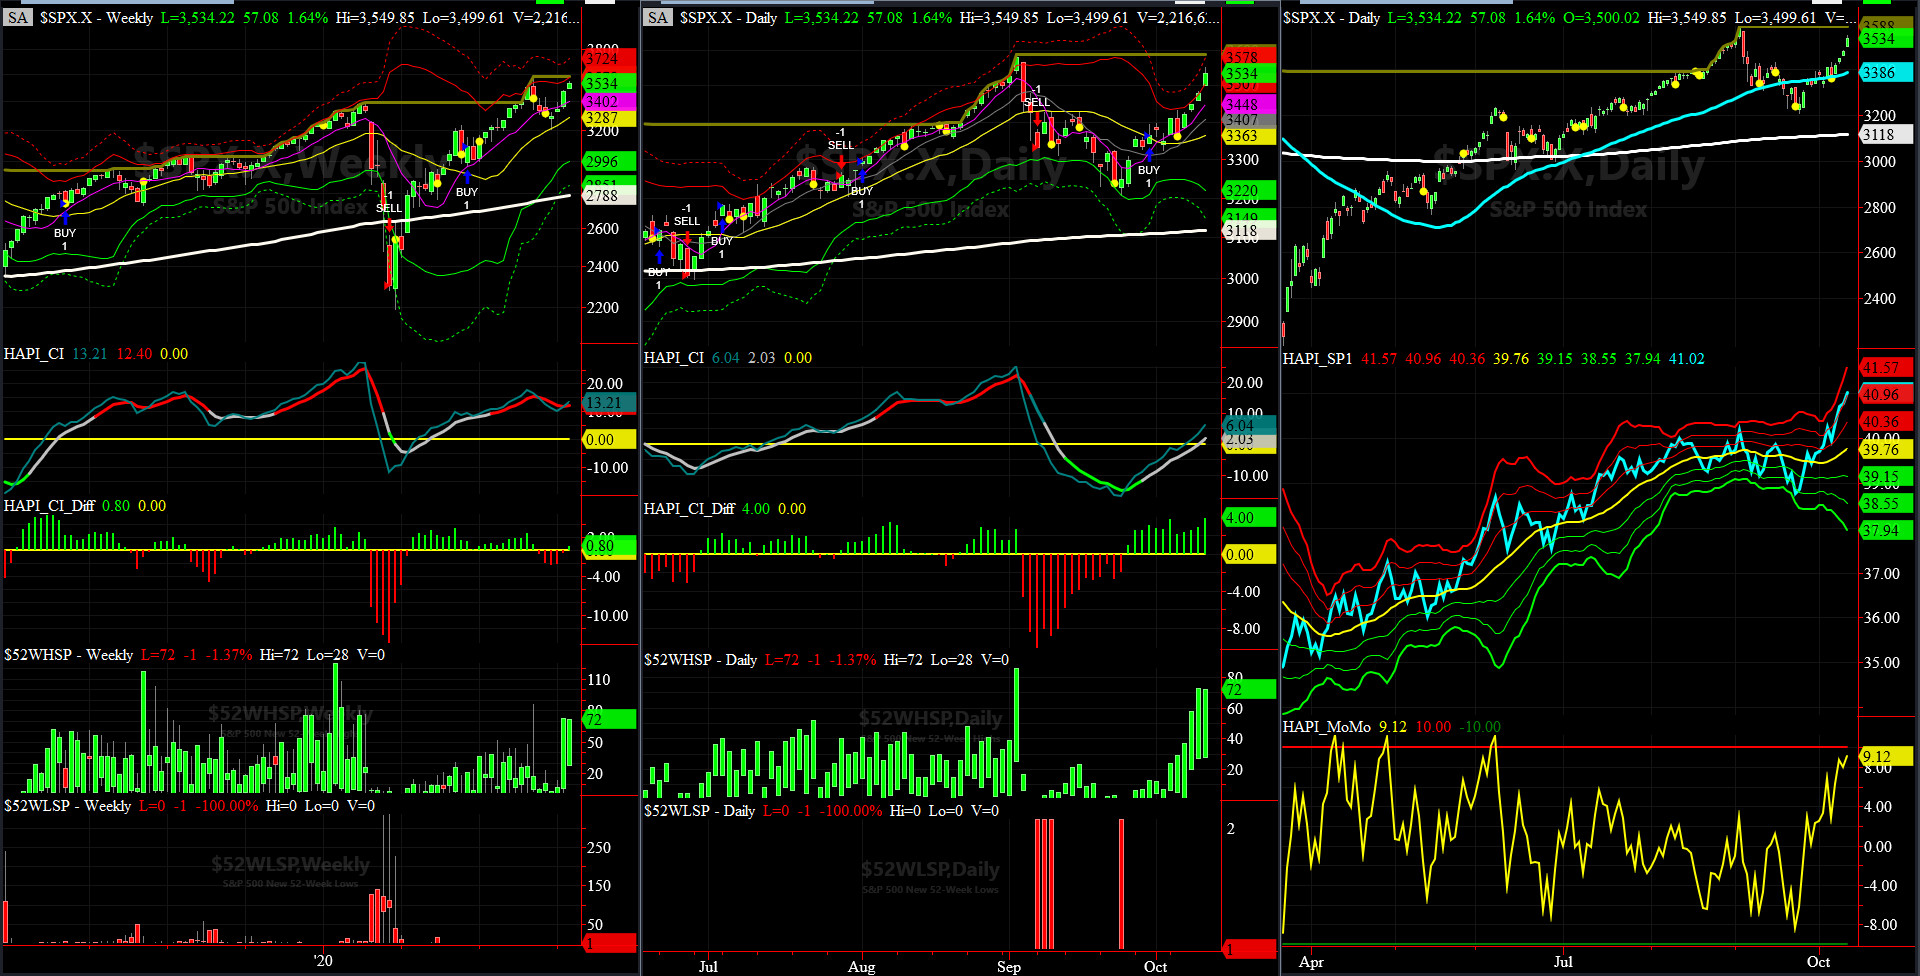
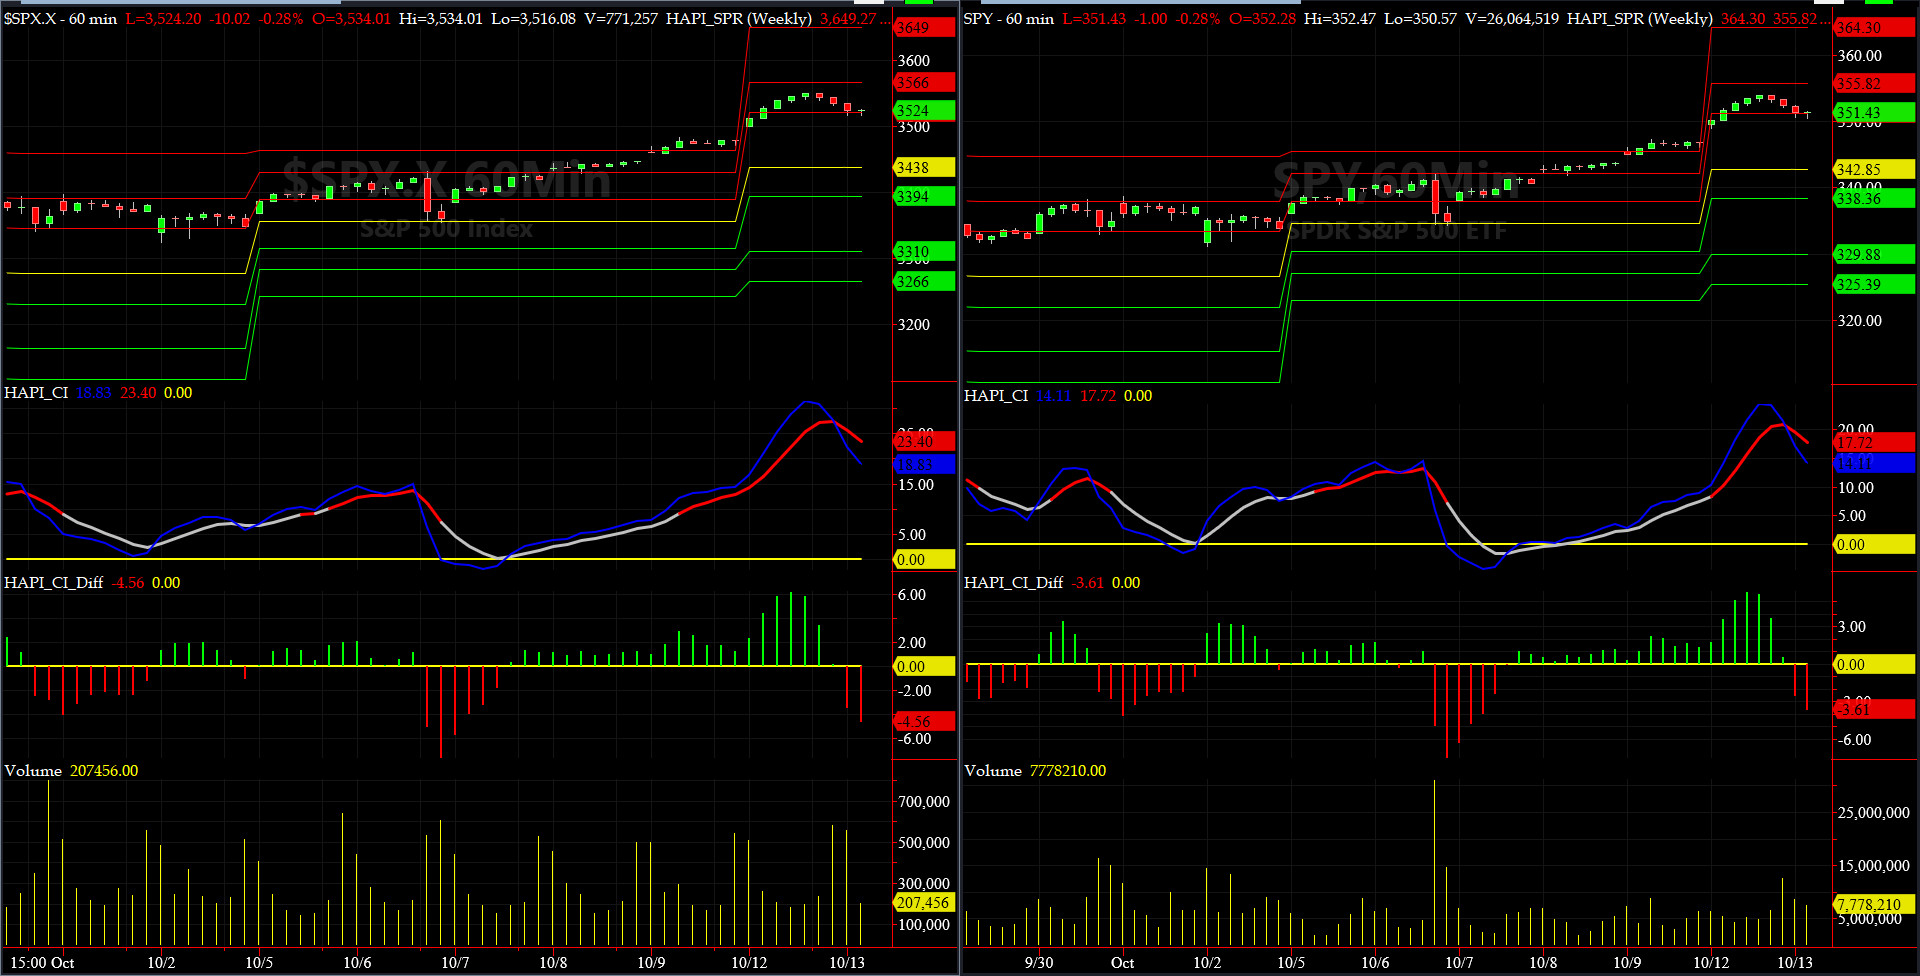


HA_SP1_Momo Chart

WEEKLY Timing Model = on a BUY Signal since Friday, June 19, 2020 CLOSE at 3097
DAILY Timing Model = on a BUY Signal since Wednesday, Sept 30, 2020 CLOSE at 3363
Max SPX 52wk-highs reading last week = 70 (over 120-140, the local maxima is in)
Max SPX 52wk-Lows reading last week = 1 (over 40-60, the local minima is in)
HA_SP1 again closed near its plus 2 sigma channels
HA_Momo = +9.1 (reversals most likely occur above +10 or below -10)


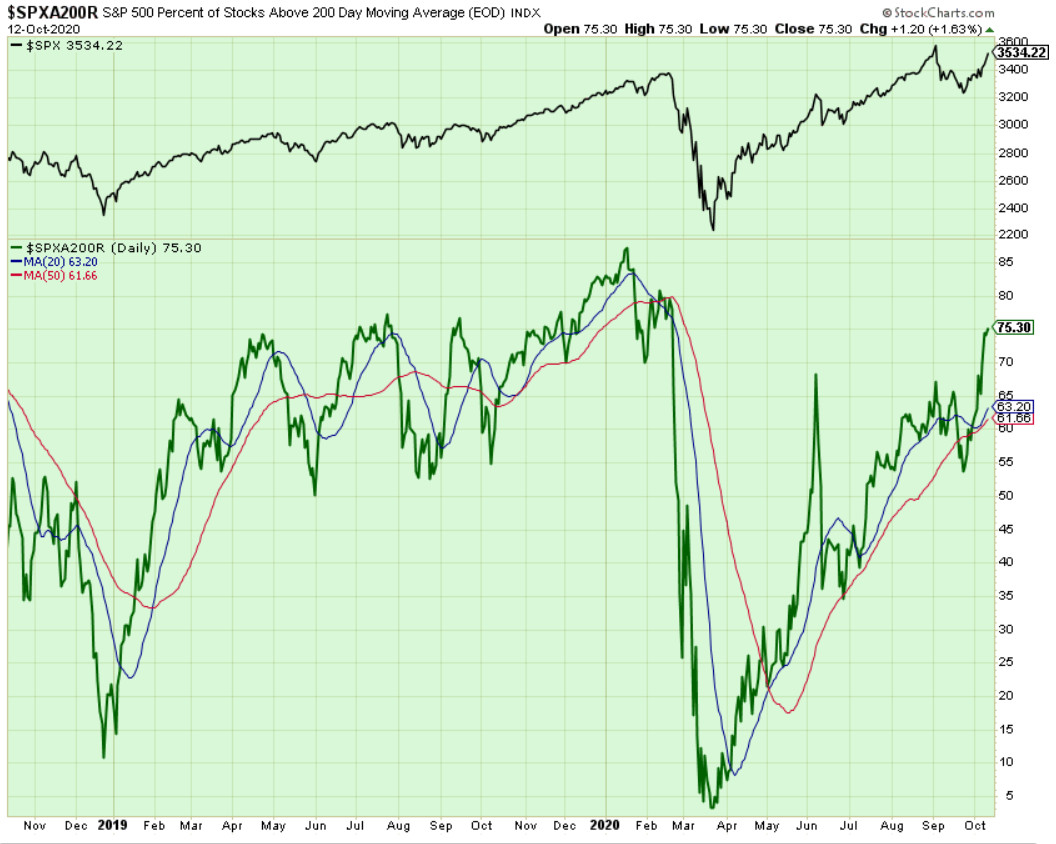
Components of SPX above their respective 200-day MA Chart

This scoring indicator rallied up to 75% and still pointing up. Once it gets past 80%, we have to get vigilant as we are entering heavy overbought area.


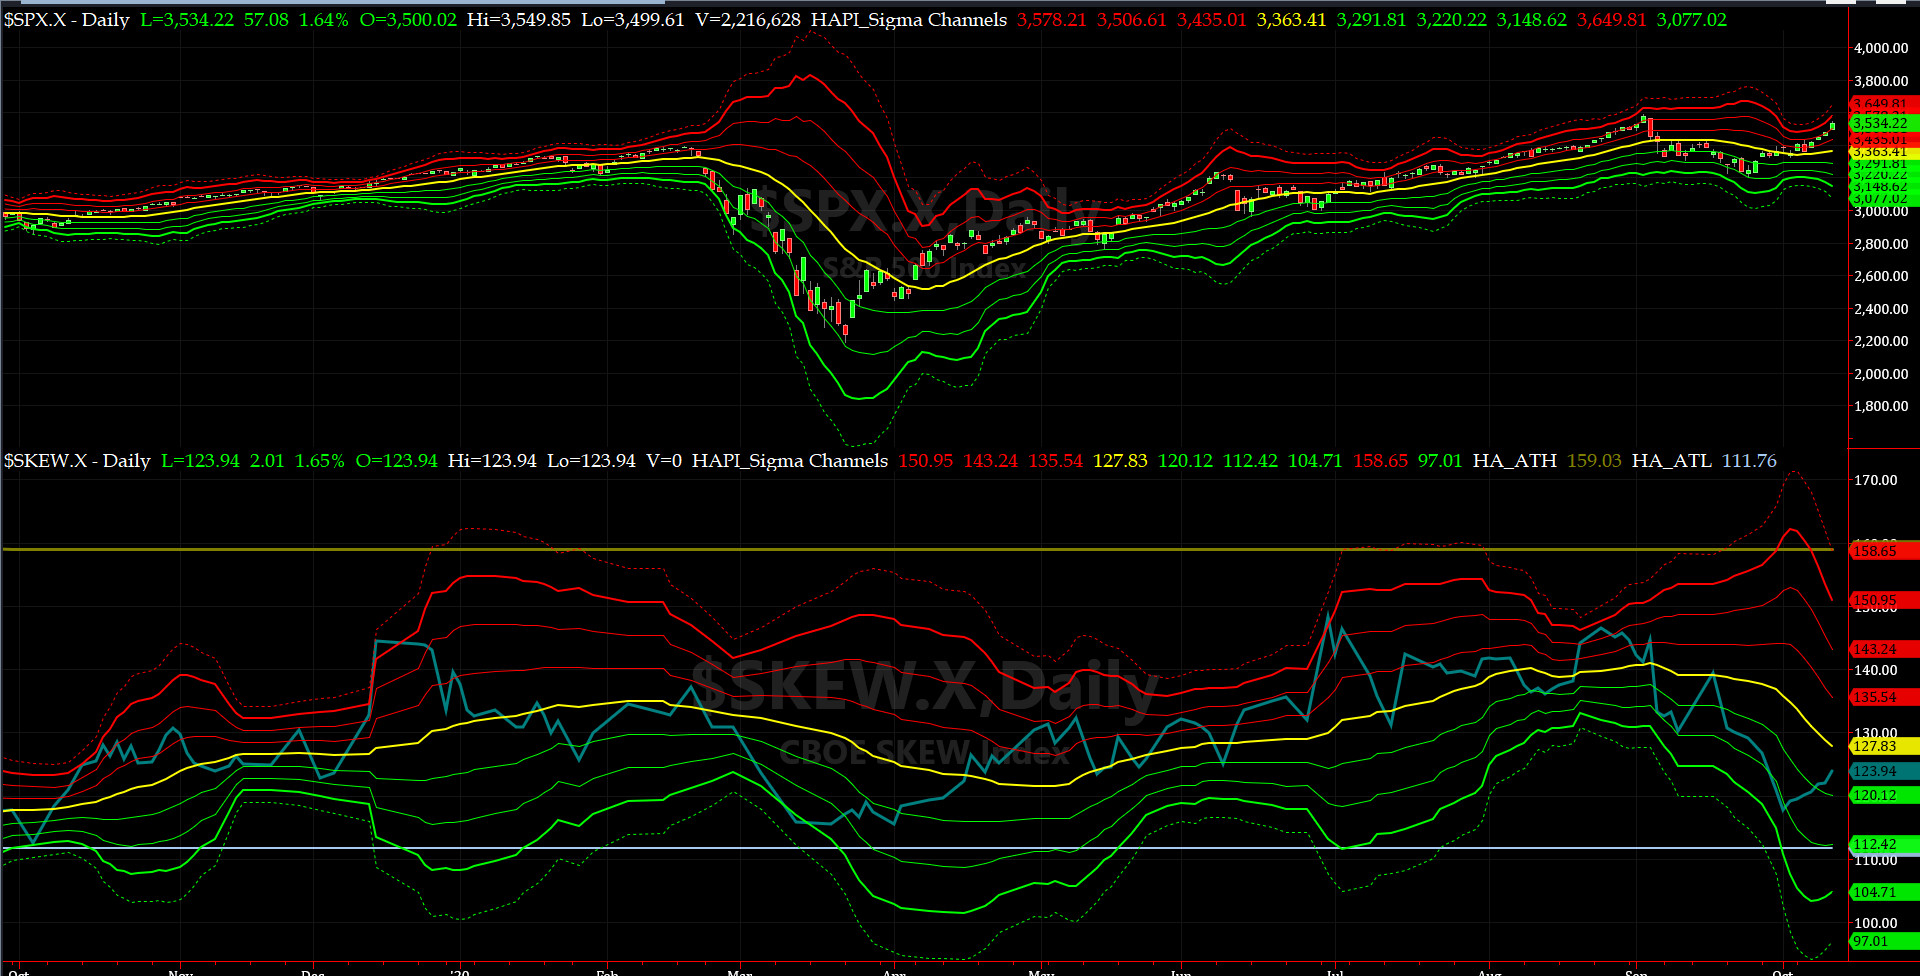
SPX SKEW (Downside Tail Risk) Chart

This week SPX SKEW (Downside Tail Risk) eased off on Thursday (SKEW is NOT computed every day any more) and closed at ~124, now about its plus 1/2 sigma (normal = 115, range 100-150).

All quiet on the Eastern & Mid-Western Fronts? HRH Admiral Tiko, KCPE, says Maybe....


How to interpret the value of SPX SKEW? (from CBOE white paper on SKEW)


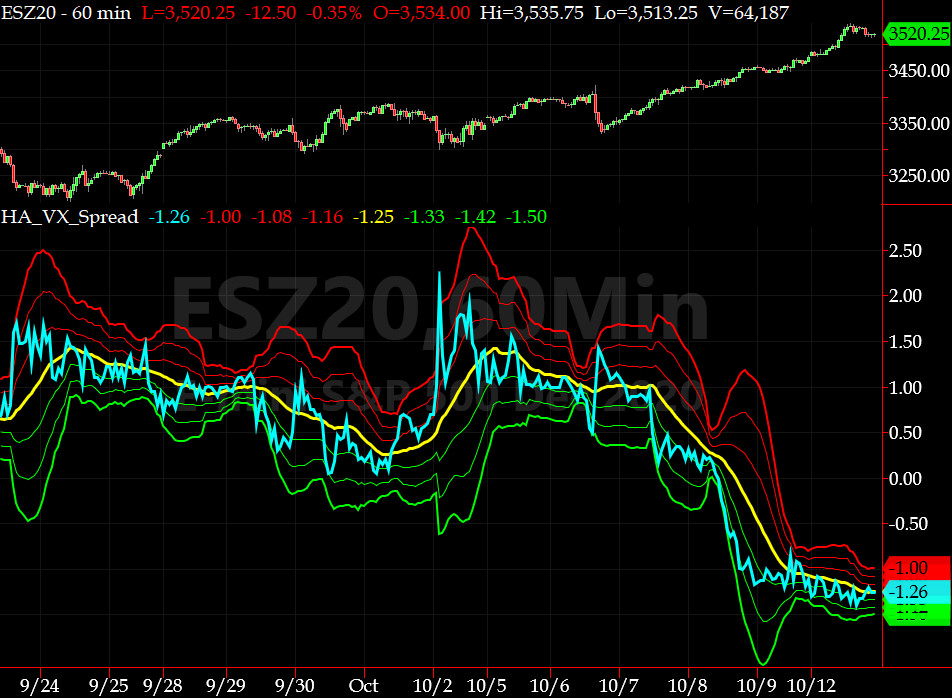
3-month VIX Futures Spread(VX) Chart

This shifted timing indicator for identifying tradable bottoms, (now long AUG20, & short NOV20 VIX Futures) hit -1.26 at the Close on Monday. This is another near overbought reading.
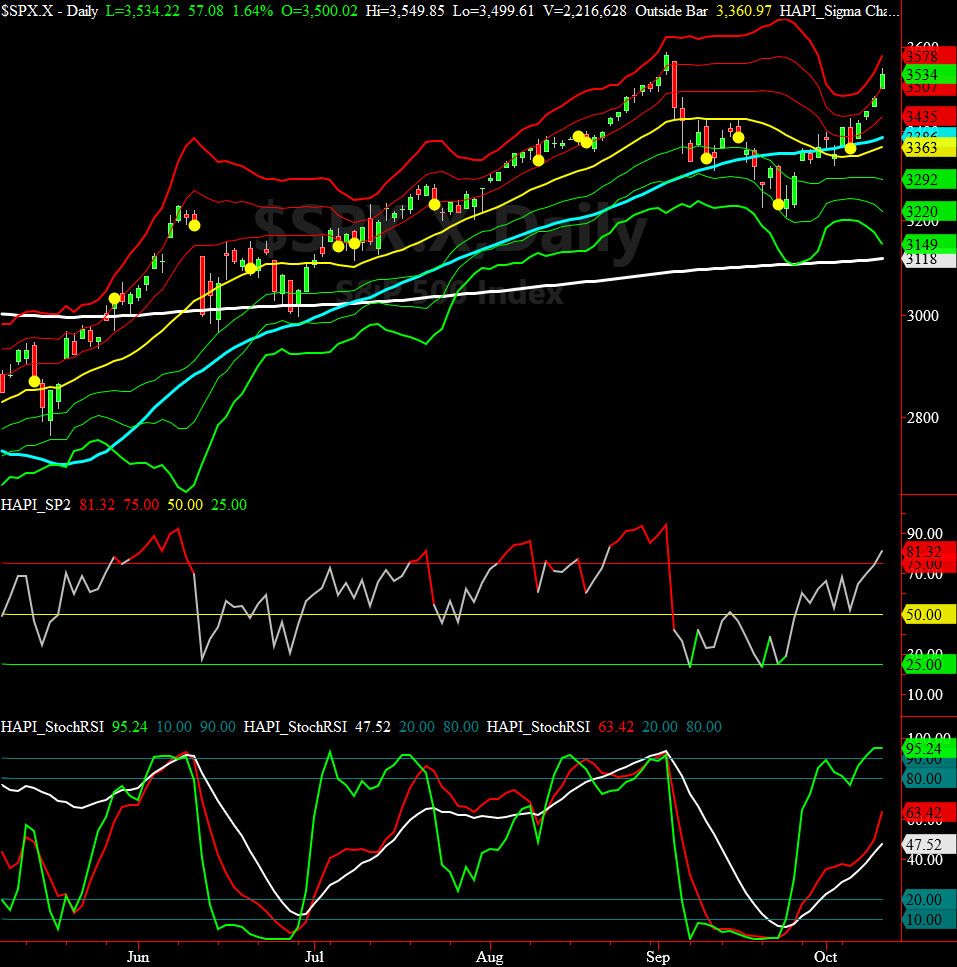


HA_SP2 Chart

HA_SP2 = 81.3 (Buy signal <= 30, Sell Signal >= 70)

This fantastic timing indicator says we are slightly overbought here.

Fari Hamzei

Monday, October 12, 2020, 0135ET
Notice of Change of Market Bias with Timer Digest


Dear Jim,

After further review, the old saying proves right once again: If you can’t beat them, [better] join them.

Not sure what this chaotic market of ours is pricing in now, but let’s shoot first and court martial later (I hate taking prisoners).

Getting LONG SPX from 3477….

Cheers......

Fari Hamzei


Customer Care:


Chat with Fari on TradeStation.com Fari Hamzei writes for CBOE Options Hub on event-deriven basis       Futures & Options for Stock Indices
HA YouTube Channel  :::  HA Blog  :::  Testimonials  :::  Tutorials & FAQs  :::  Privacy Policy
(c) 1998-2024, Hamzei Analytics, LLC.   All Rights Reserved.