|
Tuesday, June 29, 2021, 1700ET
Market Timing Charts, Analysis & Commentary for Issue #348

Timer Charts of S&P-500 Cash Index (SPX) + NASDAQ-100 Cash Index (NDX)
Most recent S&P-500 Cash Index (SPX) Close: 4292 up +46 (up +1.1%) for the five trading days ending on Tuesday, June 29, 2021, which closed very near its plus 2 sigma.
DJIA ALL TIME INTRADAY HIGH = 35091 reached on Monday, May 10, 2021
DJT ALL TIME INTRADAY HIGH = 11623 reached on Monday, May 10, 2021
SPX ALL TIME INTRADAY HIGH = 4300 reached on Tuesday, June 29, 2021
NDX ALL TIME INTRADAY HIGH = 14,572 reached on Tuesday, June 29, 2021
RUT ALL TIME INTRADAY HIGH = 2360 reached on Monday, March 15, 2021
Current DAILY +2 Sigma SPX = 4297 with WEEKLY +2 Sigma = 4399
Current DAILY 0 Sigma SPX = 4237 with WEEKLY 0 Sigma = 4103
Current DAILY -2 Sigma SPX = 4177 with WEEKLY -2 Sigma = 3807
NYSE McClellan Oscillator = -70 (-150 is start of the O/S area; around -275 to -300 area or lower, we go into the �launch-pad� mode; over +150, we are in O/B area)
NYSE Breadth Thrust = 47.9 (40 is considered as oversold and 65 as overbought)
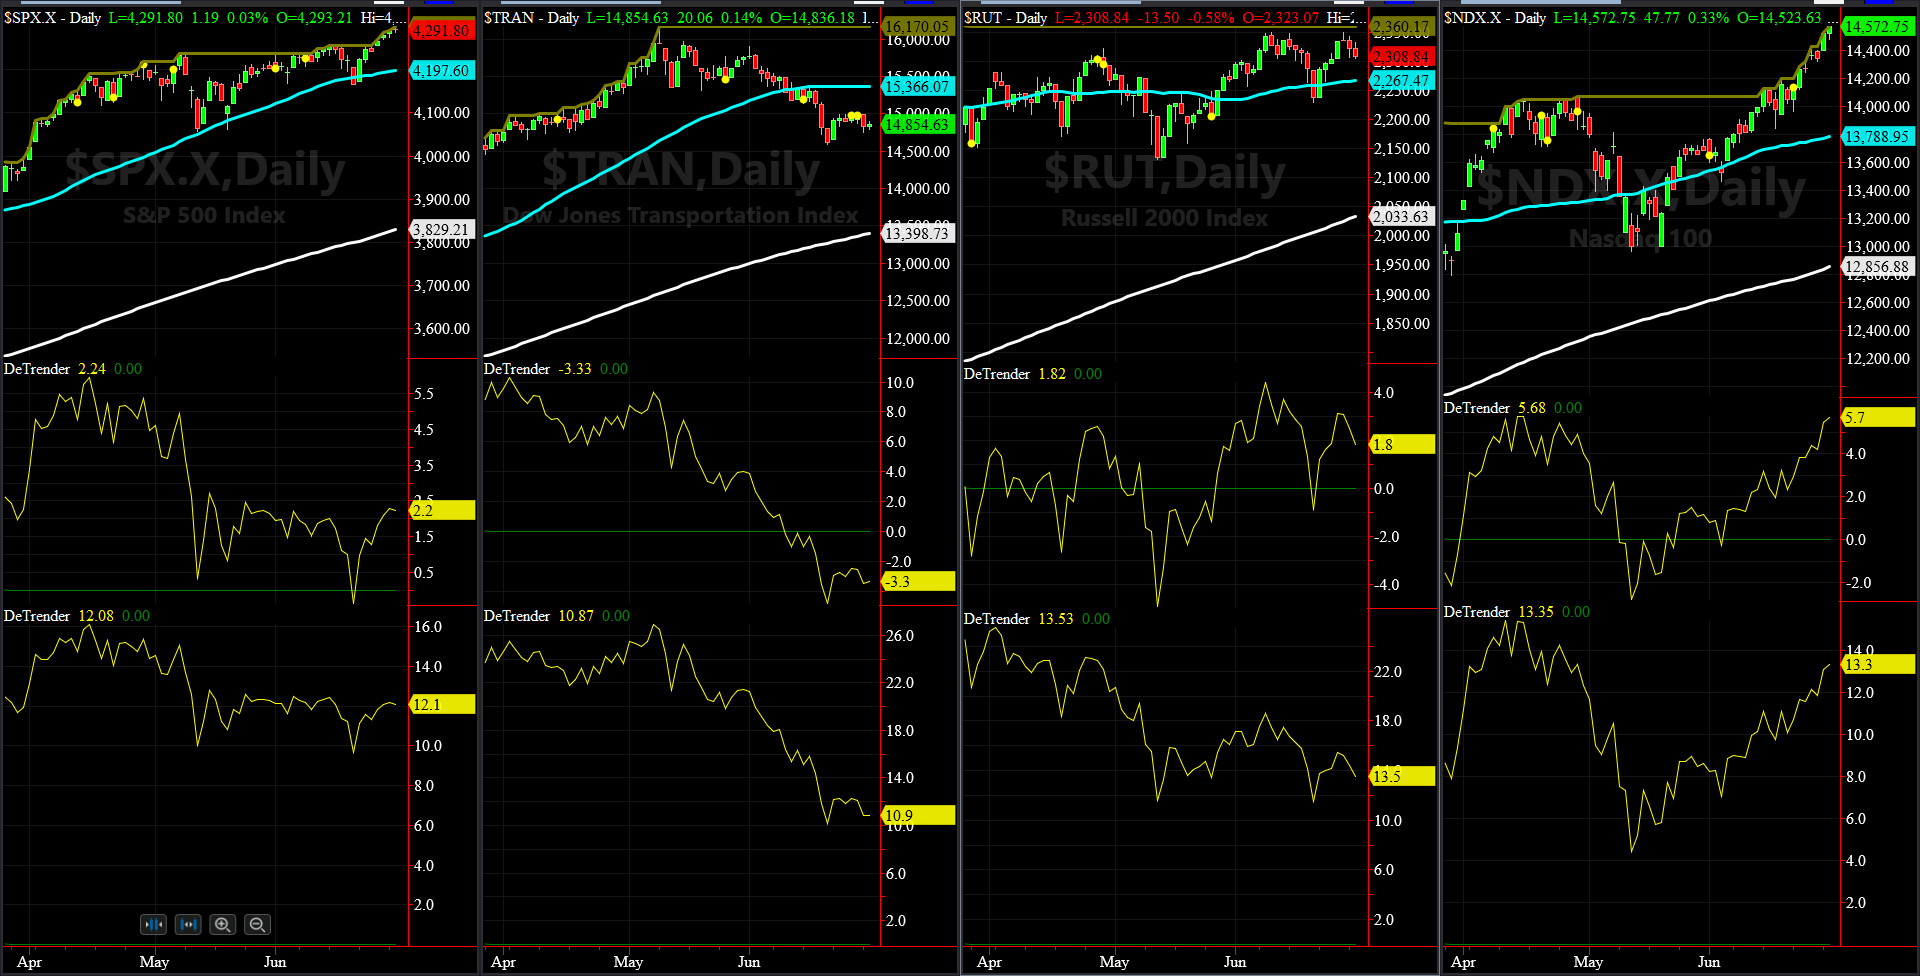
DeTrenders Charts for SPX, NDX, TRAN & RUT Indices
200-Day MA DJ TRAN = 13,398 or 10.8% BELOW the DJ TRAN (max observed in last 7 yrs = 20.2%, min = -20.3%)
200-Day MA RUT = 2033 or 13.7% BELOW RUT (max observed in last 7 yrs = 21.3%, min = -22.6%)
50-Day MA SPX = 4197 or 2.2% BELOW SPX (max observed in last 7 yrs = +8.6%, min = -9.3%)
200-Day MA SPX = 3829 or 12.1% BELOW SPX (max observed in last 7 yrs = 15.2%, min = -14%)
DJ Transportation Index (proxy for economic conditions 6 to 9 months hence) had an horrible five weeks.
Russell 2000 Small Caps Index (proxy for Risk ON/OFF) has been trading a tight range since its last ATH in March.
ALL of our EIGHT DeTrenders are in the POSITIVE territory. The DeTrenders for DJ Tran & RUT will continue to be harbingers of future price behavior in broad indices.

HA_SP1_Momo Chart
WEEKLY Timing Model = on a BUY Signal since Monday, June 19, 2020 CLOSE at 3098
DAILY Timing Model = on a BUY Signal since Friday, June 25, 2021 CLOSE at 4280
Max SPX 52wk-highs reading last week = 37 (over 120-140, the local maxima is in)
Max SPX 52wk-Lows reading last week = 1 (over 40-60, the local minima is in)
HA_SP1 again closed near its plus 0.5 sigma channels
HA_Momo = -1 (reversals most likely occur above +10 or below -10)

Vol of the Vols Chart
VIX currently stands at 16.2, just about its -1 sigma (remember it's the VIX volatility pattern aka "its sigma channels" that matters, and not the level of VIX itself (this is per Dr. Robert Whaley, a great mentor and inventor of original VIX, now called VXO). VIX usually peaks around a test of its +4 sigma).
VIX attempted to spike down twice during last 5 trading days only to give up most of its down moves. We consider these Vols still too high with stock indices and FANGAM names at their respective ATHs.
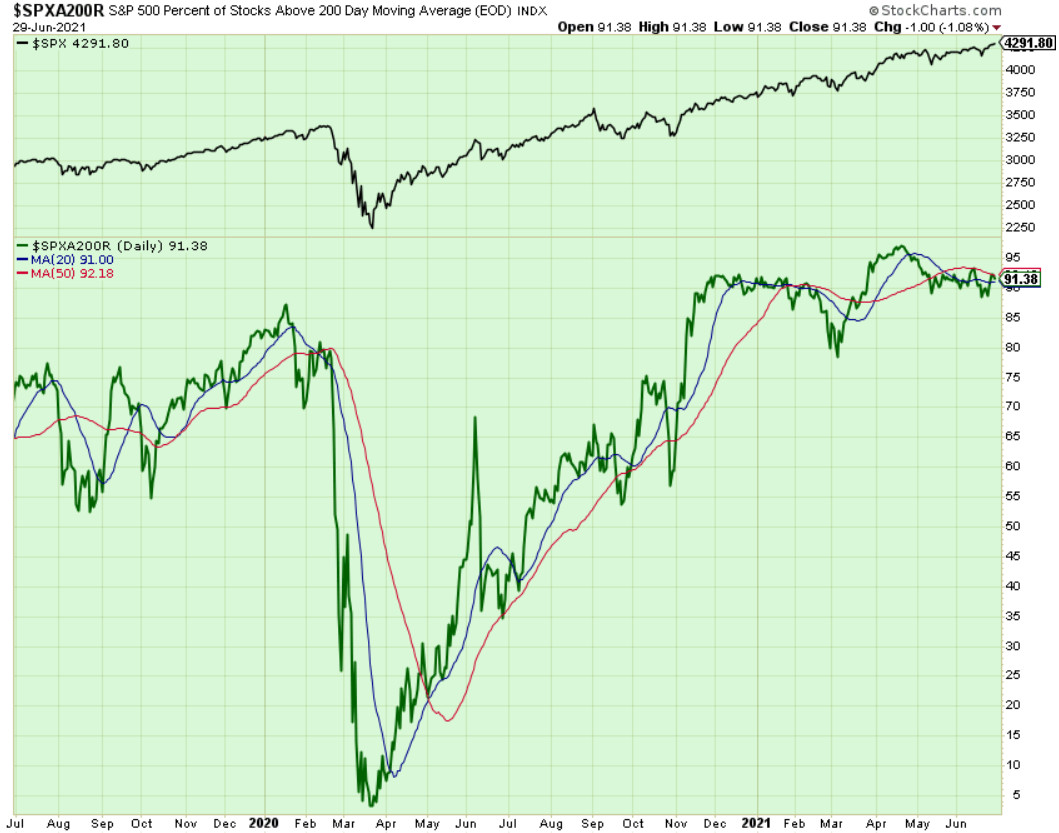
Components of SPX above their respective 200-day MA Chart
This scoring indicator has dropped from 98-ish area down to 91.4% with a huge divergence with price. As you may recall, for most of the second half of the last decade, this is was a common occurrence and yet we still ended going up.
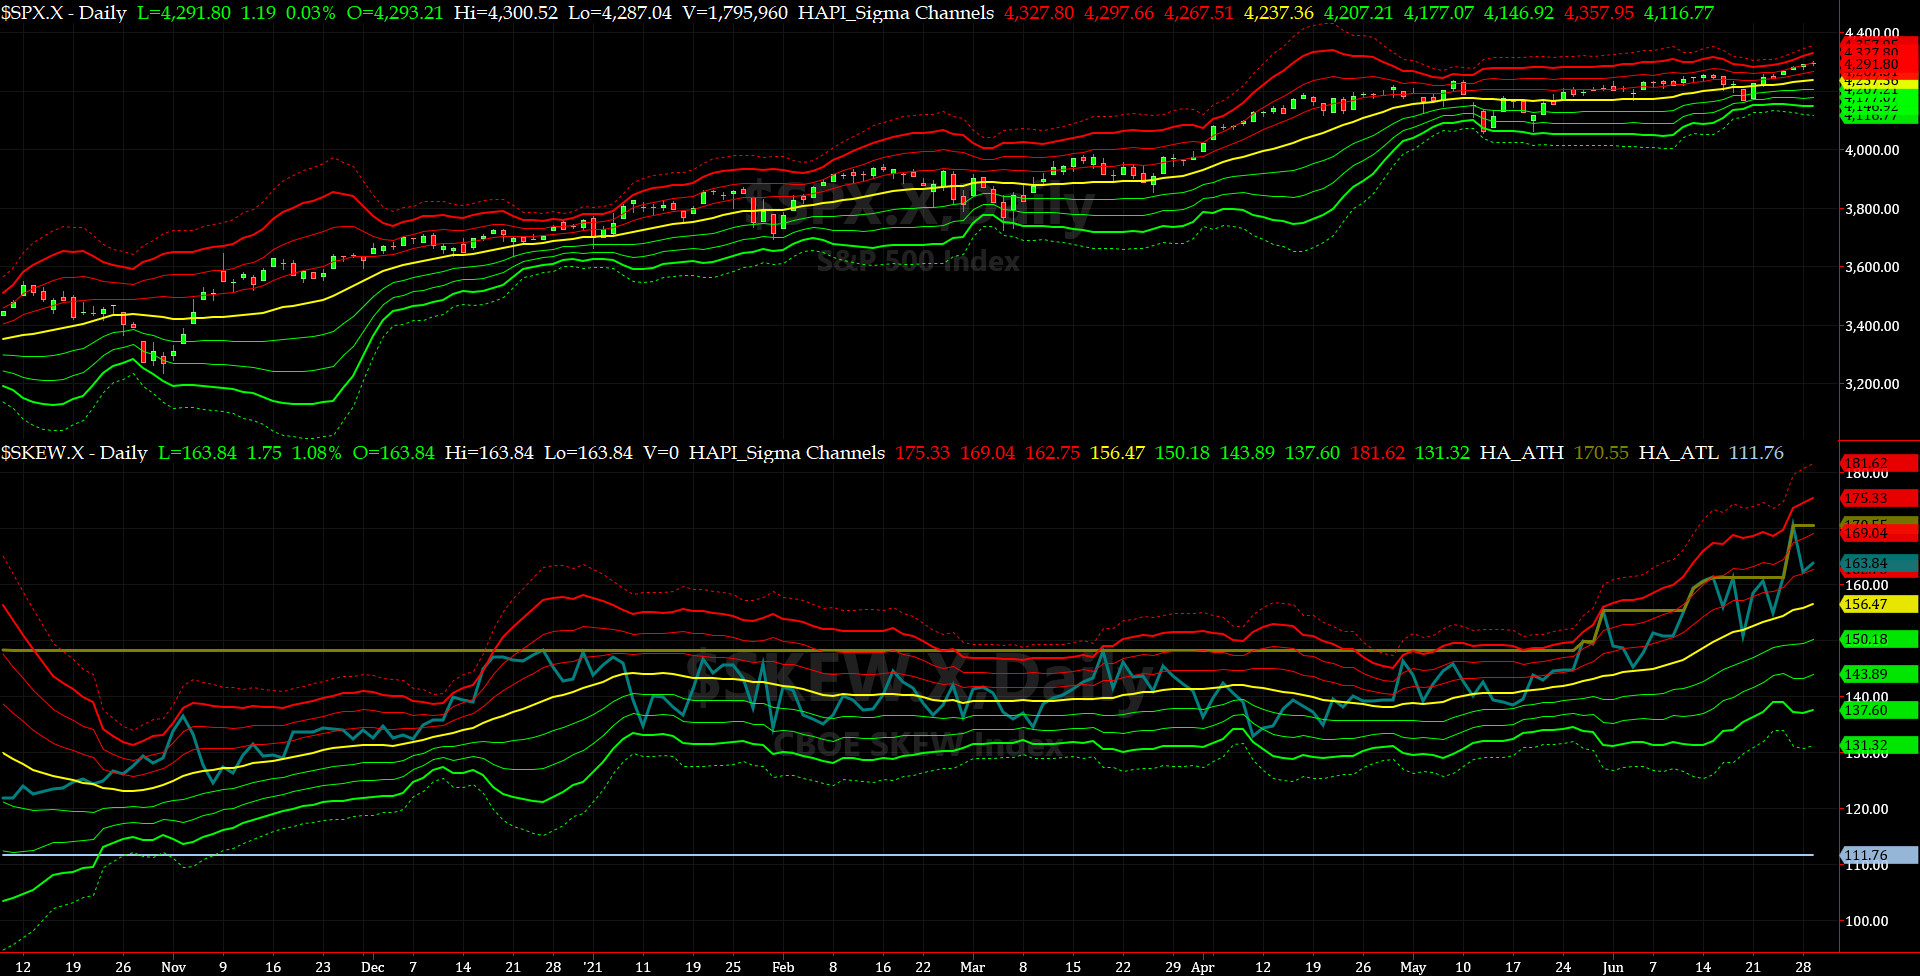
SPX SKEW (Downside Tail Risk) Chart
This week SPX SKEW (Downside Tail Risk), in the last 30 calendar days, has printed a few back-to-back ATHs culminating with highest reading ever, at 170 last Friday and closed today at ~164, now about its plus one sigma (normal = 115, range 100-150).
All quiet on the Eastern & Mid-Western Fronts? HRH Admiral Tiko, KCPE, says heck NO!!
How to interpret the value of SPX SKEW? (from CBOE white paper on SKEW)


3-month VIX Futures Spread(VX) Chart
This timing indicator for identifying tradable bottoms, (now long JUL21 and short OCT21 VIX Futures) hit -3.78 at the Close on Tuesday. Is there a Perfect Storm ahead of us?

HA_SP2 Chart
HA_SP2 = 75.2 (Buy Signal <= 30, Sell Signal >= 70)
This fantastic timing indicator says we are entering into an overbought condition again.

US Treasury T-Notes & T-Bonds Yields Chart
This past five trading days, the Notes & Bonds went nowhere fast but the front end is waking up. All eyes are on Fed Chair Powell now. End of July FOMC Meeting could be another momentous event.
Fari Hamzei
|


 Proactive Market Timing


