
|
 |
 |
 |
 |
 |
 |
 |
 |
 Proactive Market Timing Proactive Market Timing
|
|
|
Most Recent PMT vs SPX Performance Chart

|
|
|
|
Friday, October 16, 2015, 1100CT (OCT OX)
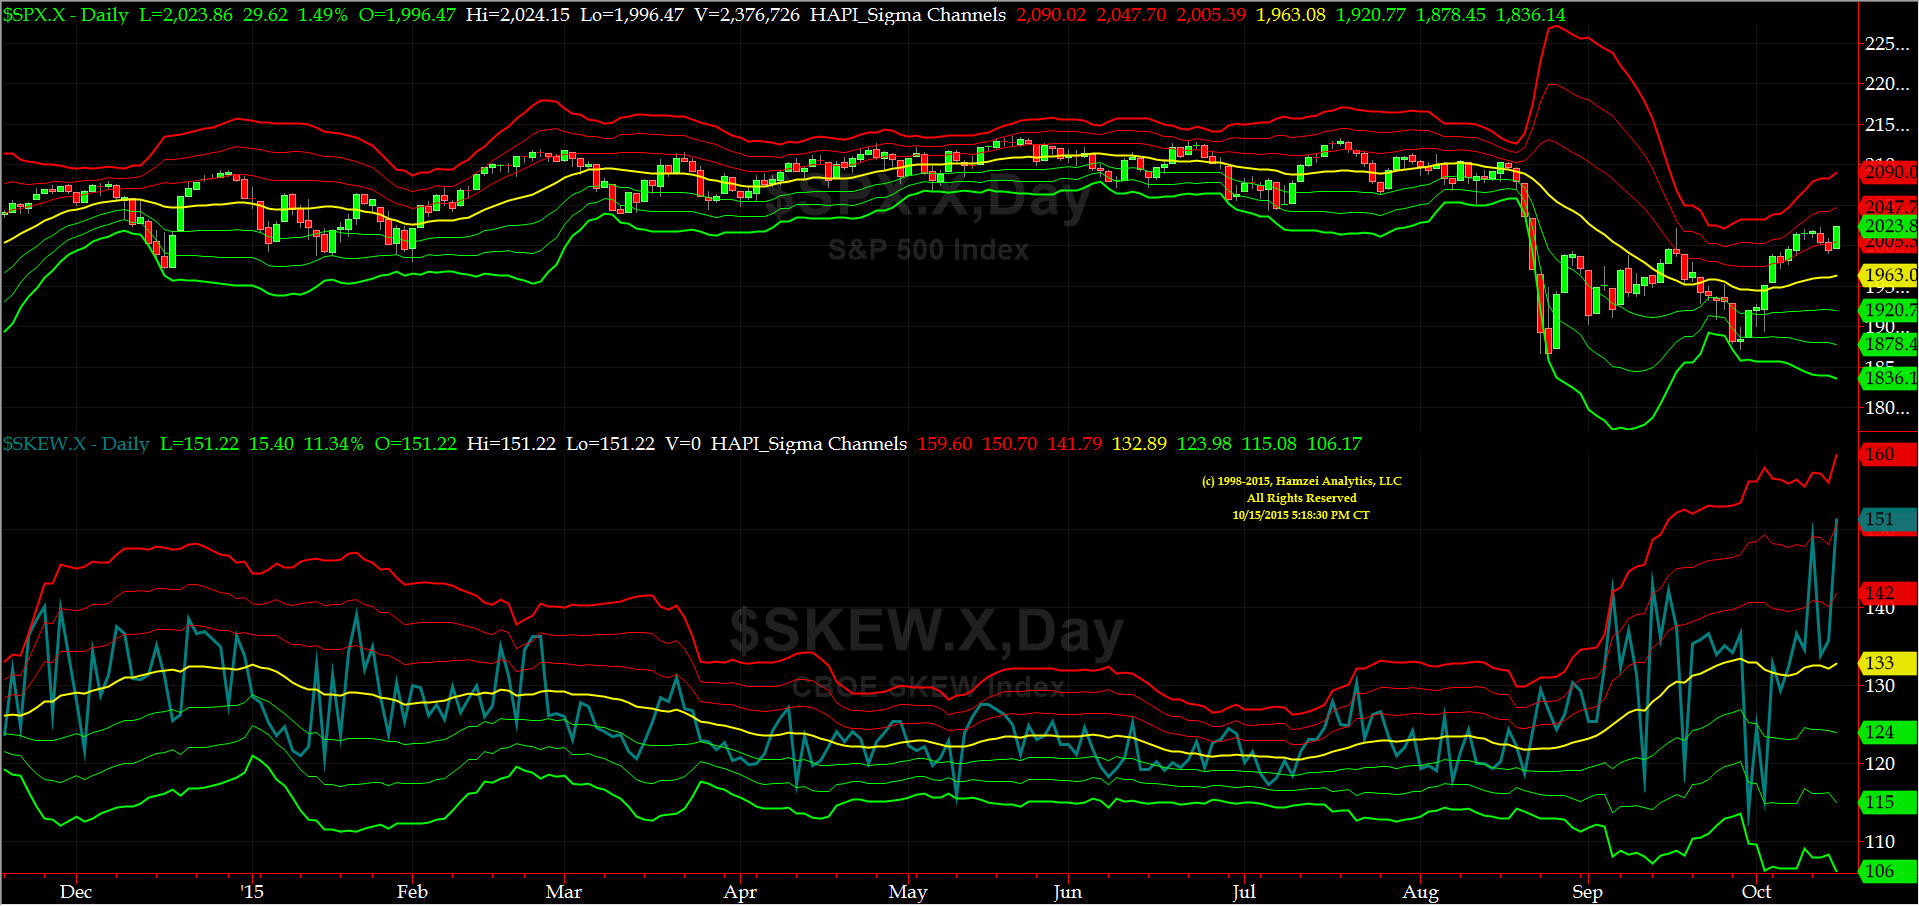
SPX SKEW (Tail Risk) Chart
Last night, after the close, SPX SKEW (Tail Risk) put in another all-time-high (ATH) reading of 151.22. IOHO, some market participants are expecting an outlier event.

SPX 2011 Time-Shifted Analog for SPX 2015
Clearly, the unwind of the very popular "Short SP-Long US Trade," yesterday created a melt-up in SPX. Today is October Options Expiration (OCT OX) and we should see a marginal day. Should the melt-up continue next week, this Analog's shelf-life is over.
We will have more comments on Sunday Night.
|
|
|
|
|
|
Wednesday, October 14, 2015, 0800CT
 Updated Timer Chart
Timer Chart showing SPX put in an outside bar reversal yesterday.
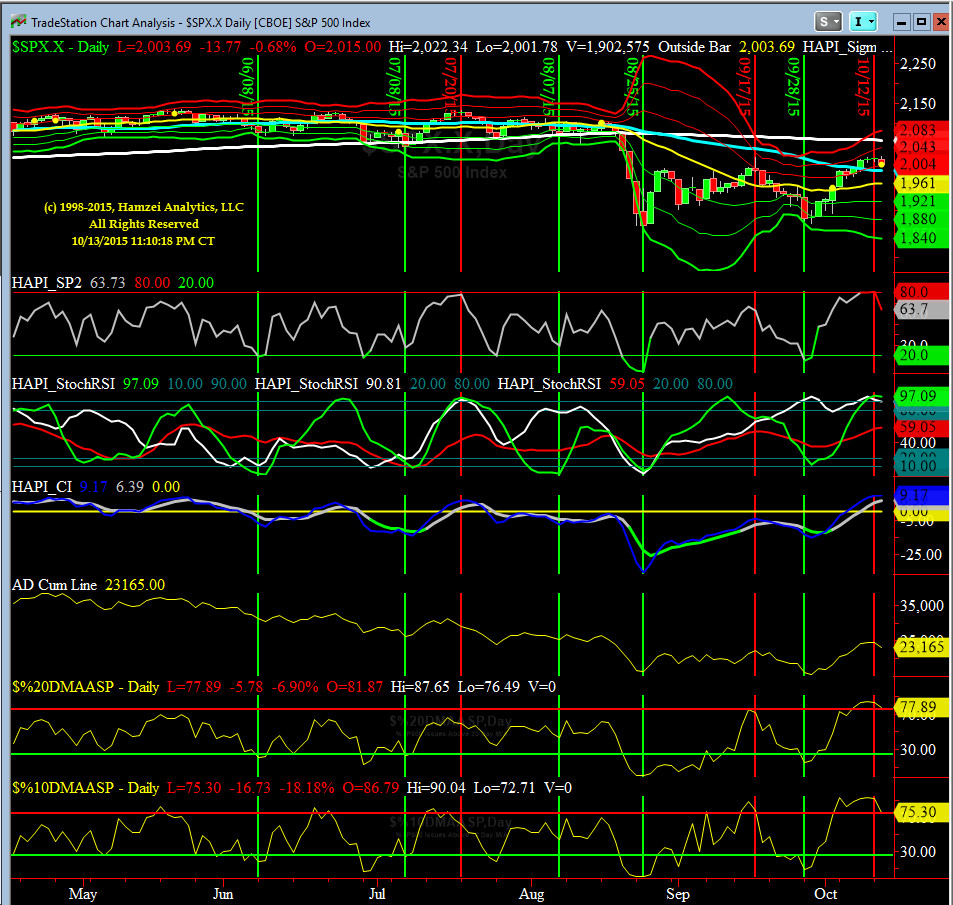 Updated HAPI_SP2 Chart
Our prop indicator SP2 finally starting to pull back -- short side should benefit here.
 Updated2011 TimeShifted Analog Chart
|
|
|
|
|
|
Tuesday, October 13, 2015, 0700CT
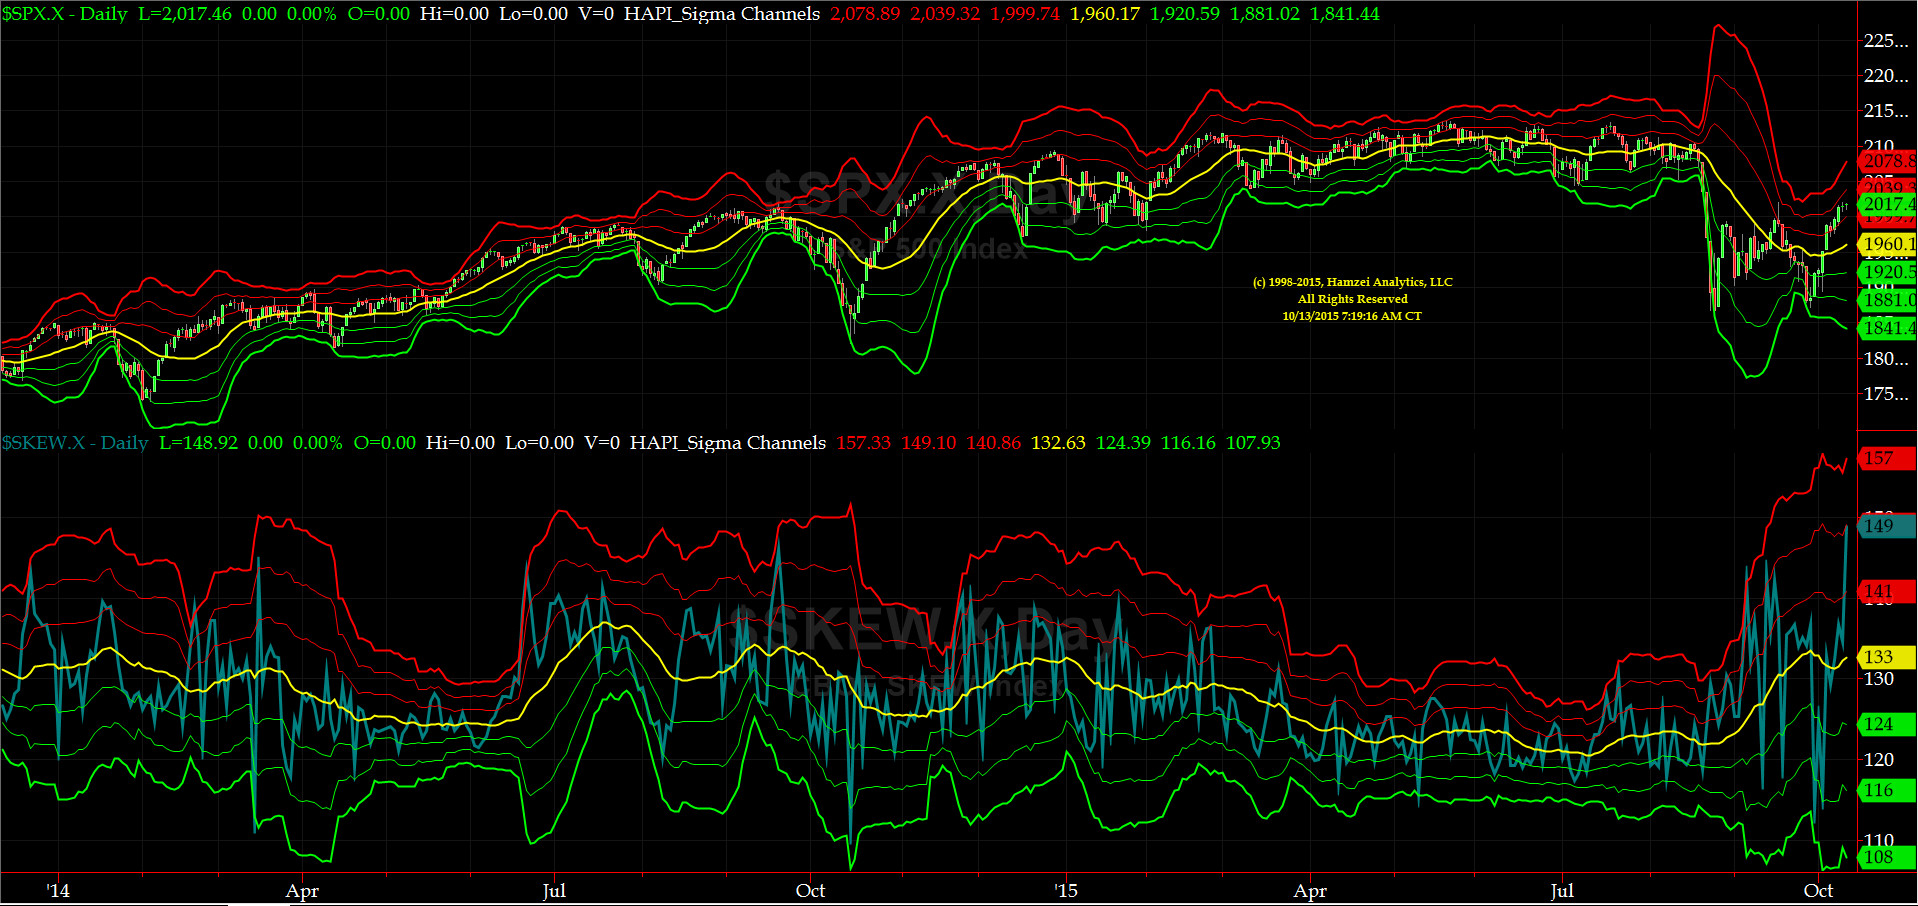
SPX SKEW (Tail Risk) Chart
SPX SKEW (Tail Risk) spike after the close last night is flashing an alert. Most likely, the options players expect some trouble ahead....
|
|
|
|
|
|
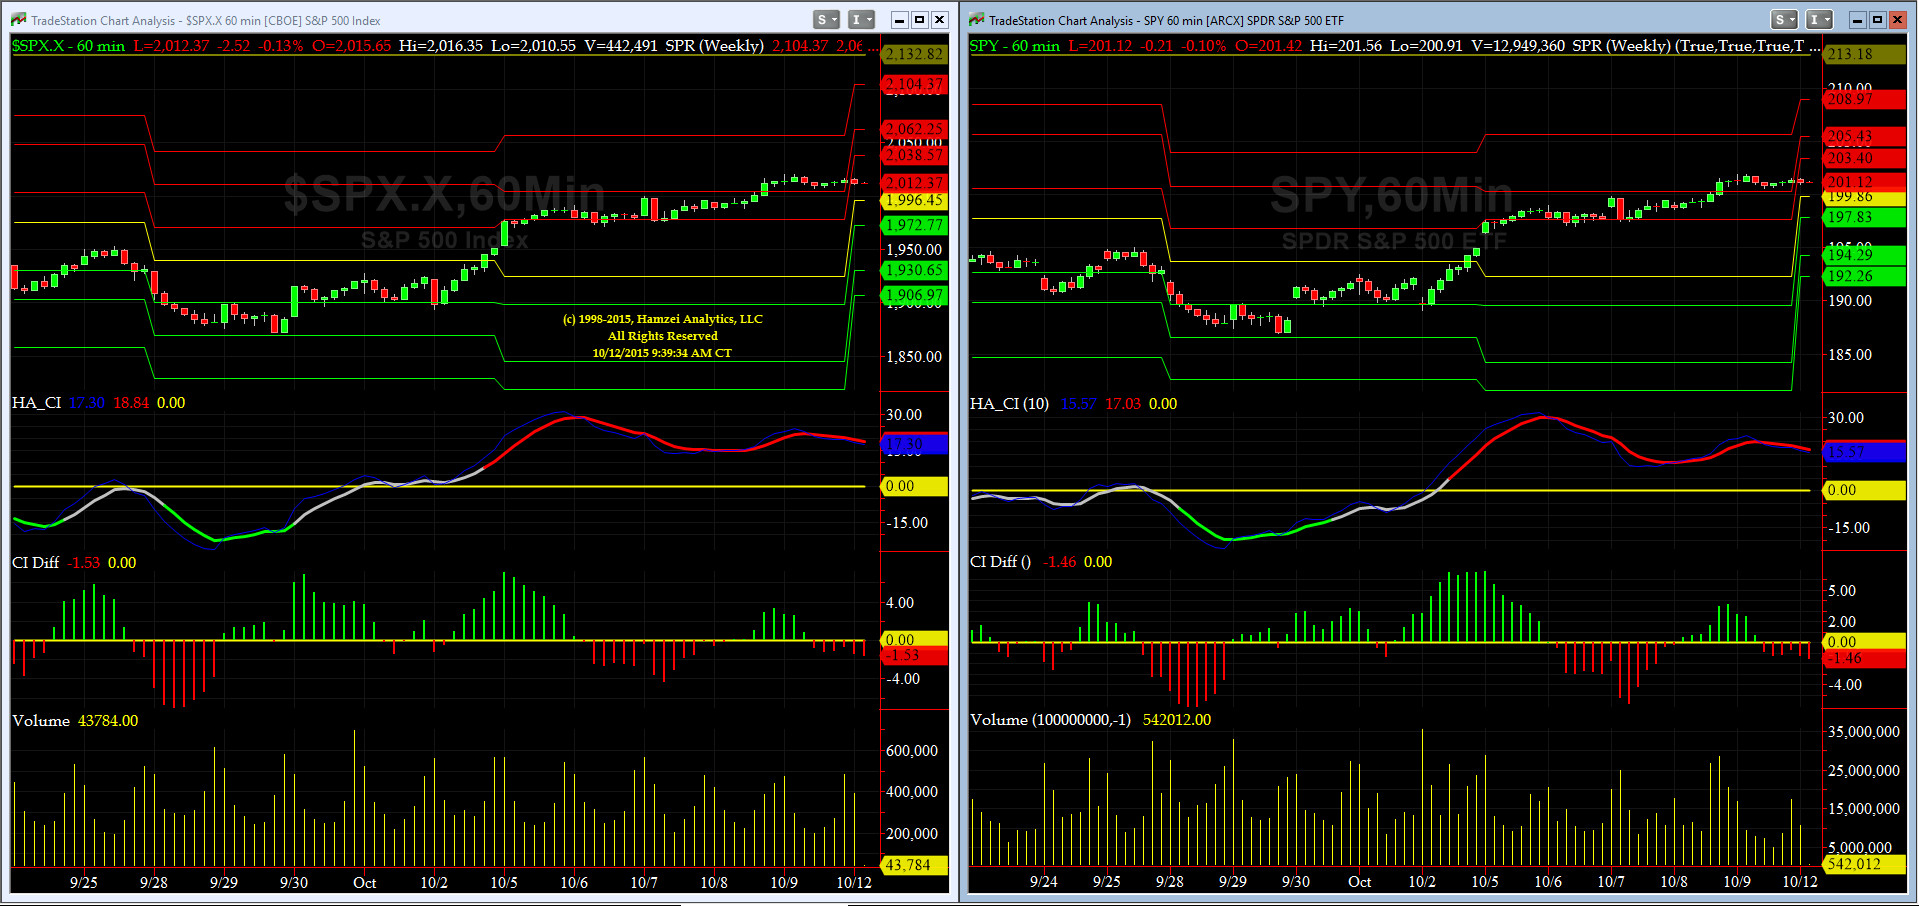
Monday, October 12, 2015, 1000CT
Companion Chart for Market Bias Review, Issue #114
|
|
|
|
|
|
Sunday Night, October 11, 2015, 2300CT
Market Bias Review, Issue #114
Most recent S&P-500 Cash Index (SPX): 2014.89 up +63.53 (up +3.26%) for the week ending on Friday, October 9th, 2015, which closed at its +1.5 sigma.
SPX ALL TIME INTRADAY HIGH = 2134.72 (reached on Wednesday, May 20th, 2015)
SPX ALL TIME CLOSING HIGH = 2130.82 (reached on Thursday, May 21st, 2015)
Current DAILY +2 Sigma SPX = 2032 with WEEKLY +2 Sigma = 2178
Current DAILY 0 Sigma (20 day MA) SPX = 1957 with WEEKLY 0 Sigma = 2042
Current DAILY -2 Sigma SPX = 1882 with WEEKLY -2 Sigma = 1905
50-Day MA SPX =1993 or +1.1% below SPX (max observed in last 5 yrs = +8.6%, min = -9.3% )
200-Day MA SPX = 2061 or -2.3% above SPX (max observed in last 5 yrs = 15.2%, min = -14%)
VIX = 17.08 which closed Friday at its -2 sigma (remember it�s the VIX�s vol pattern (its sigma channels) that matters, and not the level of VIX itself (this is per Dr. Robert Whaley, a great mentor and the inventor of original VIX, now called VXO. VIX usually peaks around a test of its +4 sigma))
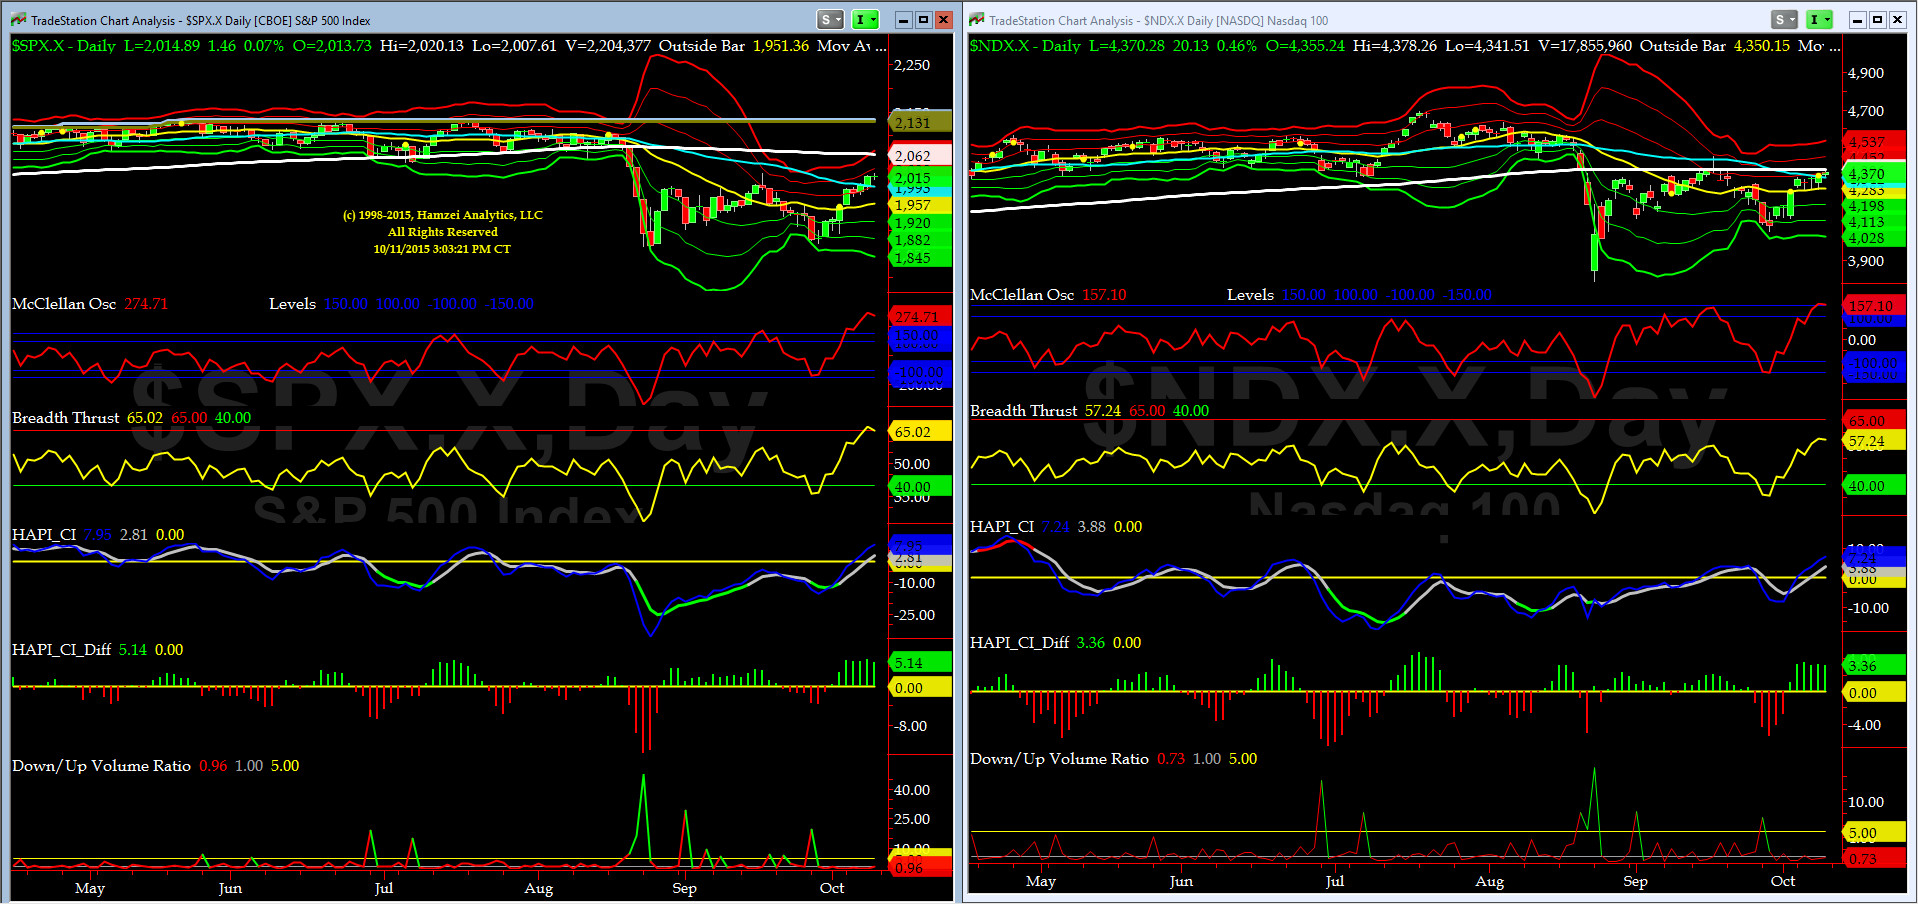
NYSE McClellan Oscillator = +275 (-150 is start of the O/S area; around -275 to -300 area or lower, we go into the �launch-pad� mode, over +150, we are in O/B area)
NYSE Breadth Thrust = 65.02 (40 is considered as oversold and 65 as overbought)
WEEKLY Timing Model = on a SELL Signal since Friday 8/7/15 CLOSE (first time in 32 months)
DAILY Timing Model = on a BUY Signal since Tuesday 10/6/15 CLOSE
Max SPX 52wk-highs reading last week = 22 (over 120-140, the local maxima is in)
Max SPX 52wk-Lows reading last week = 1 (over 40-60, the local minima is in)
HA_SP1 = at +2 Sigma
HA_Momo = +8.39 (reversals most likely occur above +10 or below -10)
HA_SP2 = 80.5 (Buy signal <= 20, Sell Signal >= 80)
3-mo. VX Futures Spread (long OCT short JAN) = -1.75 (-3 to -2.5 SELL signal, 0 BUY Signal)
SPX SKEW (Tail Risk) = 135 (normal = 120-125, range 100-150)
Our current SPX Bias with Timer Digest: SHORT SPX as of Tuesday, October 6th, 2015 Close at 1979.92
Our previous Bias: FLAT SPX (since Monday, October 5th, 2015 Close at 1987.05)
This WEEK�s Bias = Cautiously SHORT SPX Complex this next week via long Put Spreads. we expect management guidance in the Earnings Season to be key pressure on equities.
SPX Profit Target = 1955-1950
SPX Money Management Stop = 2025
BOTTOM LINE: Our Markets have entered a high vol, tough trading period ahead�.better carefully watch your bet size, sailors.
NOTE: All LEVELS mentioned here have been, are, and will be, based on the S&P-500 SPX Cash Index, and not the ES Futures. Tomorrow after the first hour is complete, we will post here a companion chart showing critical short-term WEEKLY levels to watch for possible �retest failures.�
Fari Hamzei
|
|
Sunday October 11, 2015 6:00pm CT
Market Timing Charts & Comments
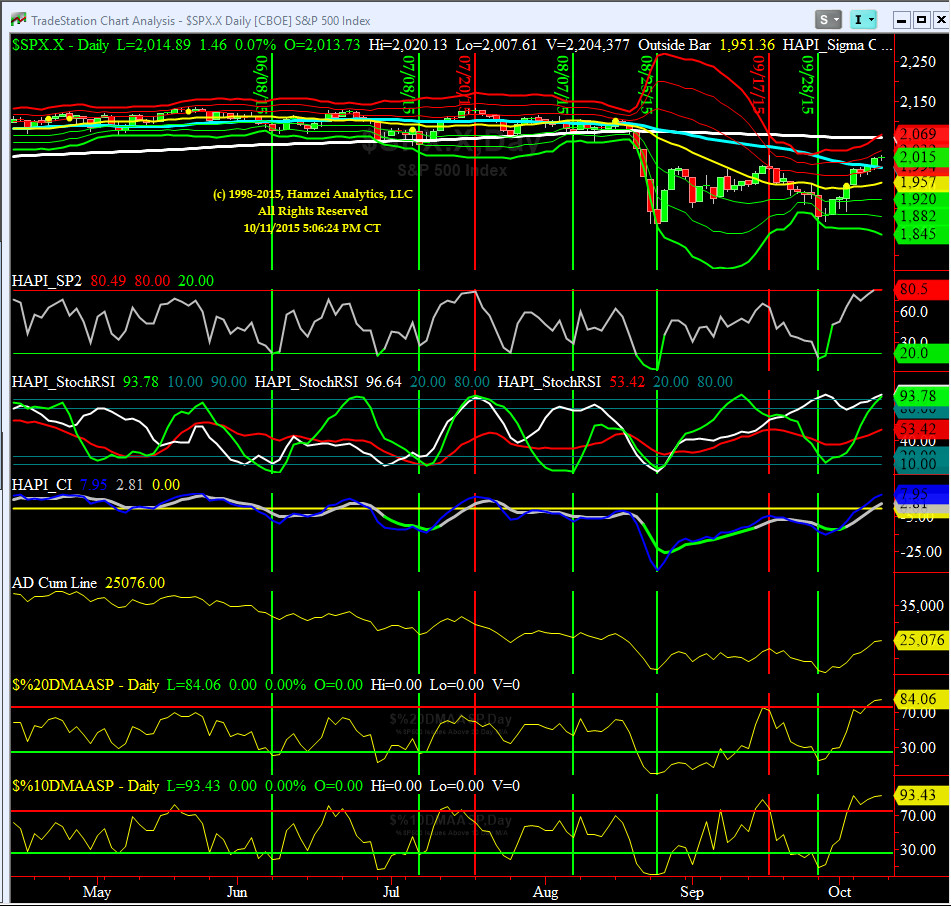
Timer Chart of S&P-500 Cash Index (SPX)
The move up this week, up to 50-day MA (~1996) was expected, but beyond that, came in as a surprise.
On Friday NYSE McClellan Osc closed +275 -- clearly it is short-term overbought.
NYSE Breadth Thrust came in at 65 also overbought.
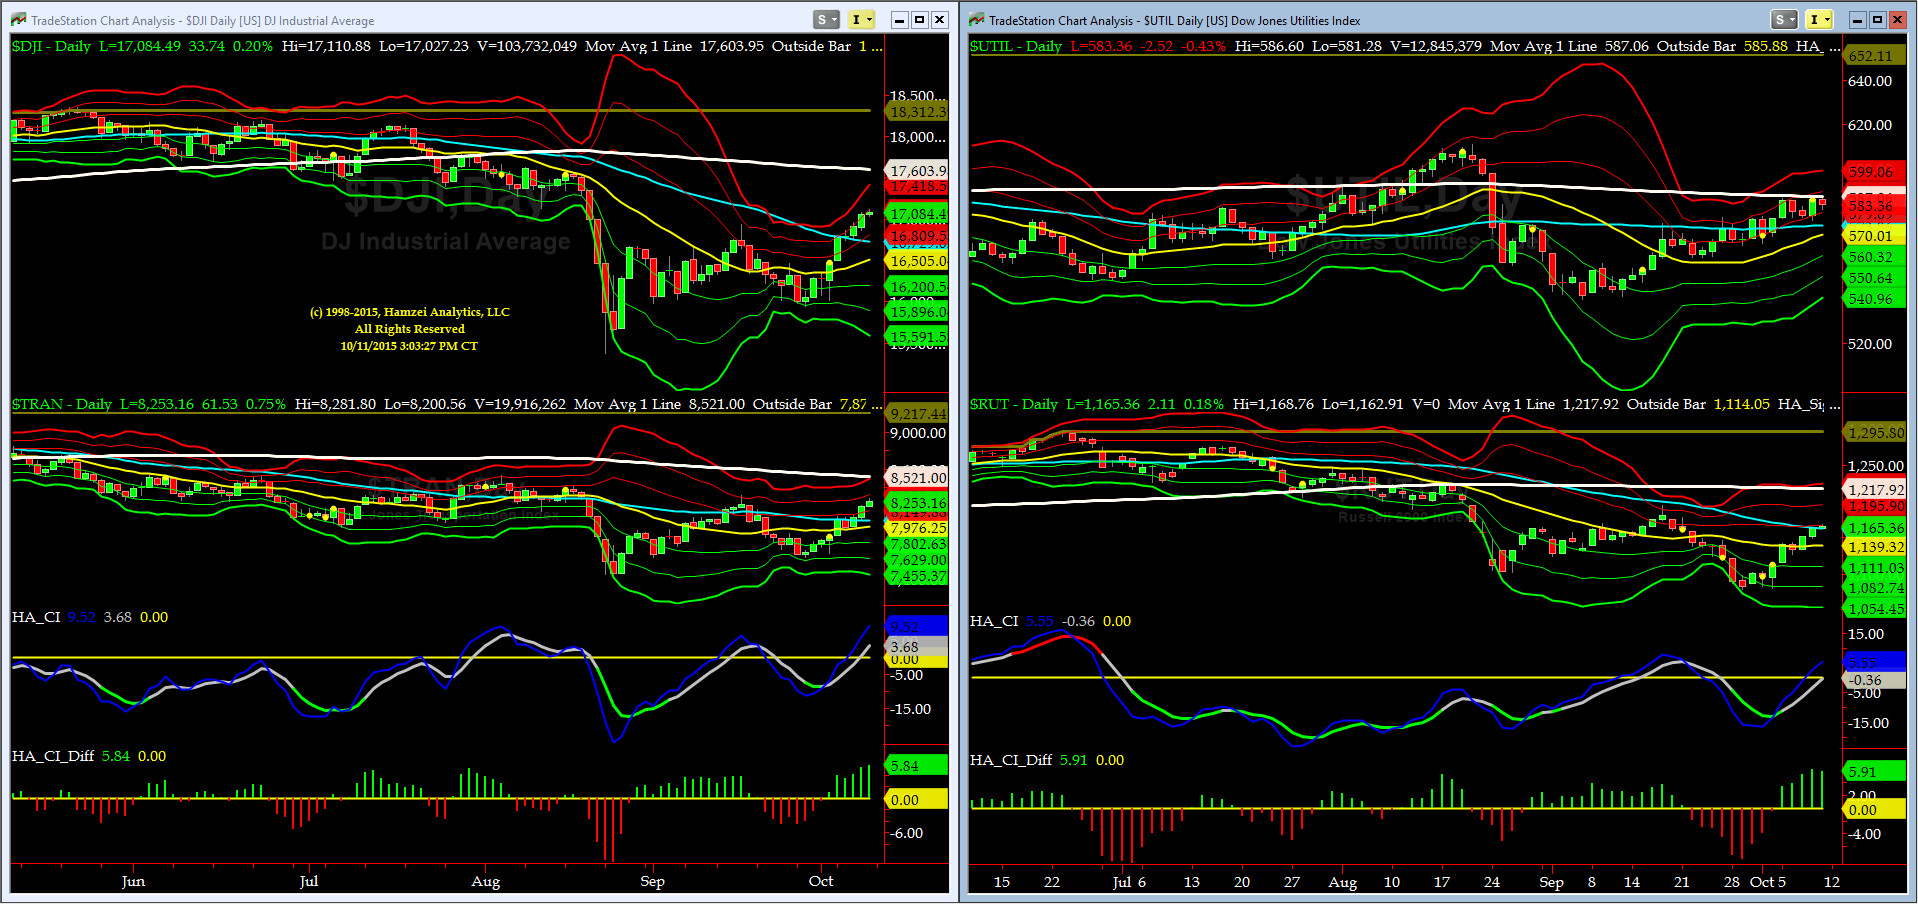
Canaries [in the Coal Mine] Chart for DJ TRAN & RUT Indices Chart
Beautiful run-up by DJ TRAN (Forward Economy looks more promising) and RUT says RISK is coming back in but we do expect some resistance at its 200 bar (~1220 on RUT).
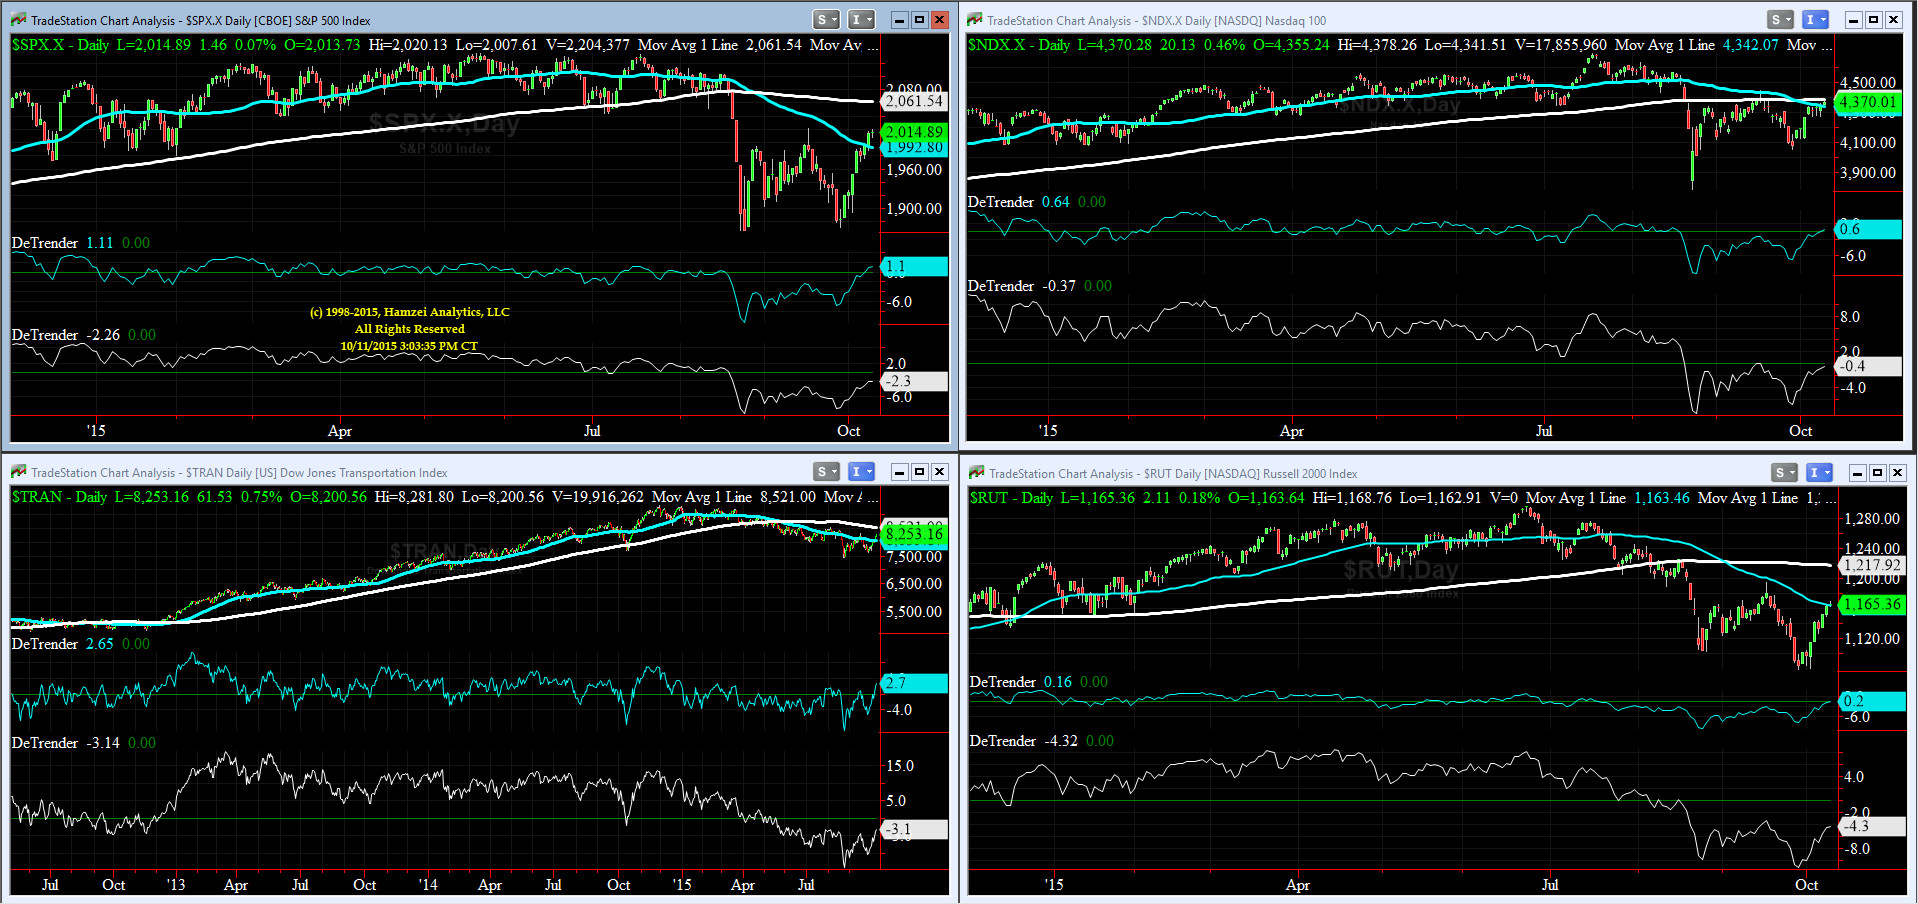
DeTrenders Charts for SPX, NDX, TRAN & RUT Indices
50DTs are positive for all four indices covered here SPX, NDX, DJ TRAN & RUT while all 200DTs are still negative.
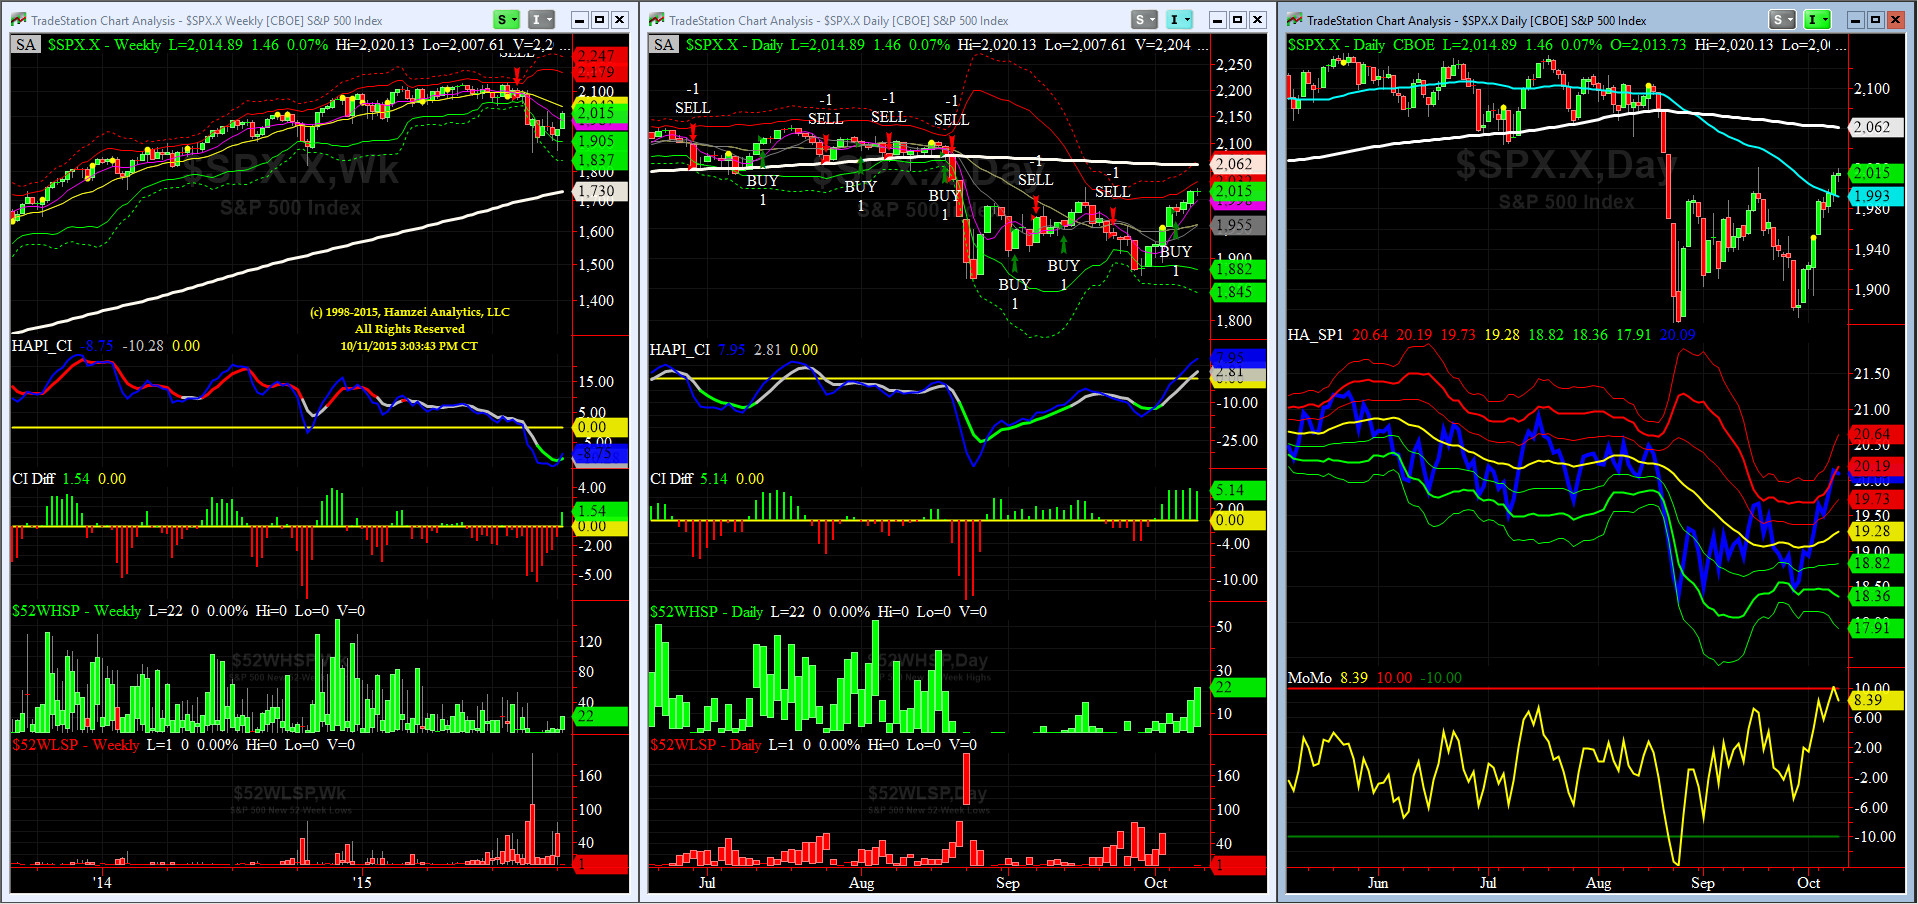
HA_SP1_momo Chart for SPX
We are on SELL (WEEKLY Timing Model) & BUY (DAILY Timing Model) as of last Tuesday. Look at HA_momo, at +8.39 now, is pulling back from resistance at +10. Also note we had a 22 52wkhigh for SPX on Friday.
HA_SP2 Chart for SPX
This is a new chart. We have called out this indicator in last three webinars. At 80.3, this indicator also says we are very short-term overbought.
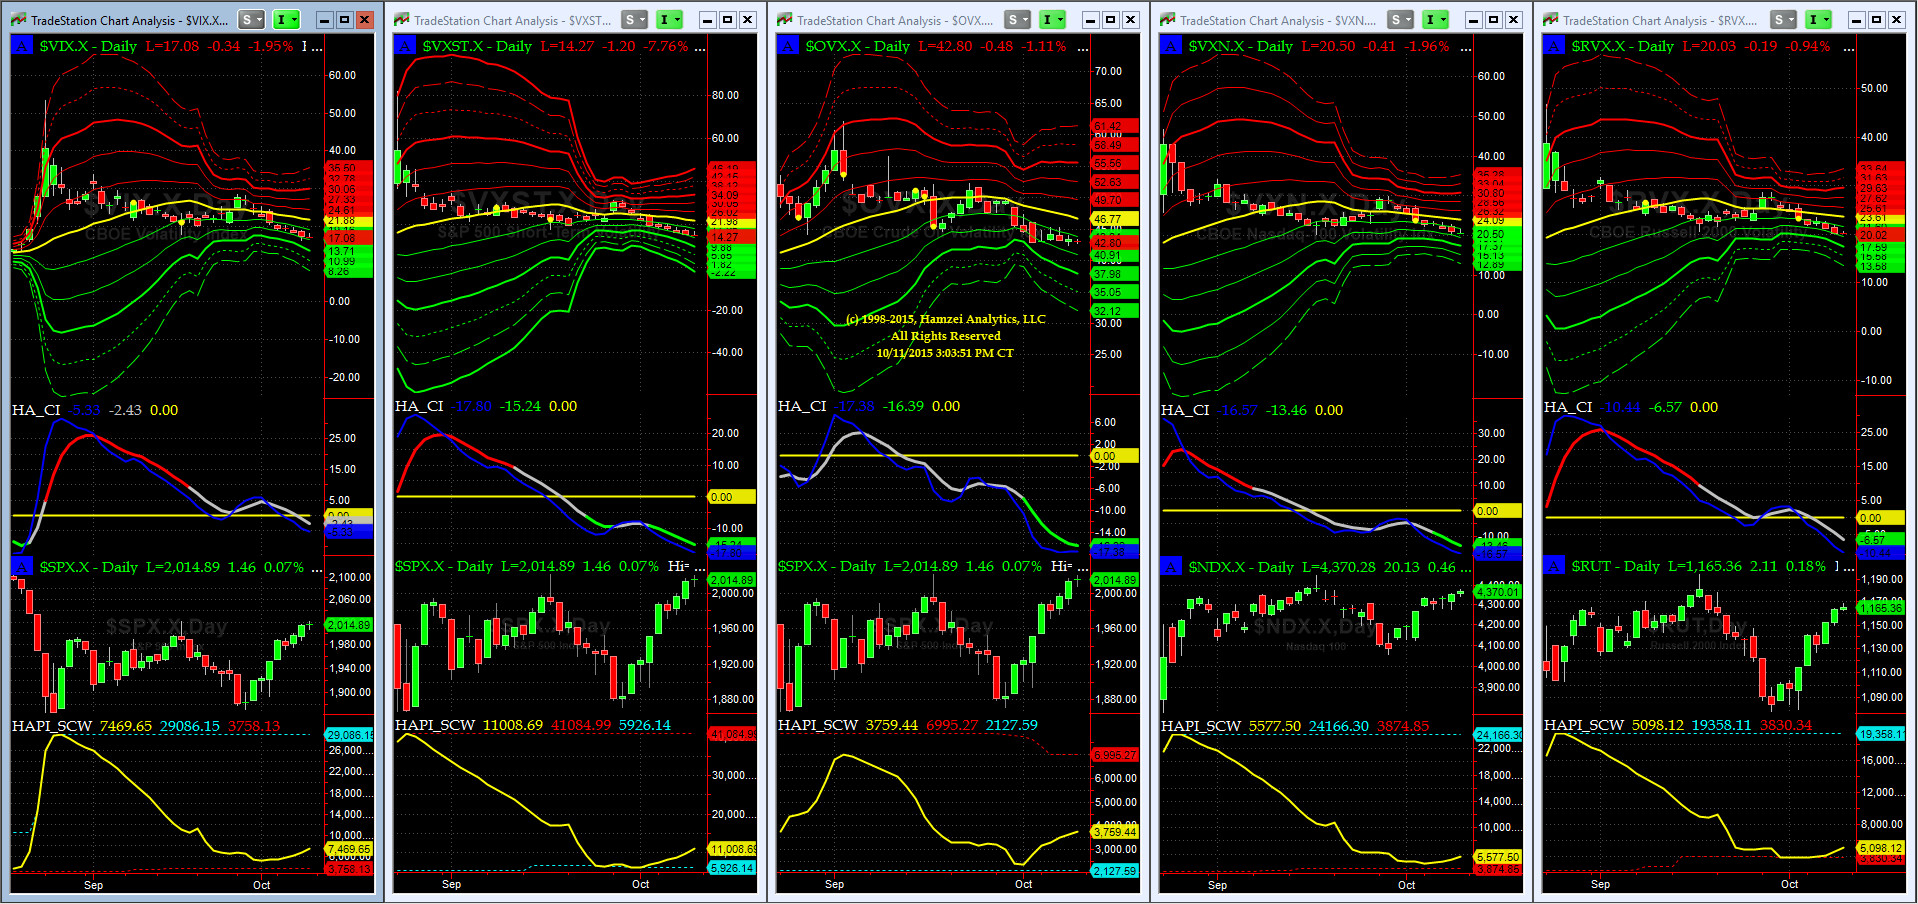
Vol of the Vols Chart
No signal till we get another shockwave (volatility spike).
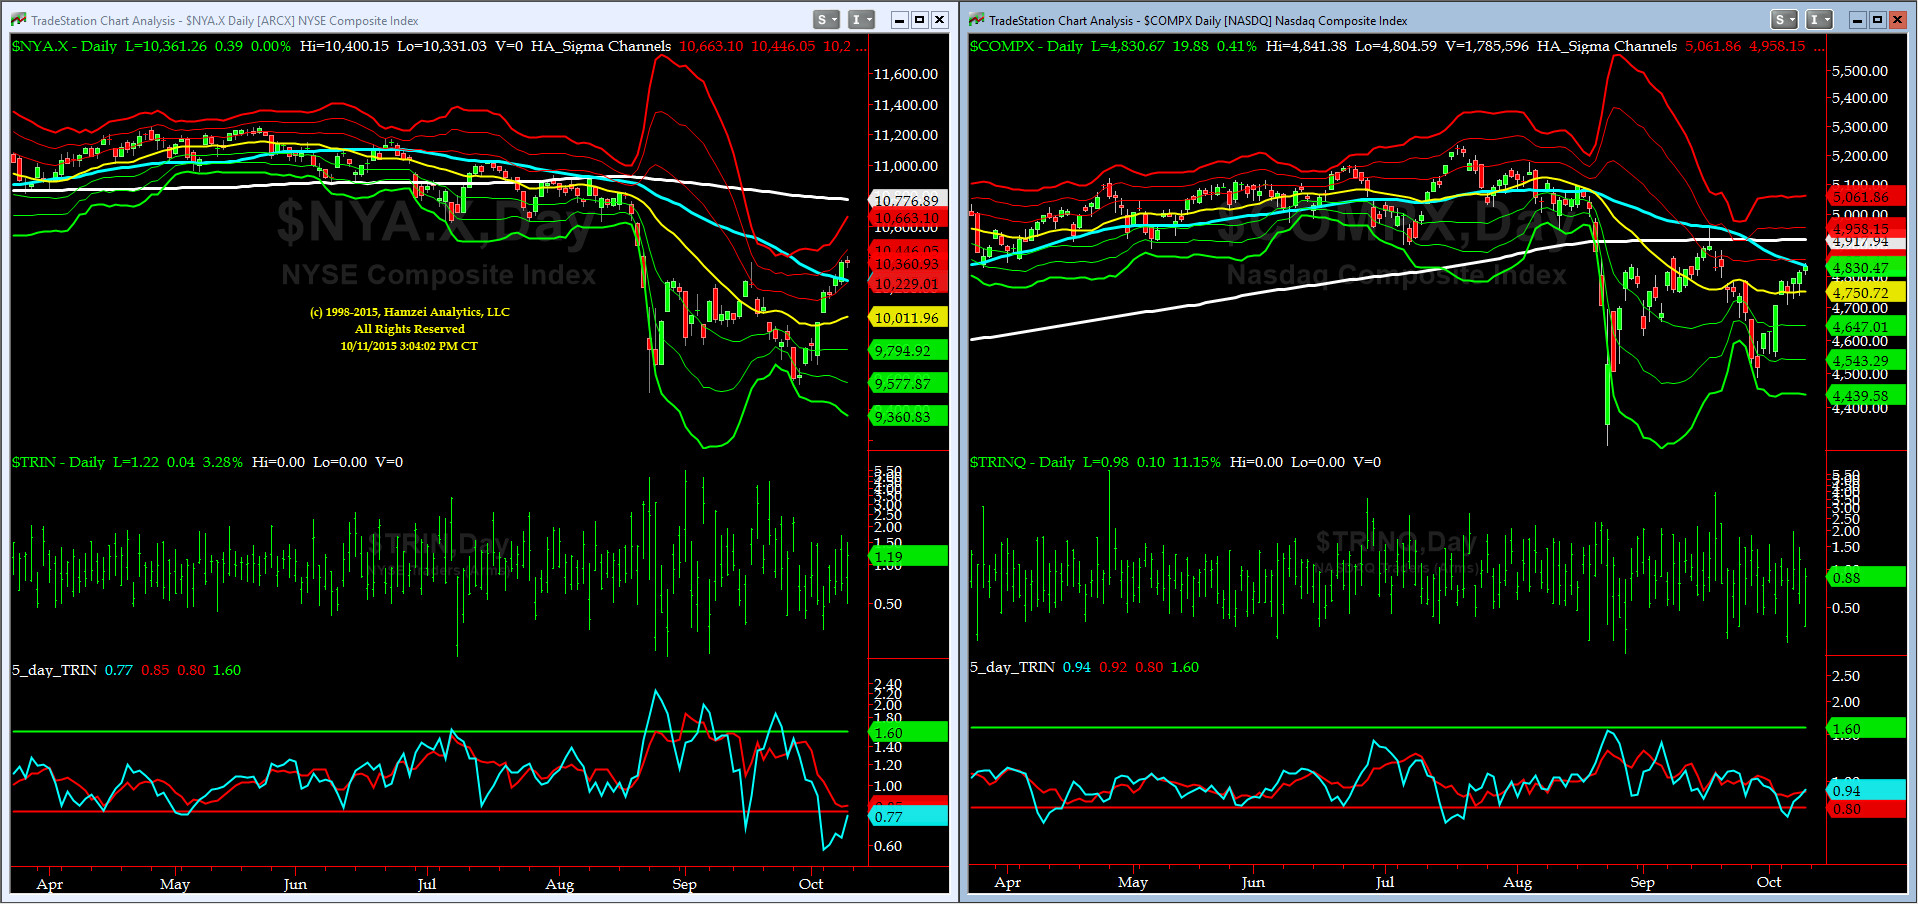
5-day TRIN & TRINQ Charts
NASDAQ's is on a SELL and NYSE's is right behind it.
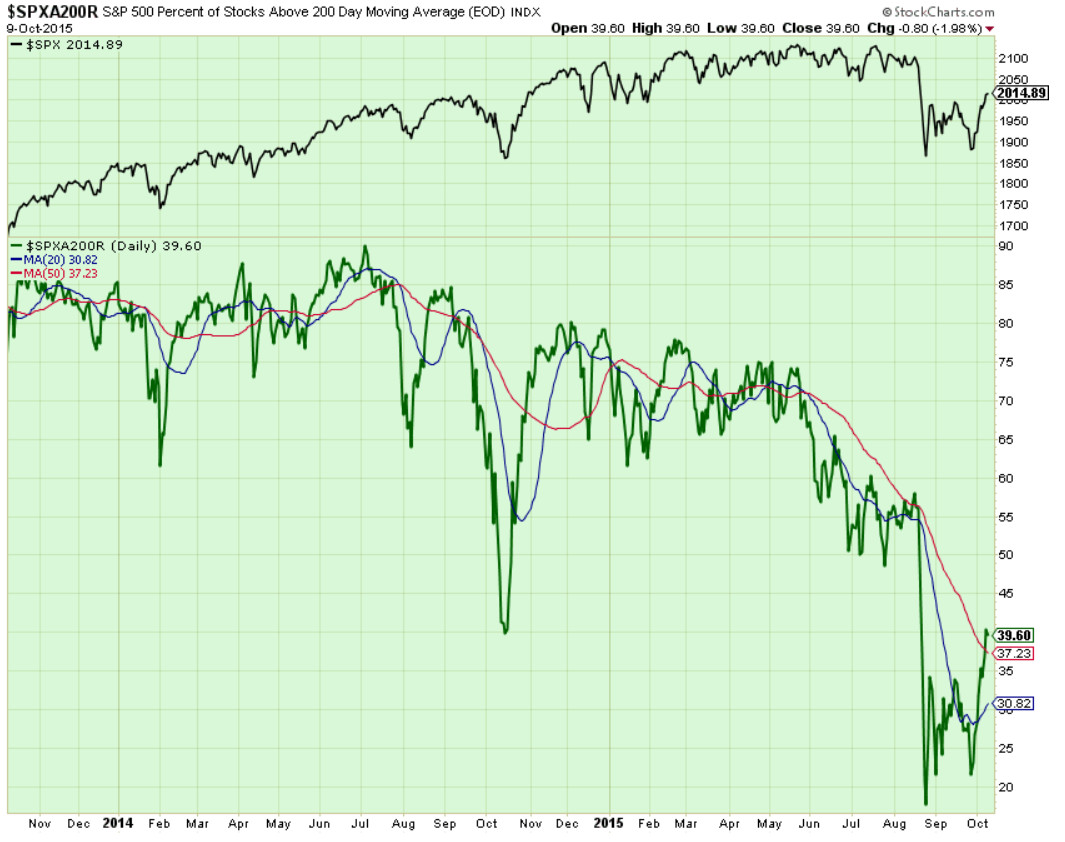
Components of SPX above their respective 200day MA Chart
We punched thru 50 day, this chart says we may be starting a move up.
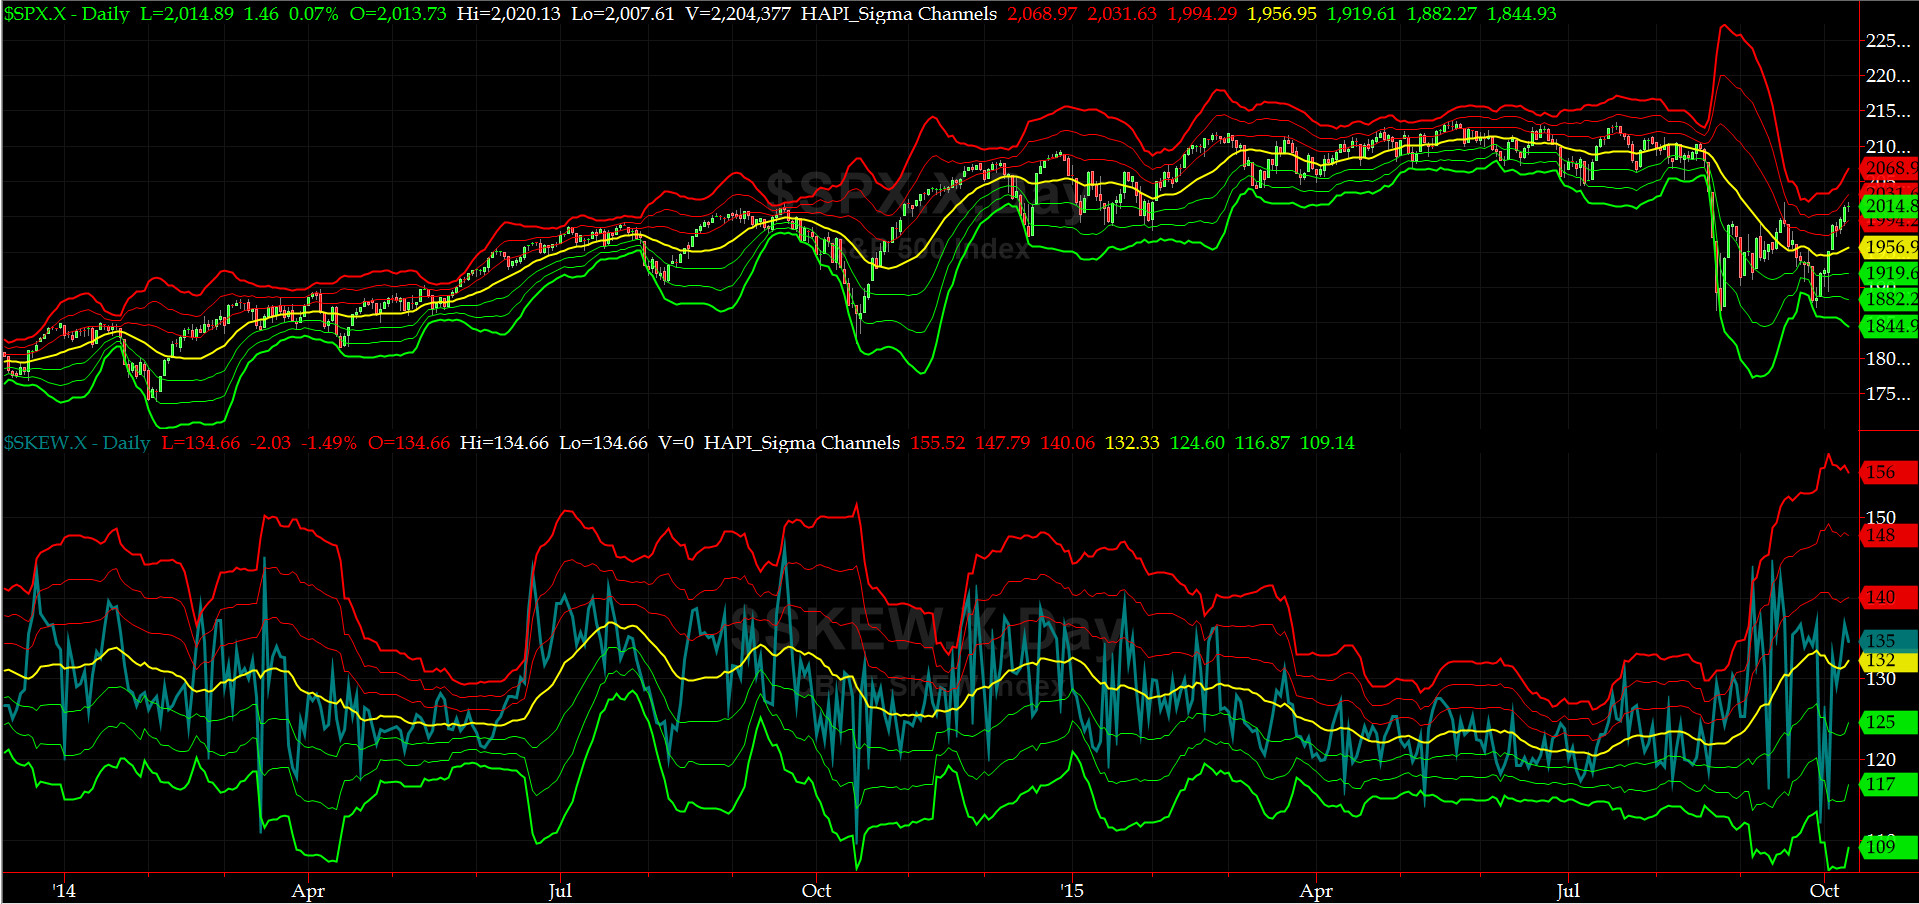
SPX SKEW (Tail Risk) Chart
SPX SKEW (Tail Risk) went down and came back up hard and its 0 sigma is now heading up (yellow line turned up). The SPX Tail Risk is not going away soon. What the market, collectively knows (& is pricing in) here, is of concern to us.
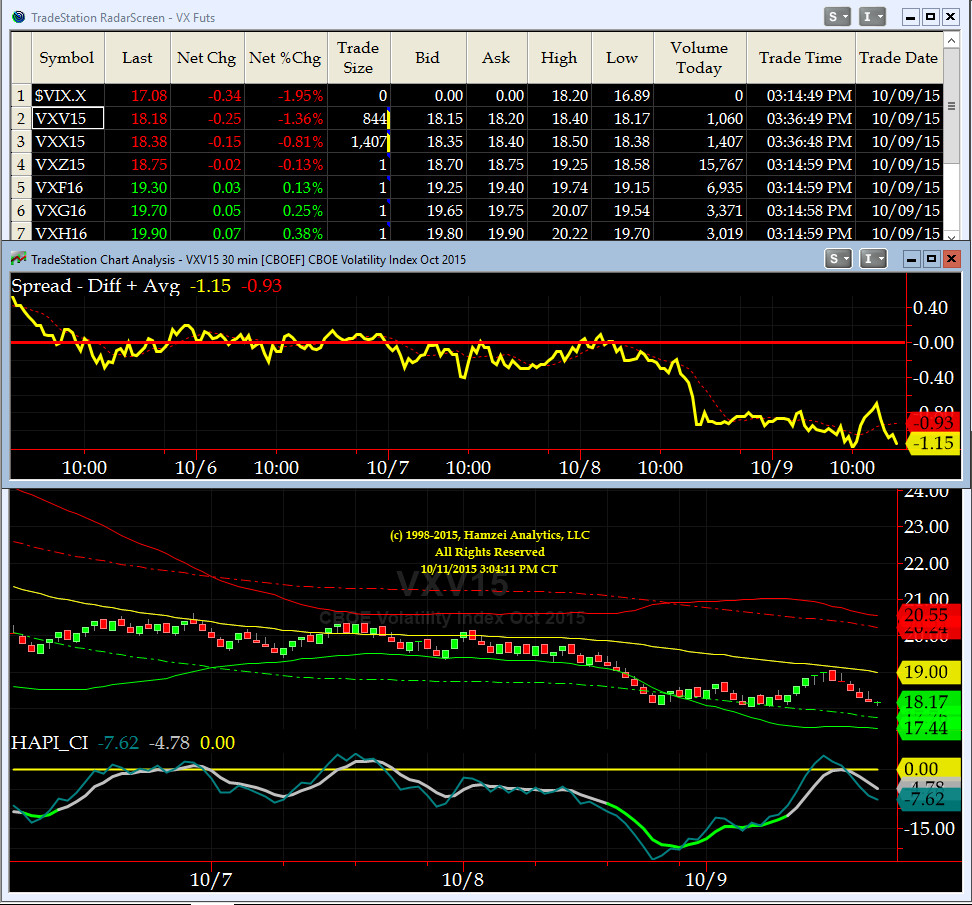
3-month VIX Futures Spread(VX) Chart
This 3-month VIX Futures Spread here is still too high, ioho. We interpret that as our markets have some worries, even though SPX has rallied for 8 out of last 9 sessions.
Notice we have added an OTF Chart for Front Month VX Contract which just had a CI Cross and it is on a SELL as of now.
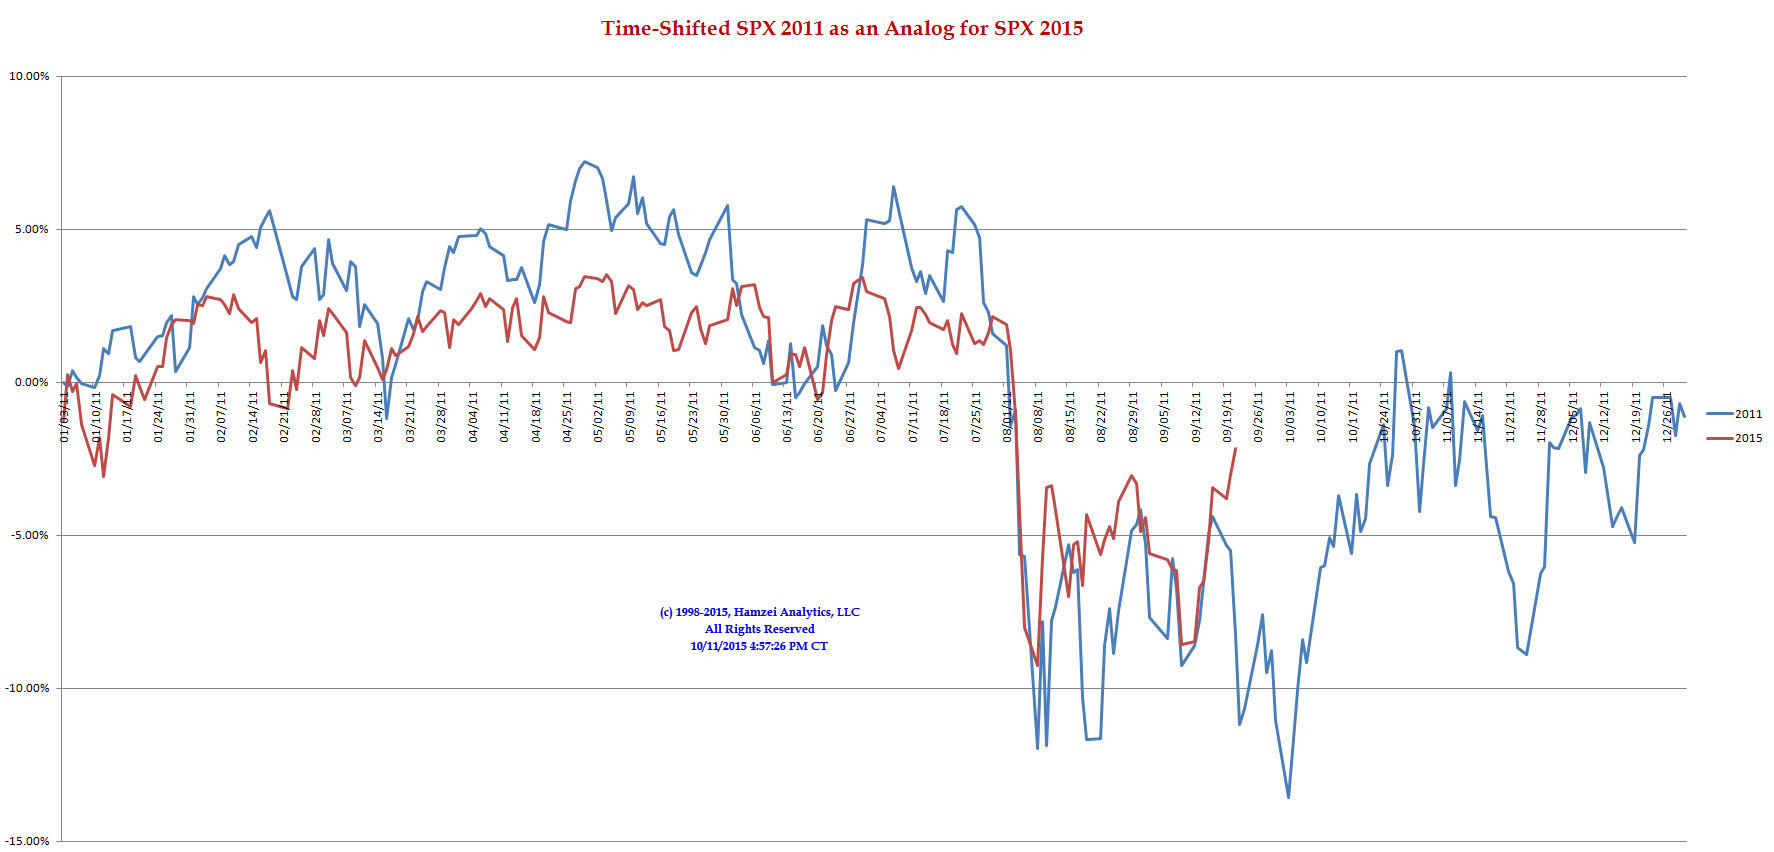
SPX 2011 Time-Shifted Analog for SPX 2015
A few have questioned whether this time-shifted 2011 Analog has ran it course. A few days out of synch is never an issue. But, there is an old saying: "Analogs shall work until they don't." We shall find out the answer to their question only in our rear-view mirror.
Good luck this week,
Fari Hamzei
|
|
|
|
|
|
Customer Care:
|
|
|
|
|
|
|
 |
 |
|
 |
|
 |
 |
 |
HA YouTube Channel ::: HA Blog ::: Testimonials ::: Tutorials & FAQs ::: Privacy Policy
|
Trading Derivatives (Options & Futures) contains substantial risk and is not for every investor. An investor could potentially lose all or more than his/her initial investment.
Only risk capital should be used for trading and only those with sufficient risk capital should consider trading derivatives. Past performance is not
necessarily indicative of future results. Testimonials appearing on this website may not be representative of other clients or customers
and are not a guarantee of future performance or success.
|
| (c) 1998-2025, Hamzei Analytics, LLC.® All Rights Reserved. |
|
|