
|
 |
 |
 |
 |
 |
 |
 |
 |
 Proactive Market Timing Proactive Market Timing
|
|
|
Most Recent PMT vs SPX Performance Chart

|
|
|
|
Wednesday, October 21, 2015, 2200CT
Change of this WEEK�s Bias = we are LONG SPX Complex via long Call Spreads. Intermediate Risk Factors, at the margin, are also subsiding.
SPX Profit Target = 2060 (200-Day MA)
SPX Money Management Stop = 2010
BOTTOM LINE: Still we have a tough trading period ahead� CAT, GOOGL, MSFT & AMZN report tomorrow and AAPL & TWTR are next Tuesday.
Wednesday, October 21, 2015, 0025CT
Notice of Change Bias with Timer Digest
Dear Jim,
I am going from SHORT SPX to LONG SPX as of Tuesday, October 20th Close of 2030.77.
This signal should be good for about 4 weeks.
Fari Hamzei
Founder,
Hamzei Analytics, LLC
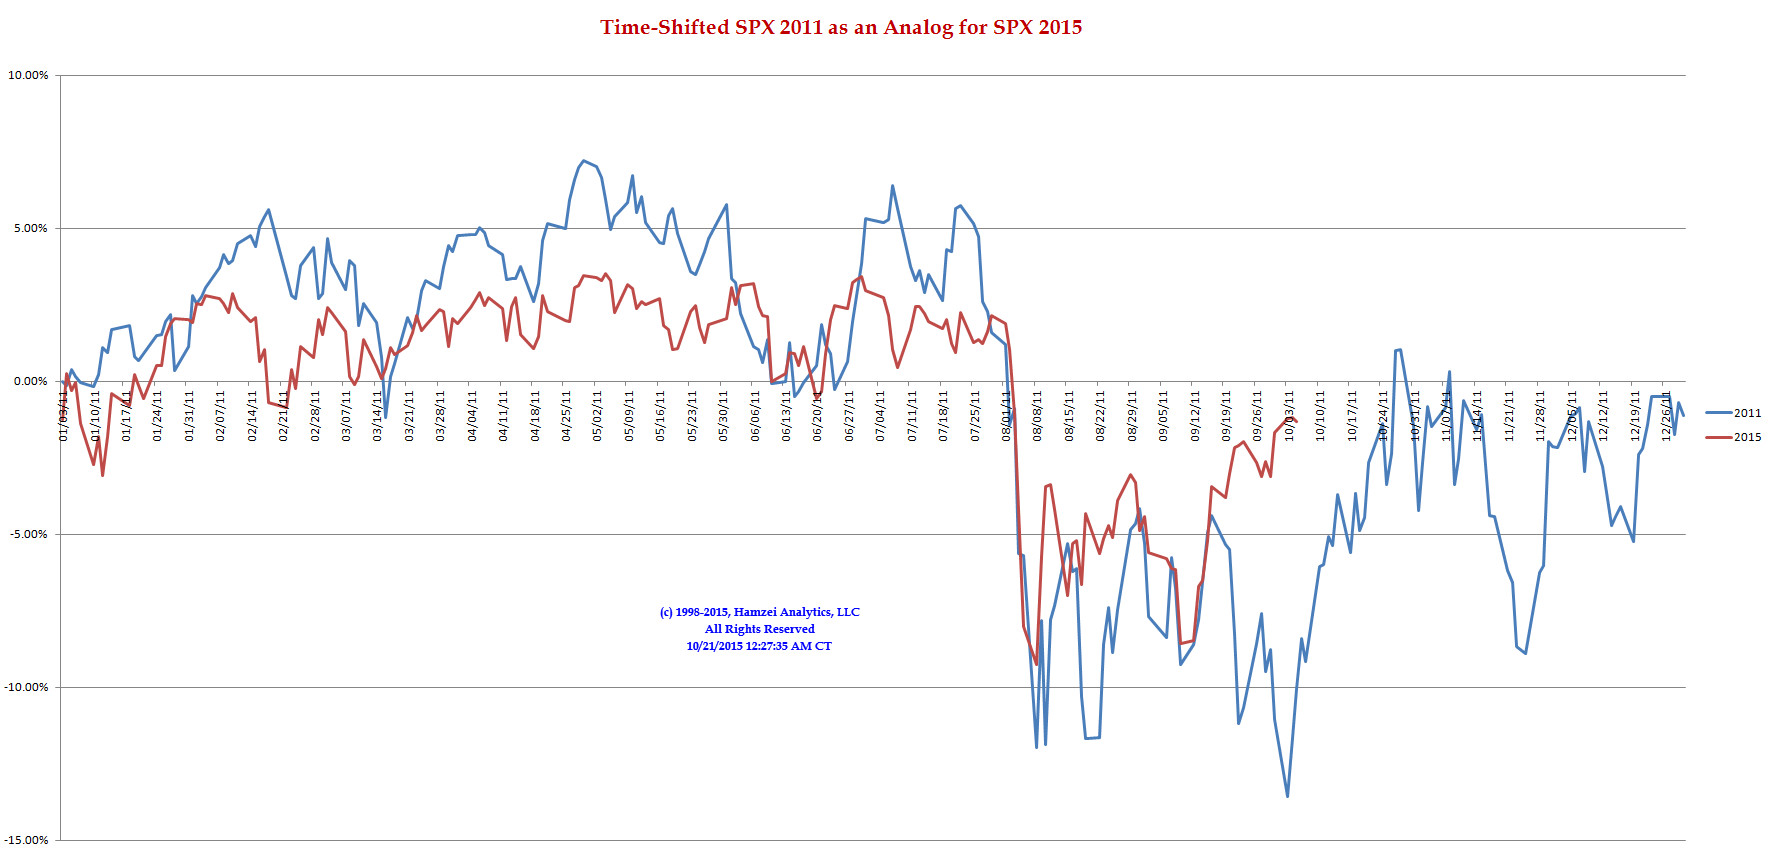
SPX 2011 Time-Shifted Analog for SPX 2015
The huge price divergence between SPX 2015 with its 2011 Time-Shifted (TS) Analog, in percentage terms, can NOT be ignored. The next 3 to 4 weeks are crucial for our Equity Markets and its 2011 TS Analog.
|
|
|
|
|
|
Monday, October 19, 2015, 1000CT
Companion Chart for Market Bias Review, Issue #115

|
|
|
|
|
|
Sunday Night, October 18, 2015, 2000CT
Market Bias Review, Issue #115
Most recent S&P-500 Cash Index (SPX): 2033.11 up +18.22 (up +0.90%) for the week ending on Friday, October 16th, 2015, which again closed near its +1.5 sigma.
SPX ALL TIME INTRADAY HIGH = 2134.72 (reached on Wednesday, May 20th, 2015)
SPX ALL TIME CLOSING HIGH = 2130.82 (reached on Thursday, May 21st, 2015)
Current DAILY +2 Sigma SPX = 2057 with WEEKLY +2 Sigma = 2172
Current DAILY 0 Sigma (20 day MA) SPX = 1967 with WEEKLY 0 Sigma = 2038
Current DAILY -2 Sigma SPX = 1877 with WEEKLY -2 Sigma = 1905
50-Day MA SPX =1985 or +2.4% below SPX (max observed in last 5 yrs = +8.6%, min = -9.3% )
200-Day MA SPX = 2060 or -1.3% above SPX (max observed in last 5 yrs = 15.2%, min = -14%)
VIX = 15.05 which closed Friday at its -1.5 sigma (remember it�s the VIX�s vol pattern (its sigma channels) that matters, and not the level of VIX itself (this is per Dr. Robert Whaley, a great mentor and the inventor of original VIX, now called VXO. VIX usually peaks around a test of its +4 sigma))
NYSE McClellan Oscillator = +167 (-150 is start of the O/S area; around -275 to -300 area or lower, we go into the �launch-pad� mode, over +150, we are in O/B area)
NYSE Breadth Thrust = 58.36 (40 is considered as oversold and 65 as overbought)
WEEKLY Timing Model = on a SELL Signal since Friday 8/7/15 CLOSE (first time in 32 months)
DAILY Timing Model = on a BUY Signal since Tuesday 10/6/15 CLOSE
Max SPX 52wk-highs reading last week = 26 (over 120-140, the local maxima is in)
Max SPX 52wk-Lows reading last week = 7 (over 40-60, the local minima is in)
HA_SP1 = at +1.5 Sigma
HA_Momo = +5.16 (reversals most likely occur above +10 or below -10)
HA_SP2 = 75.0 (Buy signal <= 20, Sell Signal >= 80)
3-mo. VX Futures Spread (long NOV short FEB) = -1.1 (-3 to -2.5 SELL signal, 0 BUY Signal)
SPX SKEW (Tail Risk) = 135 (normal = 120-125, range 100-150)
Our current SPX Bias with Timer Digest: SHORT SPX as of Tuesday, October 6th, 2015 Close at 1979.92
Our previous Bias: FLAT SPX (since Monday, October 5th, 2015 Close at 1987.05)
This WEEK�s Bias = Again, cautiously we are SHORT SPX Complex this week via long Put Spreads as we are seeing a number of divergences. We had expected management guidances in the Earnings Season last week to be a key pressure on equities but AuntieJanet floated a paper Wednesday evening and we rallied on Thursday & Friday. But Fed can pull that trick only so many times. China news should also weigh in.
SPX Profit Target = 1970
SPX Money Management Stop = 2050
BOTTOM LINE: Still we have a tough trading period ahead�. Should we need to throw in the towel & go LONG, I will email all.
NOTE: All LEVELS mentioned here have been, are, and will be, based on the S&P-500 SPX Cash Index, and not the ES Futures. Tomorrow after the first hour is complete, we will post here a companion chart showing critical short-term WEEKLY levels to watch for possible �retest failures.�
Fari Hamzei
|
|
|
|
|
|
Saturday, October 17, 2015 1830CT
Market Timing Charts & Comments

Timer Chart of S&P-500 Cash Index (SPX)
SPX had a channel breakout on Thursday, thanks to AuntieJanet & Co., and continued on Friday OX.
But on Friday NYSE McClellan Osc closed +166 (a divergence with Cash) and it's still short-term overbought.
NYSE Breadth Thrust came in at 58 and also in a divergence with Cash.
Keep an eye on its CI (has positive slope and is still gray (<+10)).
We see the same pattern for NDX, but it's still below its most recent FOMC peak (9/17 at 4,550) with lower readings in McCellan Osc and Breadth Thrust indicators.

Canaries [in the Coal Mine] Chart for DJ TRAN & RUT Indices
What was note worthy on this chart was the move by RUT on Thursday, went from unchg at 1100CT to +2 by the close. Also notice the divergence Friday of DJ TRAN with SPX and look at is CI (about to Cross).
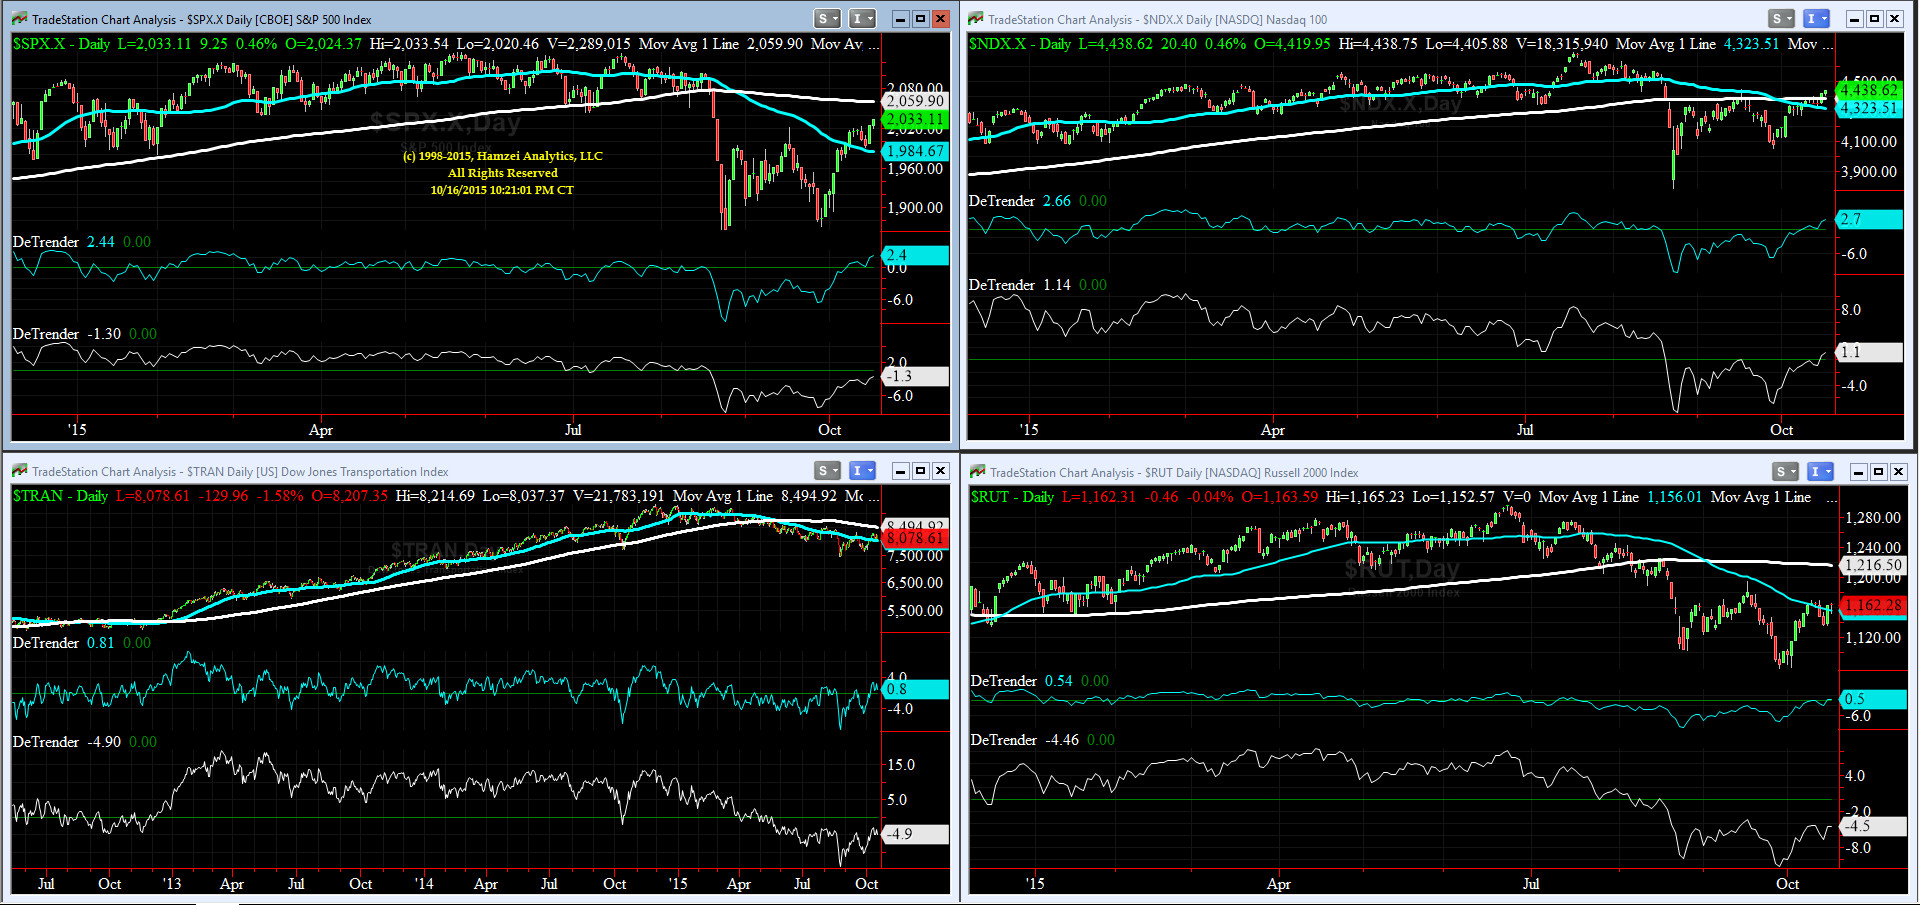
DeTrenders Charts for SPX, NDX, TRAN & RUT Indices
50DTs are positive for all four indices covered here SPX, NDX, DJ TRAN & RUT while only one of our 200DTs is positive (NDX).
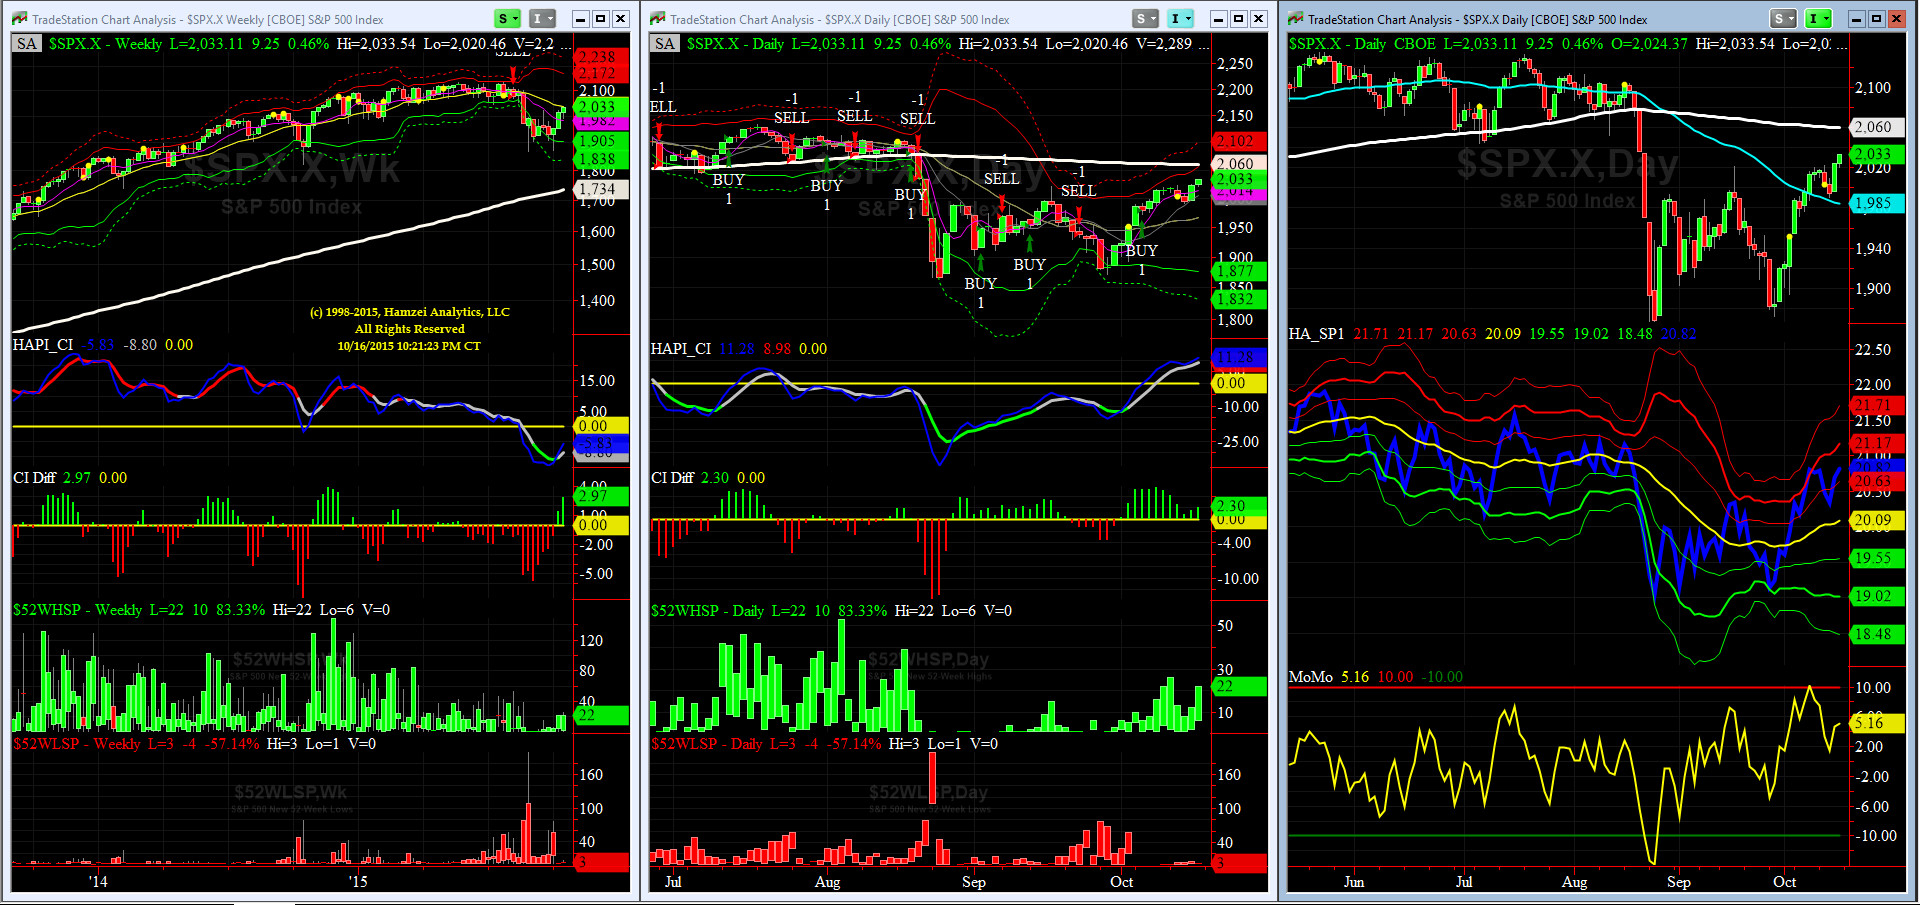
HA_SP1_momo Chart
We are on SELL (WEEKLY Timing Model) & BUY (DAILY Timing Model) as of Tuesday, October 6th. HA_momo, at +5.16, is also in divergence with SPX Cash & HA_SP1.
HA_SP2 Chart
At 75, this prop indicator also in divergence with SPX Cash.
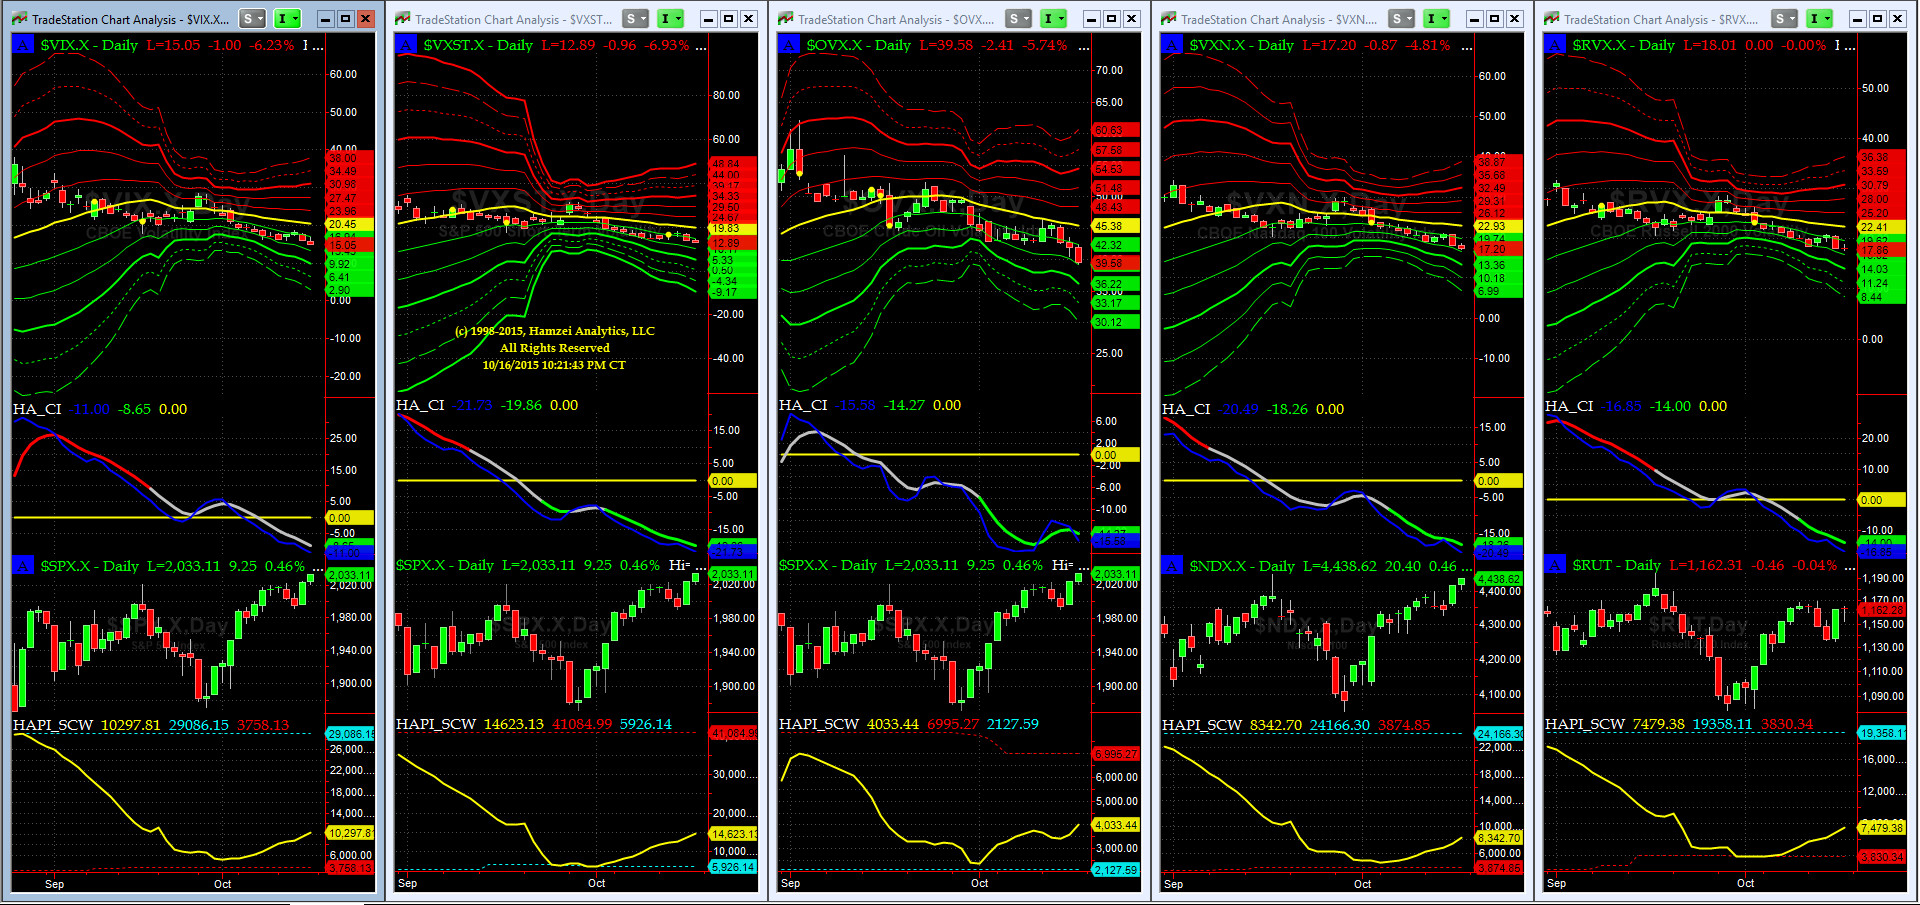
Vol of the Vols Chart
No signal till we get another shockwave (volatility spike). Keep an eye on OVX (Crude Oil Volatility).

5-day TRIN & TRINQ Charts
No signal here.
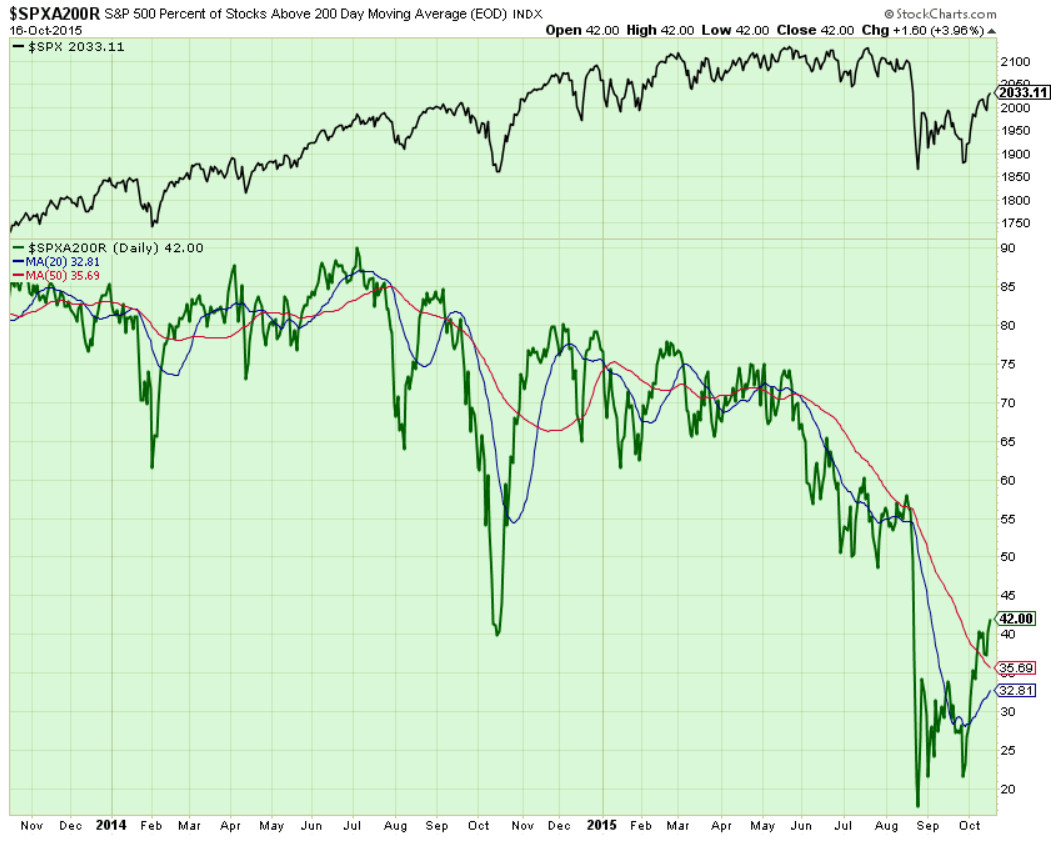
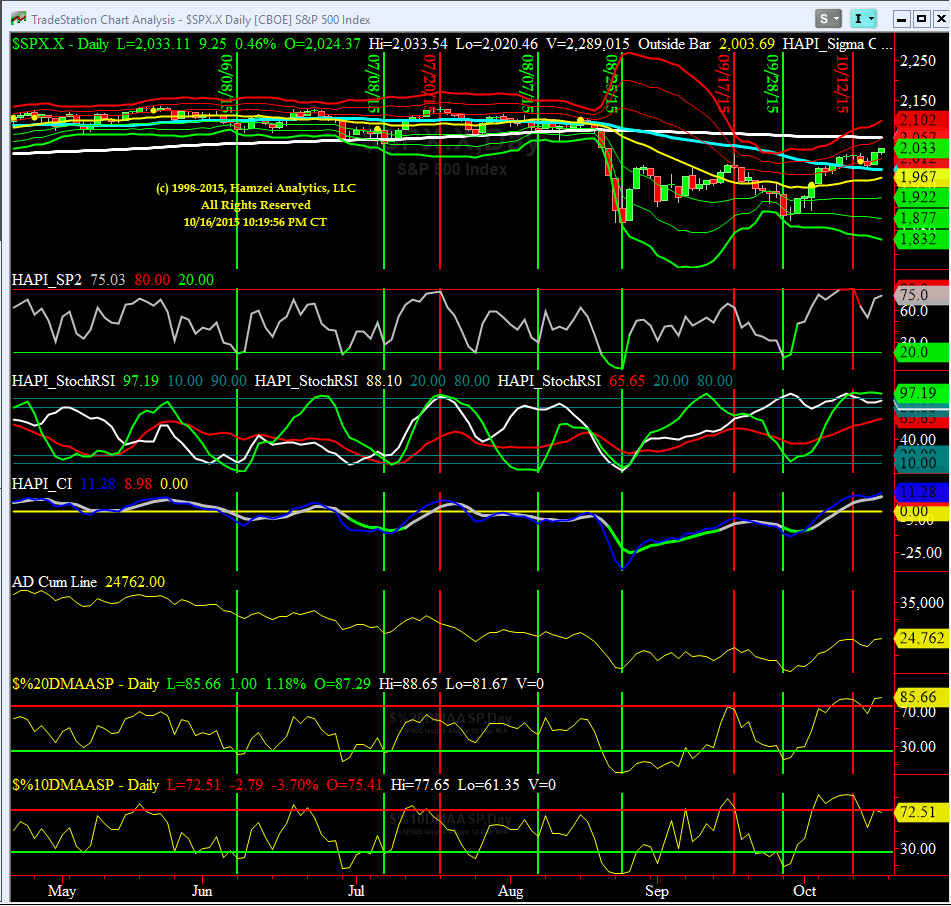
Components of SPX above their respective 200day MA Chart
We punched thru 50 day and continue to move up. The 20-Day should cross 50-Day soon and then the separation between these two MAs will be a tell. Stay tuned sailors.

SPX SKEW (Tail Risk) Chart
After Friday close, SPX SKEW (Tail Risk) went down to a more "normal" value. All Quiet on the Mid-Western Front? Not so fast sailors. This journey has many turns.
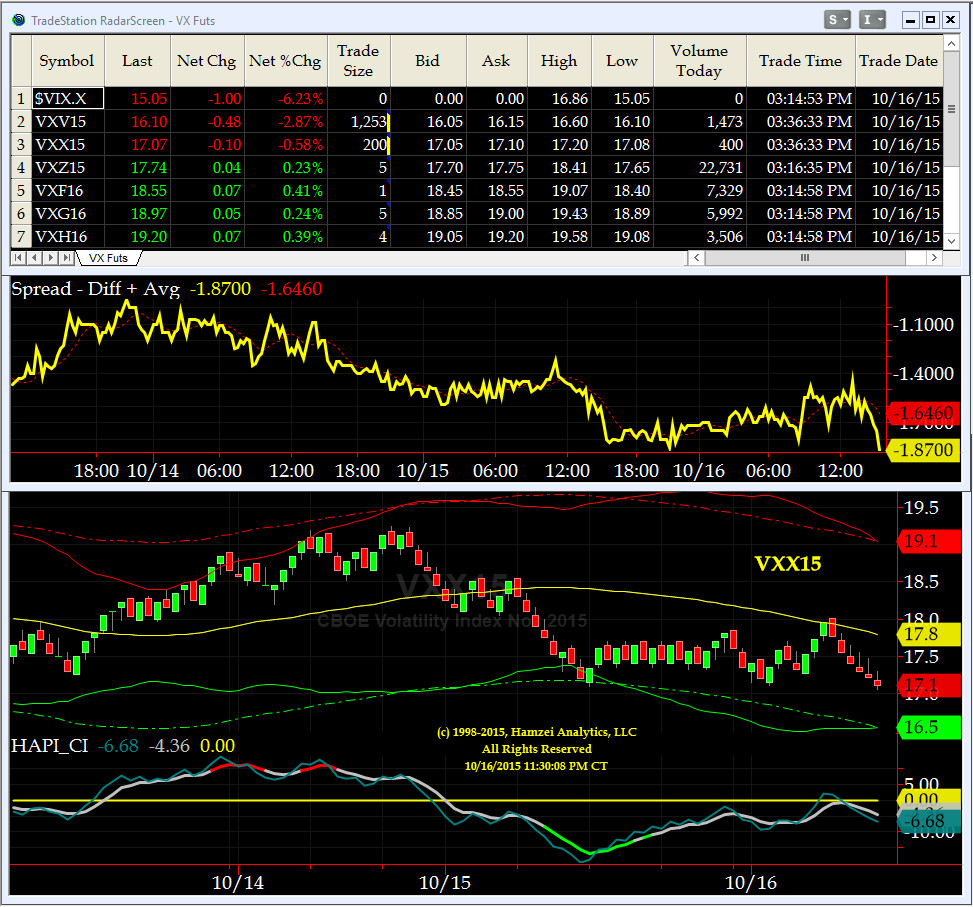
3-month VIX Futures Spread(VX) Chart
This 3-month VIX Futures Spread here is still, we repeat, too high, ioho. This spread, based on historical norms, should be around negative 2.5 to negative 3 here. We interpret that as some of our market participants [the smarter ones] have some worries, even though SPX has rallied for 11 out of last 14 sessions.
Notice in our OTF Chart for the Front Month VX contract, we are using NOV (its volume overtook OCT on Friday), which also has a CI Cross and it is on a SELL as of now.
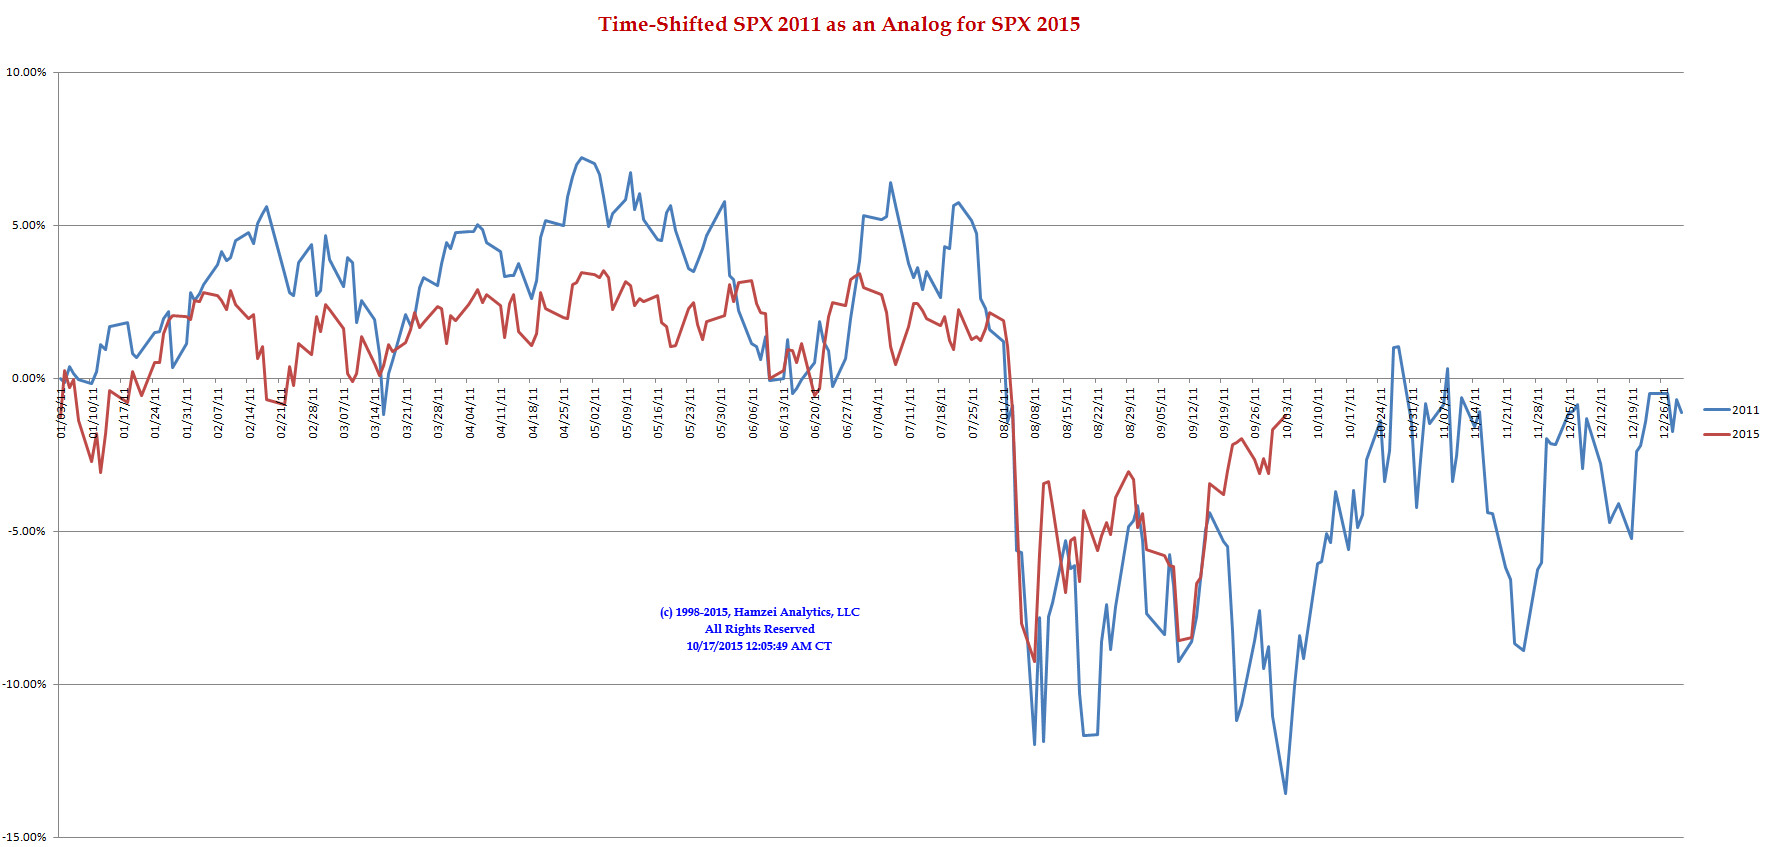
SPX 2011 Time-Shifted Analog for SPX 2015
All great things must come to an end. There is an old saying on Wall Street: "Analogs shall work until they don't." This time-shifted Analog Chart could be on its last throes. Only time will tell.
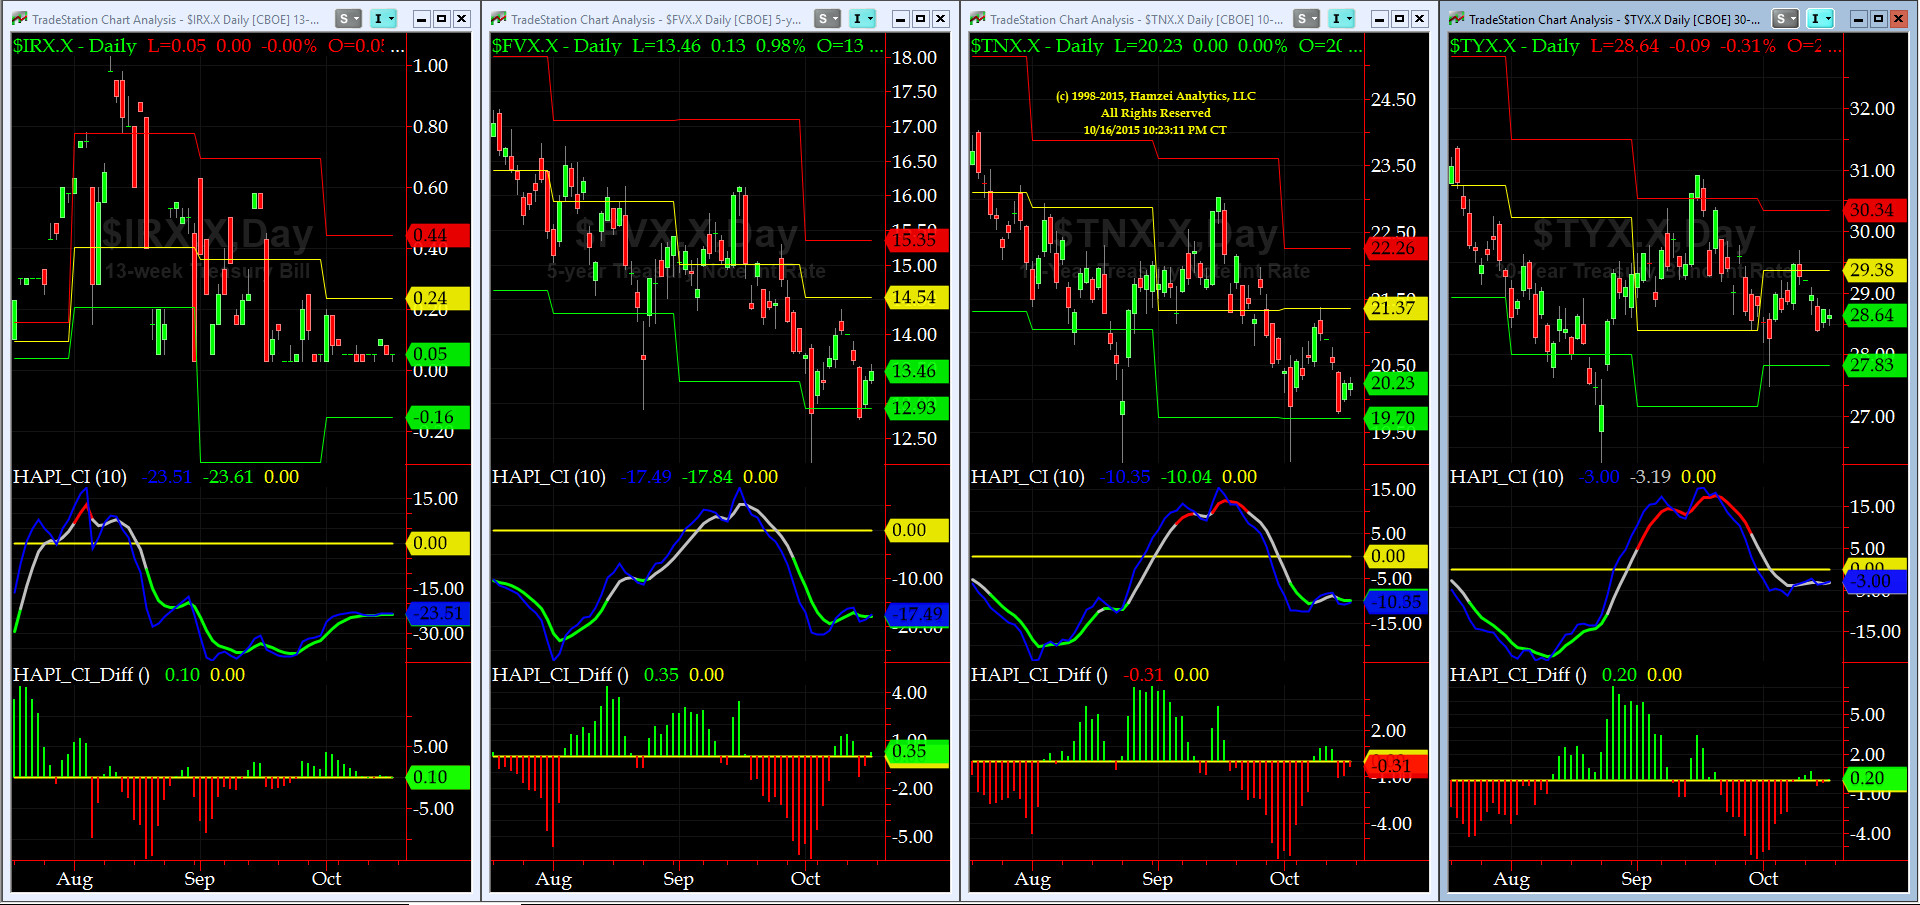
US Treasury T-Notes & T-Bonds Yields Chart
Clearly you can see the Unwind of SHORT SP / LONG TY that started around 1100CT Thursday.
Good luck this week,
Fari Hamzei
|
|
|
|
|
|
Customer Care:
|
|
|
|
|
|
|
 |
 |
|
 |
|
 |
 |
 |
HA YouTube Channel ::: HA Blog ::: Testimonials ::: Tutorials & FAQs ::: Privacy Policy
|
Trading Derivatives (Options & Futures) contains substantial risk and is not for every investor. An investor could potentially lose all or more than his/her initial investment.
Only risk capital should be used for trading and only those with sufficient risk capital should consider trading derivatives. Past performance is not
necessarily indicative of future results. Testimonials appearing on this website may not be representative of other clients or customers
and are not a guarantee of future performance or success.
|
| (c) 1998-2025, Hamzei Analytics, LLC.® All Rights Reserved. |
|
|