
|
 |
 |
 |
 |
 |
 |
 |
 |
 Proactive Market Timing Proactive Market Timing
|
|
|
Most Recent PMT vs SPX Performance Chart

|
|
|
|
Thursday, November 12, 2015, 1915CT
Market Recap
Tonight, after the Close, almost all of our momentum and breadth indicators are ending up in the oversold territory. So, tomorrow is not the right date to short this market. We will review all charts on Saturday and come up with a proper game plan by Sunday.
|
|
|
|
|
|
Wednesday, November 11, 2015, 1945CT
Daily Timing Model Gives a SELL Signal
HA_SP1_momo Chart
Tonight, after the Close, our Daily Timing Model gave a SELL Signal. S&P-500 Cash Index closed at 2075.00, with 200Day MA at ~2064. Tomorrow six members of the Board of Governors & Regional Bank Presidents of Federal Reserve System will speak. We will wait till tomorrow night to make a decision as to hold, or fold, our LONG Bias.
|
|
|
|
|
|
Monday, November 9, 2015, 2200CT
1998 & 2011 Analog Charts Review

SPX 2011 Time-Shifted Analog for SPX 2015
S&P-500 Cash Index should rally for the next few days (our breadth indicators are mildly oversold). Should that come to fruition, then, going forward, the case for 1998 Time-Shifted Analog begging our focus & attention, will become much stronger.
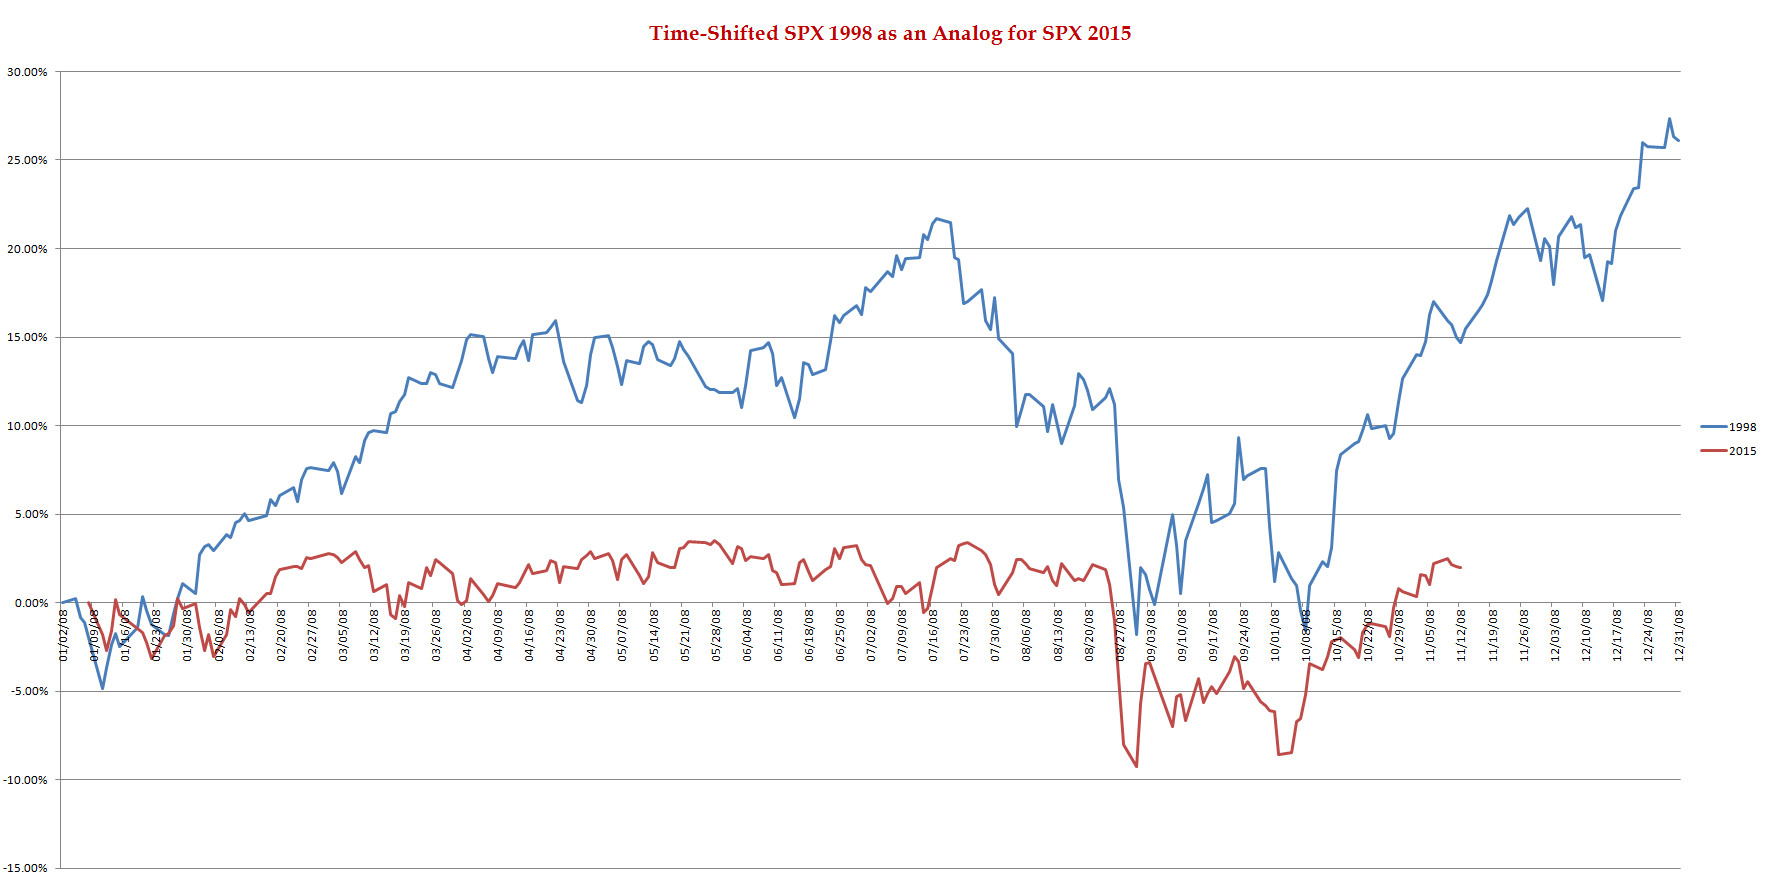
SPX 1998 Time-Shifted Analog for SPX 2015
|
|
|
|
|
|
Monday, November 9, 2015, 0945CT
Companion Chart for Market Bias Review, Issue #118
|
|
|
|
|
|
Sunday Night, November 8, 2015, 2330CT
Market Bias Review, Issue #118
Most recent S&P-500 Cash Index (SPX): 2099.20 up +19.84 (up +0.95%) for the week ending on Friday, November 6th, 2015, which closed at its +1 sigma.
SPX ALL TIME INTRADAY HIGH = 2134.72 (reached on Wednesday, May 20th, 2015)
SPX ALL TIME CLOSING HIGH = 2130.82 (reached on Thursday, May 21st, 2015)
Current DAILY +2 Sigma SPX = 2133 with WEEKLY +2 Sigma = 2166
Current DAILY 0 Sigma (20 day MA) SPX = 2060 with WEEKLY 0 Sigma = 2036
Current DAILY -2 Sigma SPX = 1987 with WEEKLY -2 Sigma = 1906
50-Day MA SPX =1997 or +5.1% below SPX (max observed in last 5 yrs = +8.6%, min = -9.3% )
200-Day MA SPX = 2063 or +1.7% below SPX (max observed in last 5 yrs = 15.2%, min = -14%)
VIX = 14.33 which closed Friday at its -1 sigma (remember it�s the VIX�s vol pattern (its sigma channels) that matters, and not the level of VIX itself (this is per Dr. Robert Whaley, a great mentor and the inventor of original VIX, now called VXO. VIX usually peaks around a test of its +4 sigma))
NYSE McClellan Oscillator = -18 (-150 is start of the O/S area; around -275 to -300 area or lower, we go into the �launch-pad� mode, over +150, we are in O/B area)
NYSE Breadth Thrust = 49.35 (40 is considered as oversold and 65 as overbought)
WEEKLY Timing Model = on a SELL Signal since Friday 8/7/15 CLOSE (first time in 32 months)
DAILY Timing Model = on a BUY Signal since Tuesday 10/6/15 CLOSE
Max SPX 52wk-highs reading last week = 25 (over 120-140, the local maxima is in)
Max SPX 52wk-Lows reading last week = 9 (over 40-60, the local minima is in)
HA_SP1 = just below its +1 Sigma
HA_Momo = -0.56 (reversals most likely occur above +10 or below -10)
HA_SP2 = 64.5(Buy signal <= 20, Sell Signal >= 80)
3-mo. VX Futures Spread (long NOV short FEB) = -2.20 (-3 to -2.5 SELL signal, 0 BUY Signal)
SPX SKEW (Tail Risk) = 138 (normal = 120-125, range 100-150)
Our current SPX Bias with Timer Digest: LONG SPX as of Tuesday, October 20th, 2015 Close at 2030.77
Our previous Bias: SHORT SPX (since Tuesday, October 6th, 2015 Close at 1979.92)
This WEEK�s Bias = Cautiously, LONG SPX Complex via Long Call Spreads.
Profit Target = 2140
Money Management Stop = 2080
BOTTOM LINE: Always watch your bet size, and, no need to be a cowboy.
NOTE: All LEVELS mentioned here have been, are, and will be, based on the S&P-500 SPX Cash Index, and not the ES Futures. Tomorrow after the first hour is complete, we will post here a companion chart showing critical short-term WEEKLY levels to watch for possible �retest failures.�
Fari Hamzei
|
|
|
|
|
|
Sunday, November 8, 2015 2245CT
Market Timing Charts & Comments

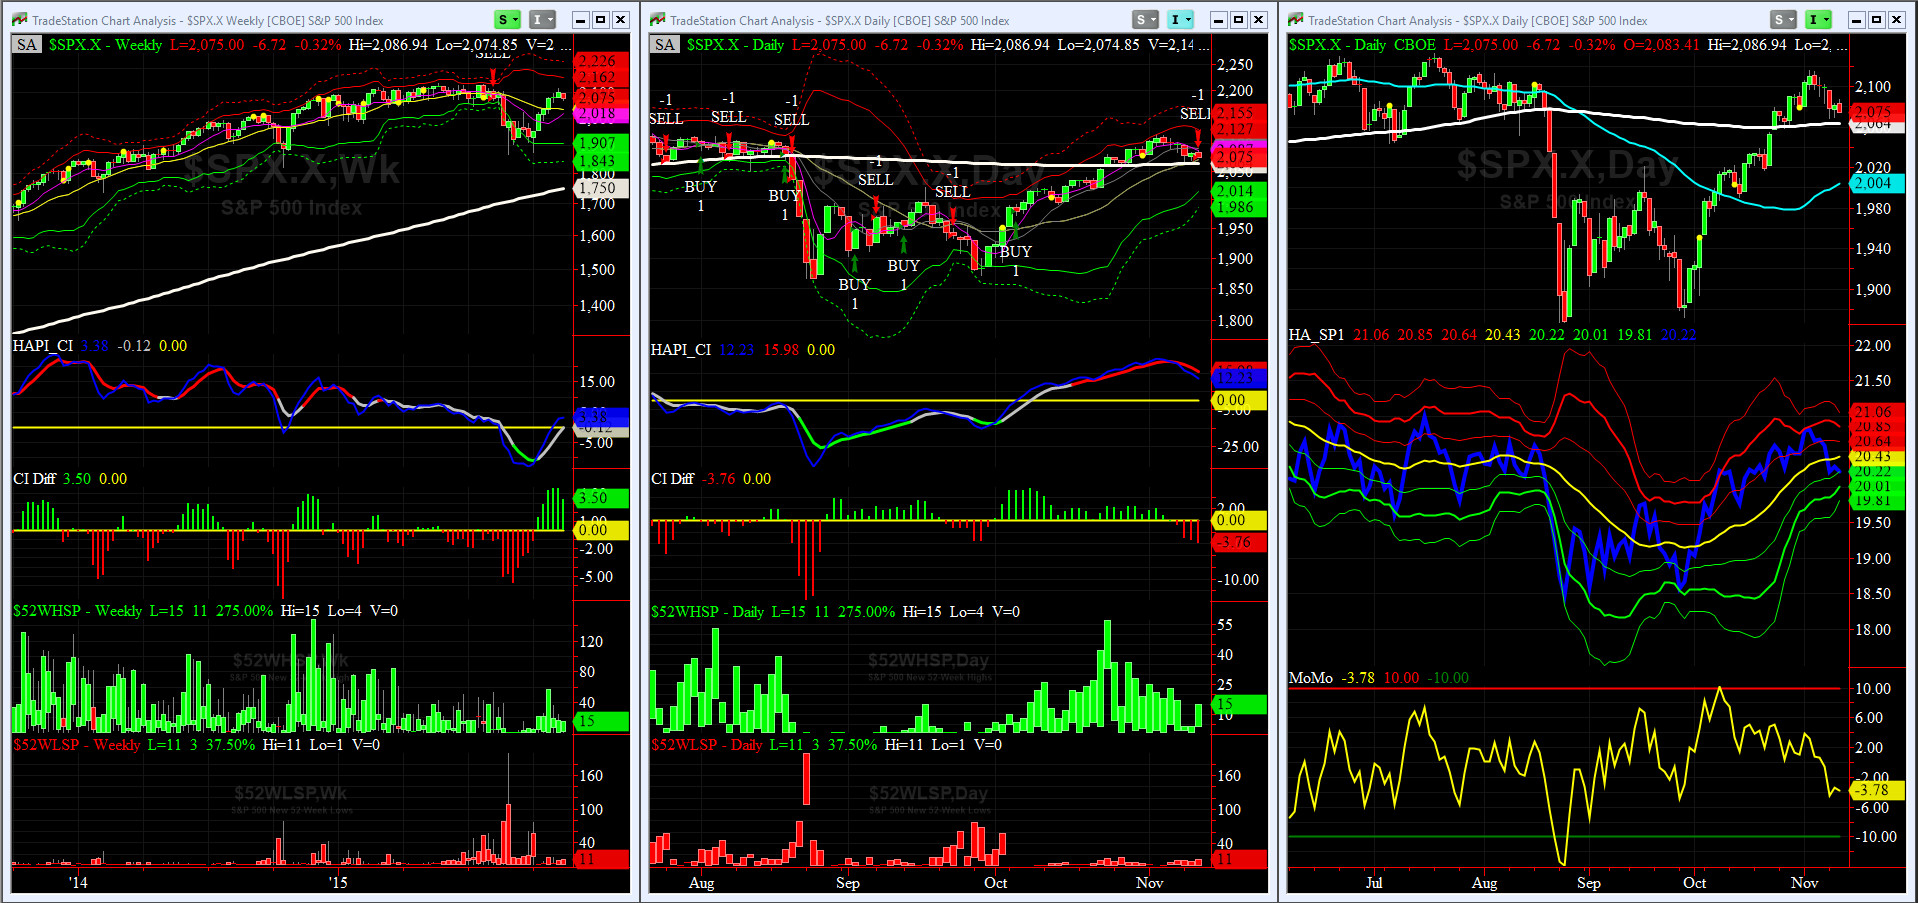
Timer Chart of S&P-500 Cash Index (SPX)
SPX had fairly quiet week after Monday (first trading day of the month). The breadth indicators continued to remain in the middle of the road too. SPX CI slope continued to be positive and color remains RED. And we saw pretty much same pattern for NDX.
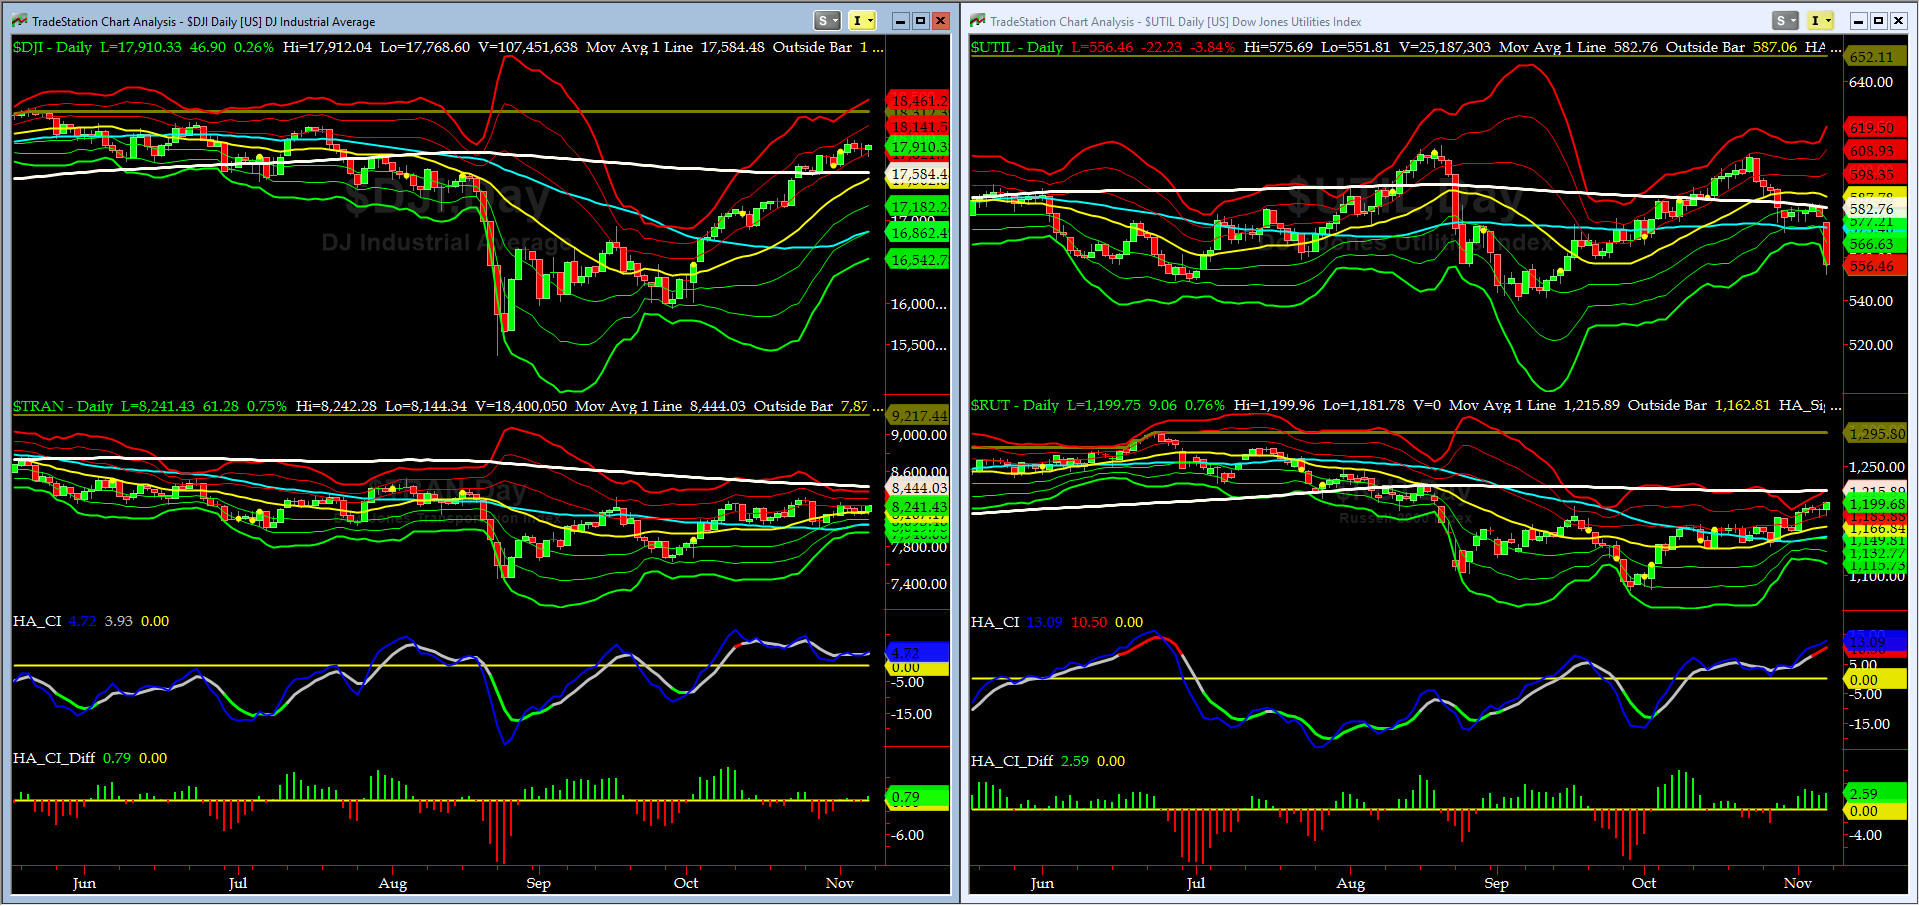
Canaries [in the Coal Mine] Chart for DJ TRAN & RUT Indices
This past week the DJ Transports (proxy for economic conditions 6 to 9 months hence) could not break out but Russell 2000 Small Caps (RUT, a proxy of RISK ON/OFF) continued its break out Monday and then Friday. RISK is ON [till further notice].
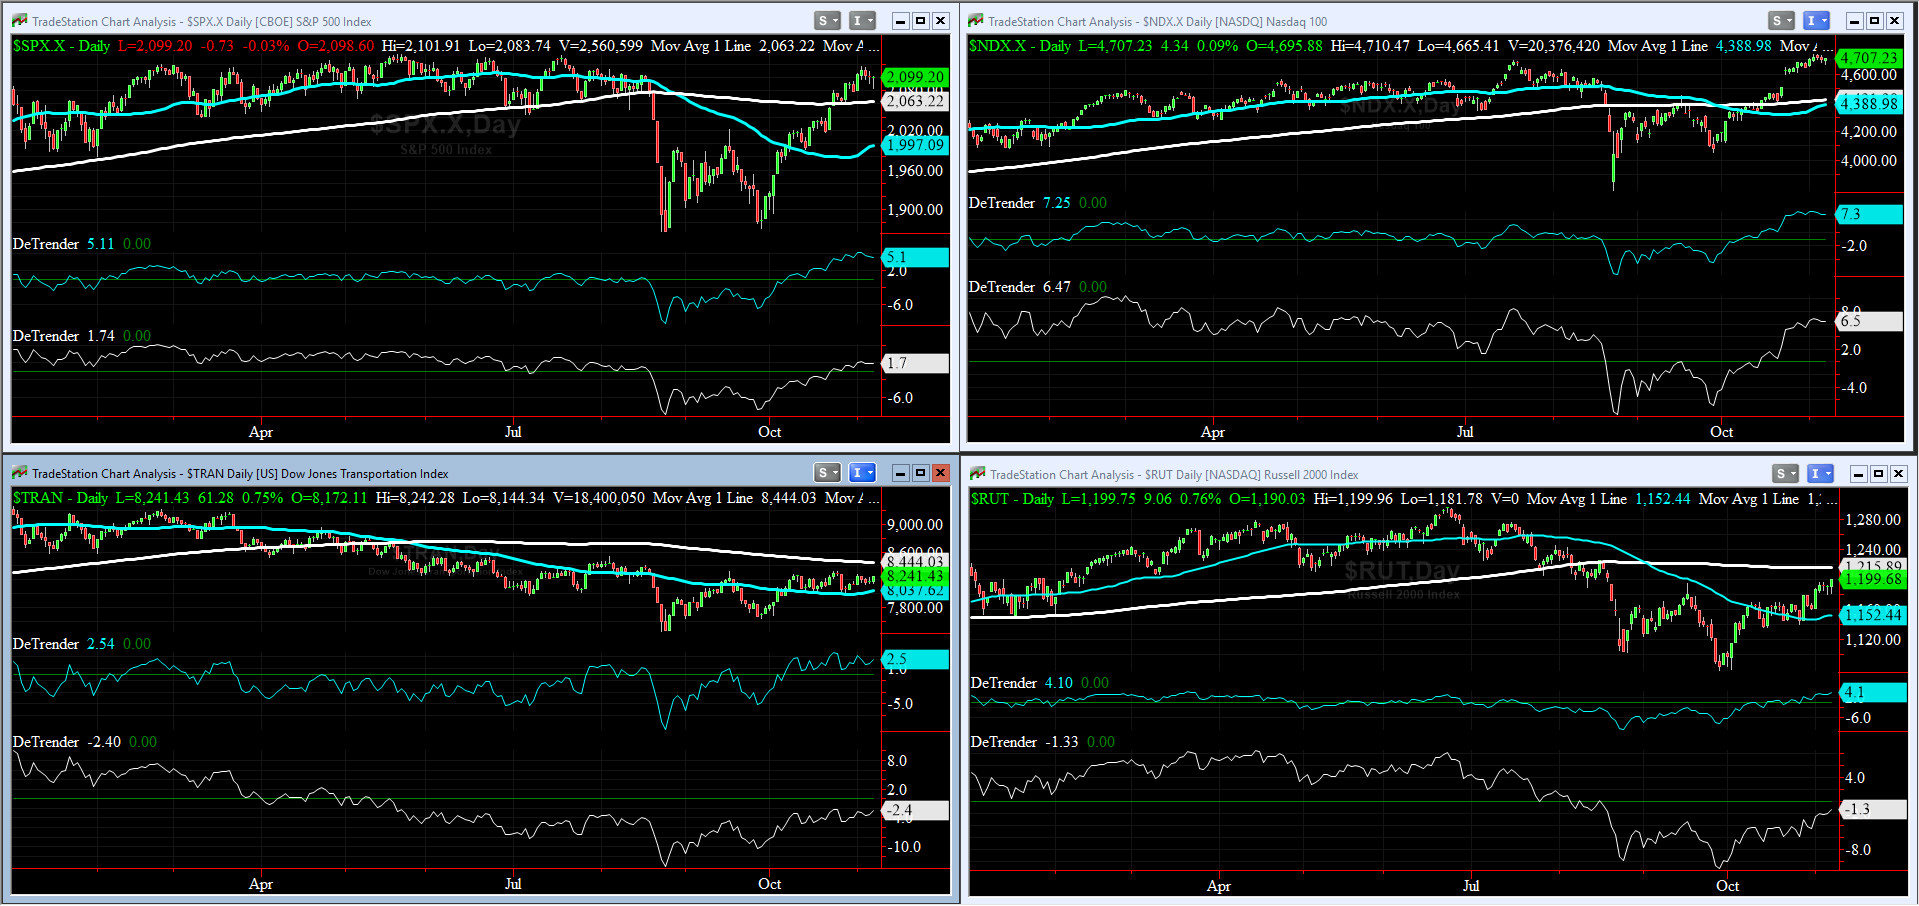
DeTrenders Charts for SPX, NDX, TRAN & RUT Indices
We repeat the same comment from last two weeks: 50DTs are positive for all four indices covered here SPX, NDX, DJ TRAN & RUT, while only two of our 200DTs are positive (SPX & NDX).
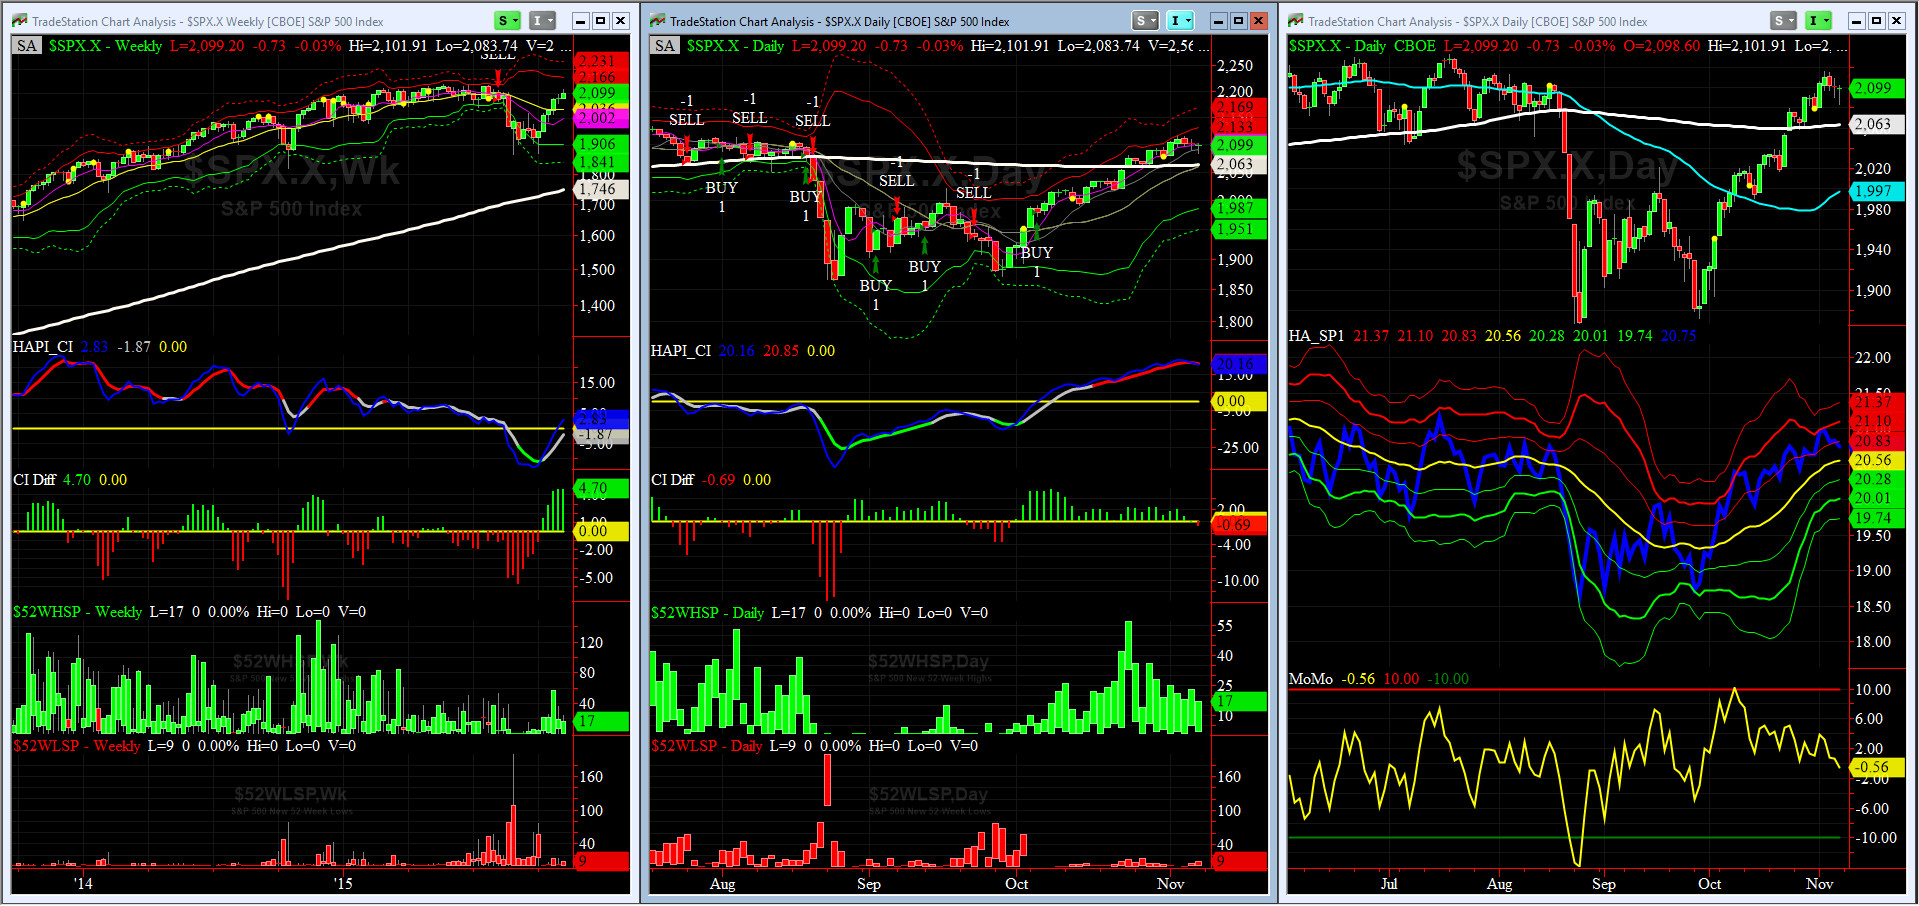
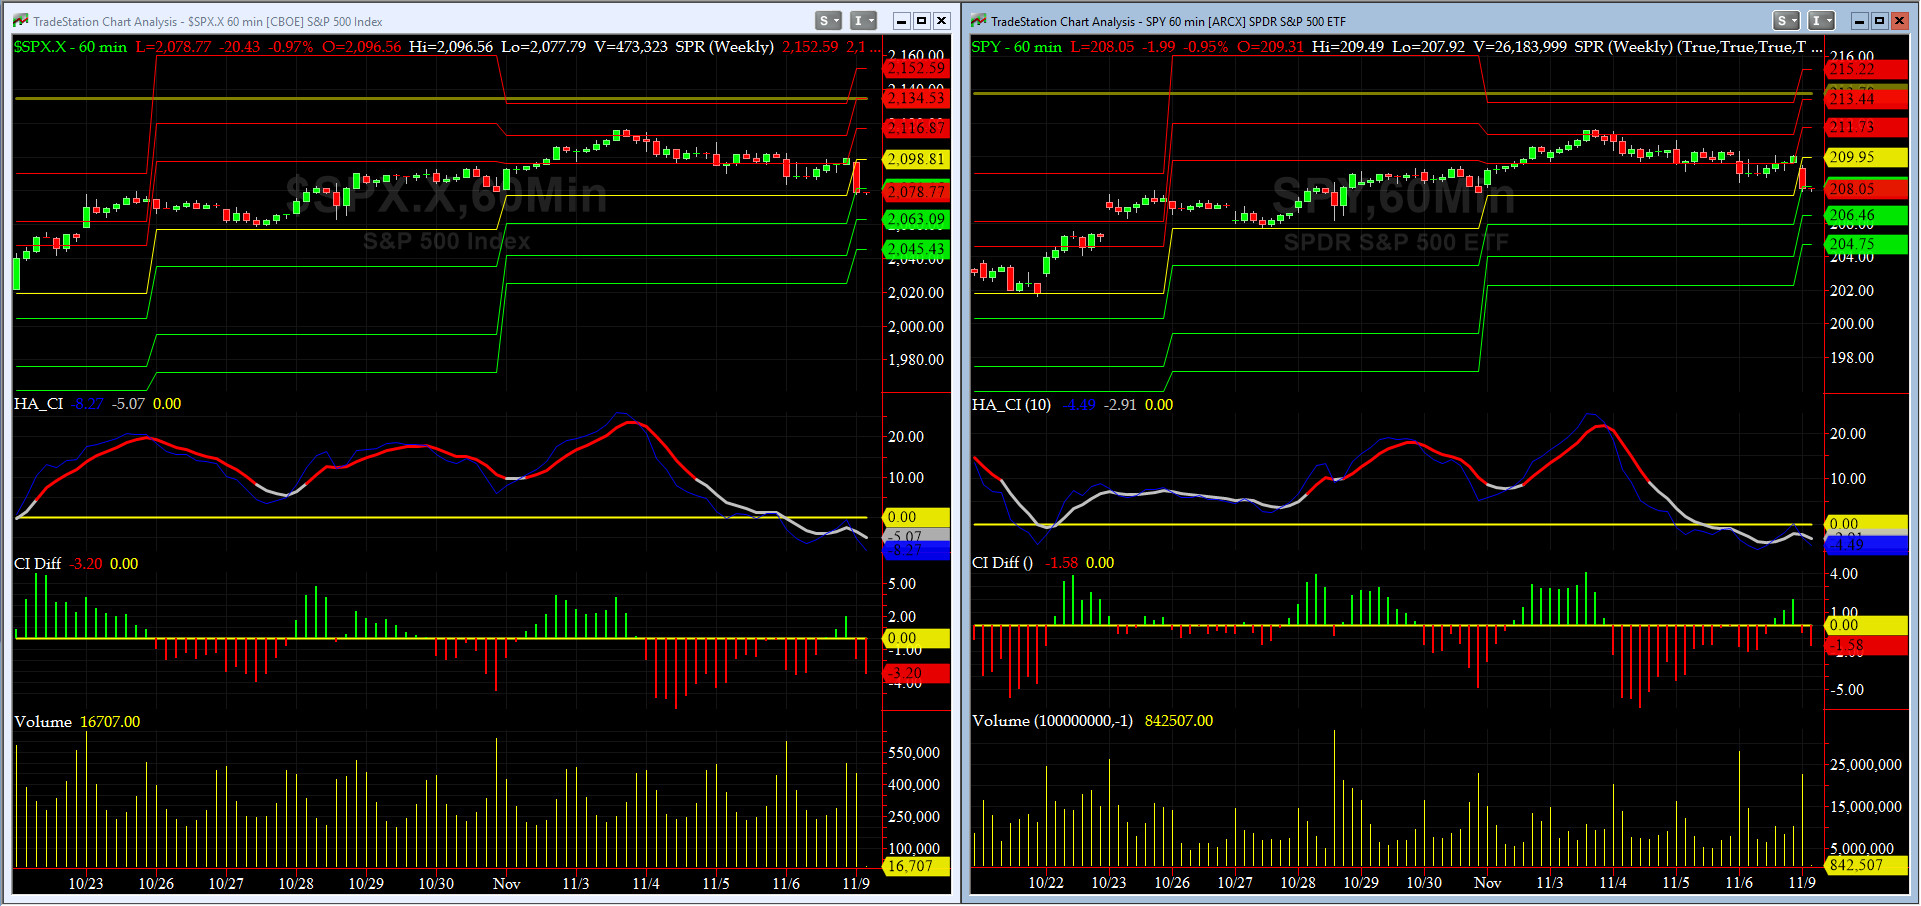
HA_SP1_momo Chart
We are on SELL (WEEKLY Timing Model) as of August 8th, and BUY (DAILY Timing Model) as of Tuesday, October 6th.
HA_momo, at -0.56, is also in divergence with SPX Cash & HA_SP1.
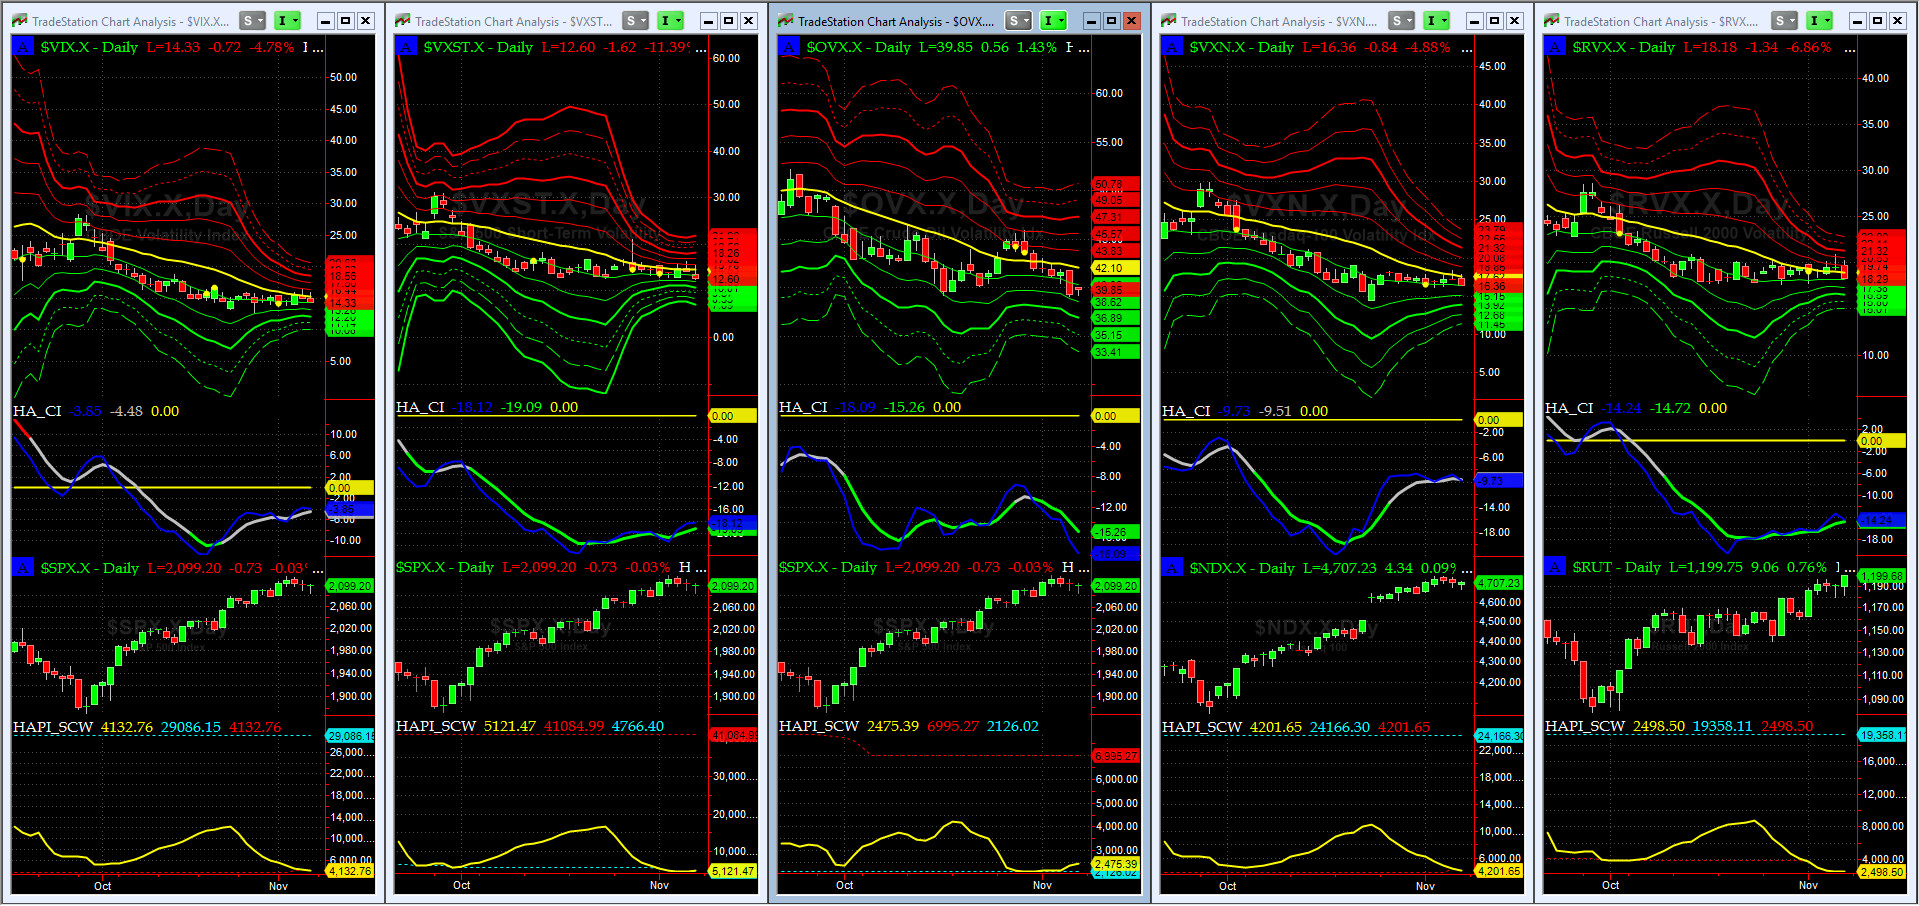
Vol of the Vols Chart
OVX (Crude Oil Volatility) dropped massively this week specially on Thursday. On Friday afternoon our OTF Streamer gave a preliminary buy signal on crude at 44.34 and tonight (Sunday open) the secondary buy signal at 43.99.
Otherwise All Quiet on Mid-Western Front (where VIX is traded)? Yes, at least for now & until the other shoe drops.
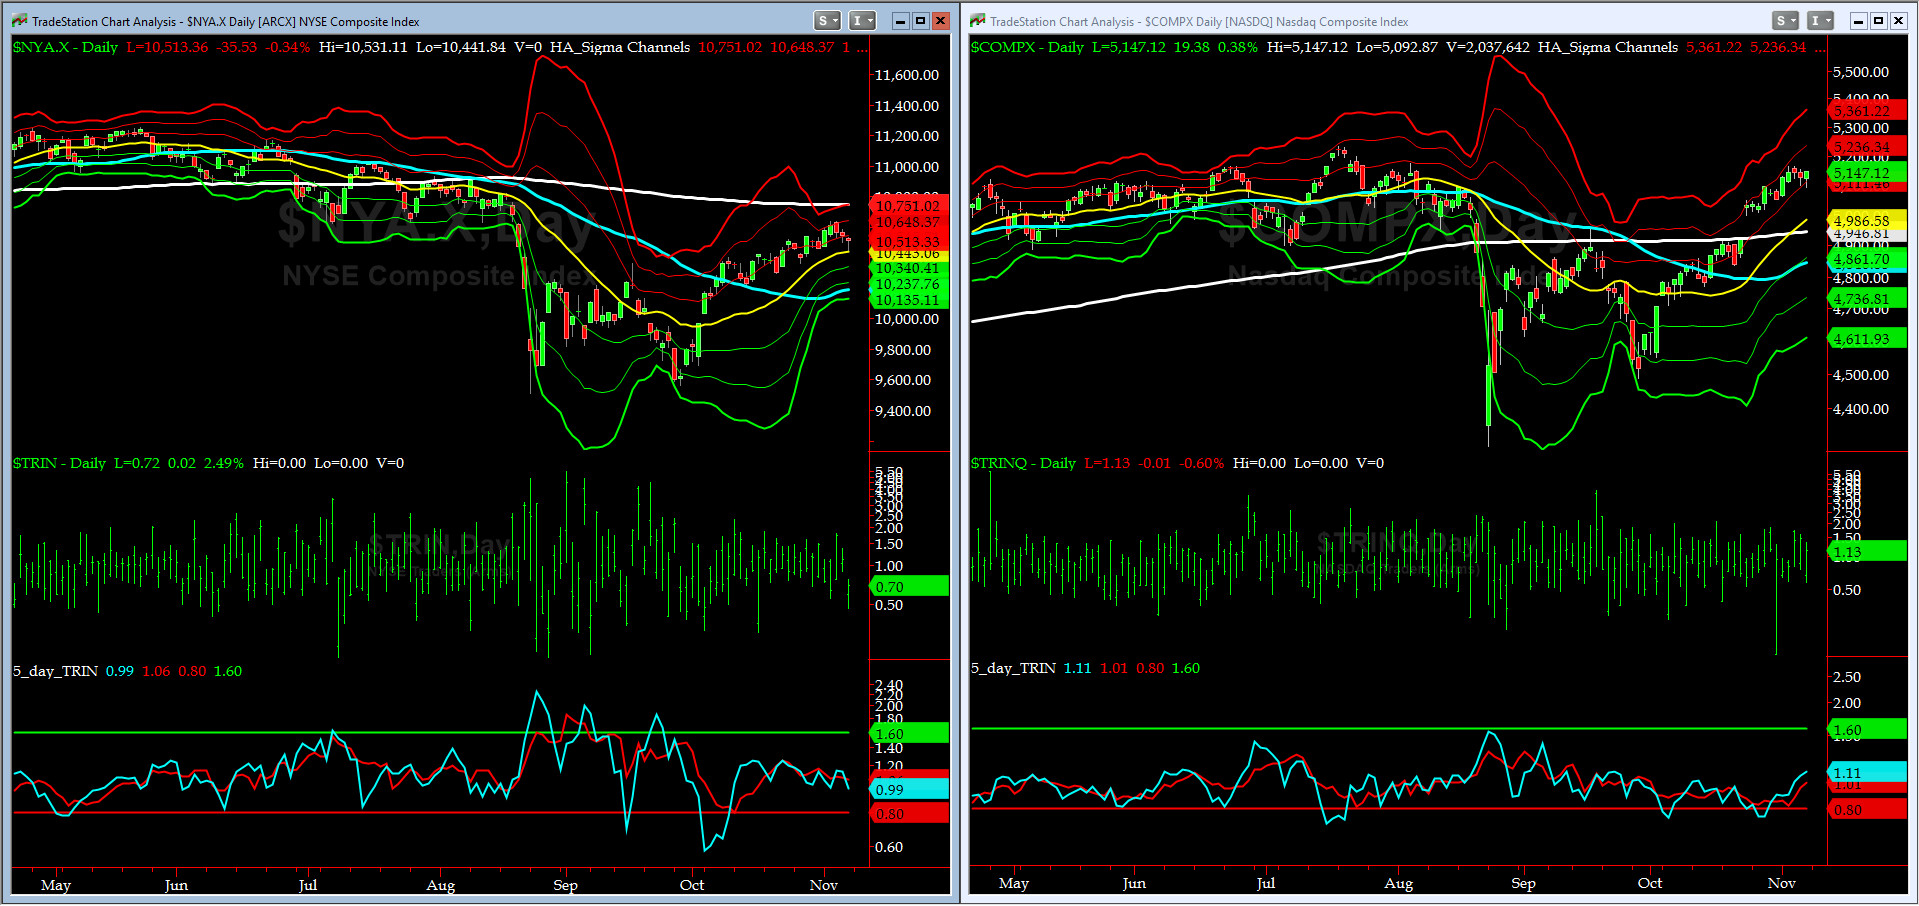
5-day TRIN & TRINQ Charts
No signal on this chart this past week.

Components of SPX above their respective 200day MA Chart
We are at 52.4% now. Next targets are 55% and then at 65% (critical level), we would feel more comfortable about our LONG bias. The 50-Day MA is slowing down a bit. Not a good tell. Stay tuned sailors.
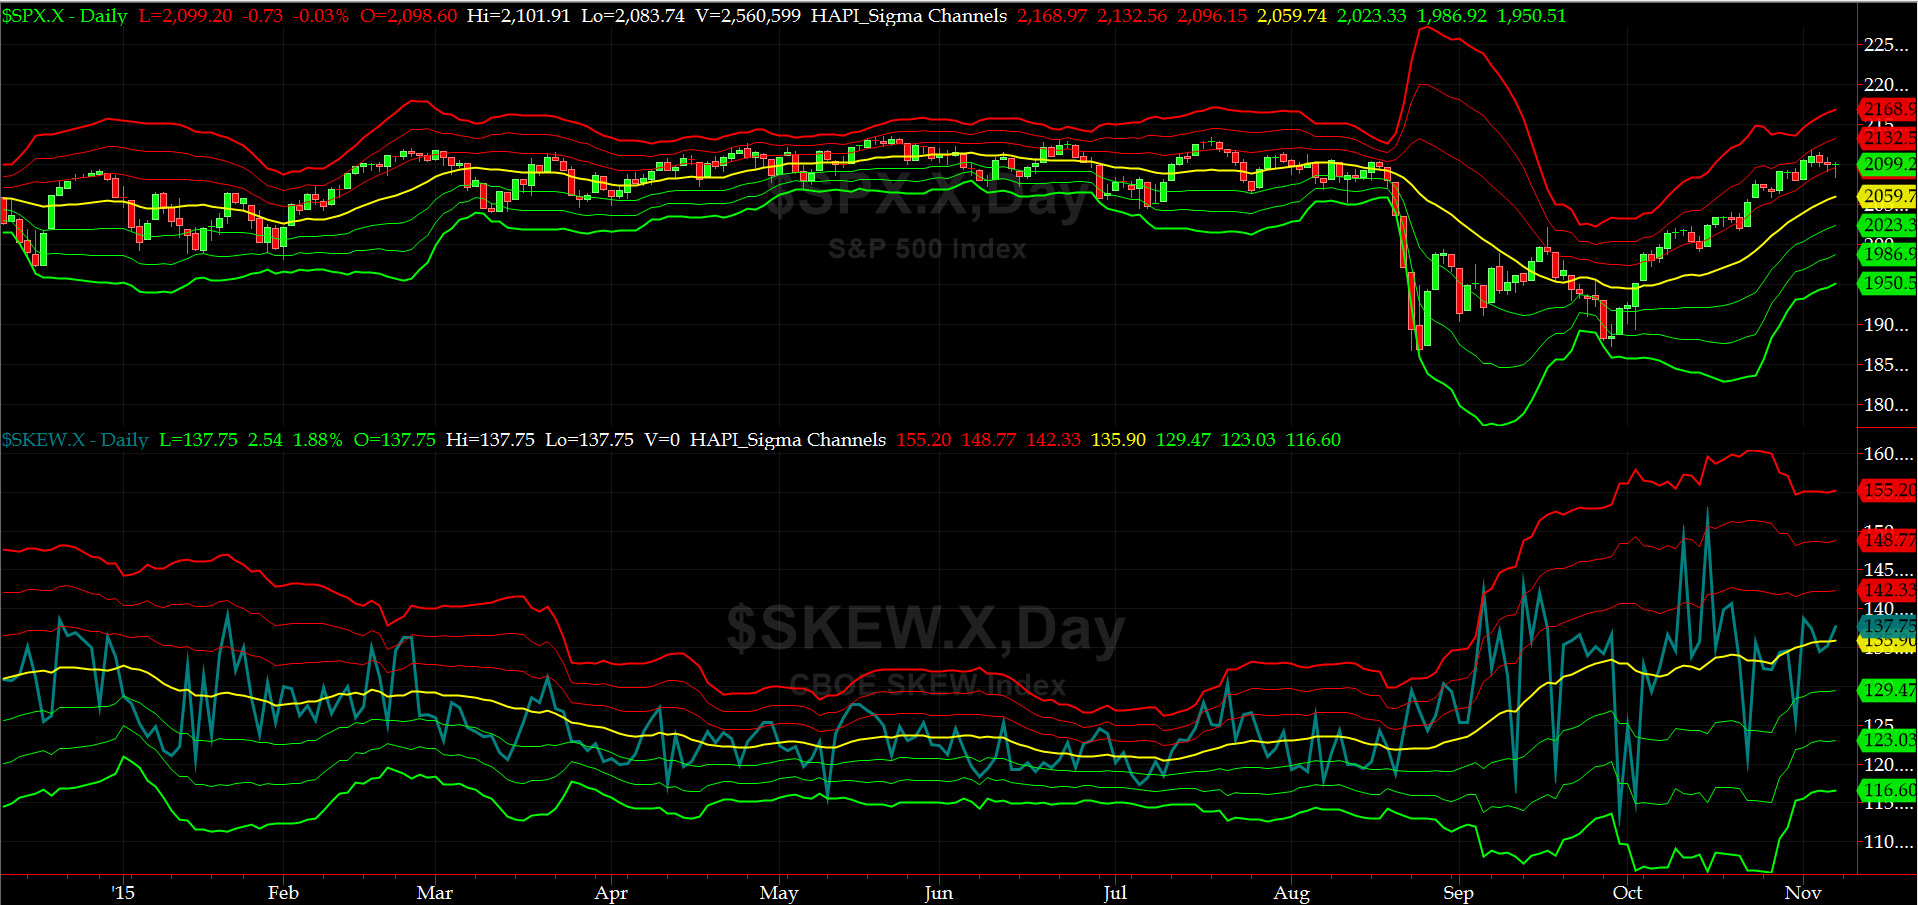
SPX SKEW (Tail Risk) Chart
After Friday close, SPX SKEW (Tail Risk) pitched up to almost 138 with its zero sigma (yellow curve) is rising, at the margin. That is not a good tell either, sailors.
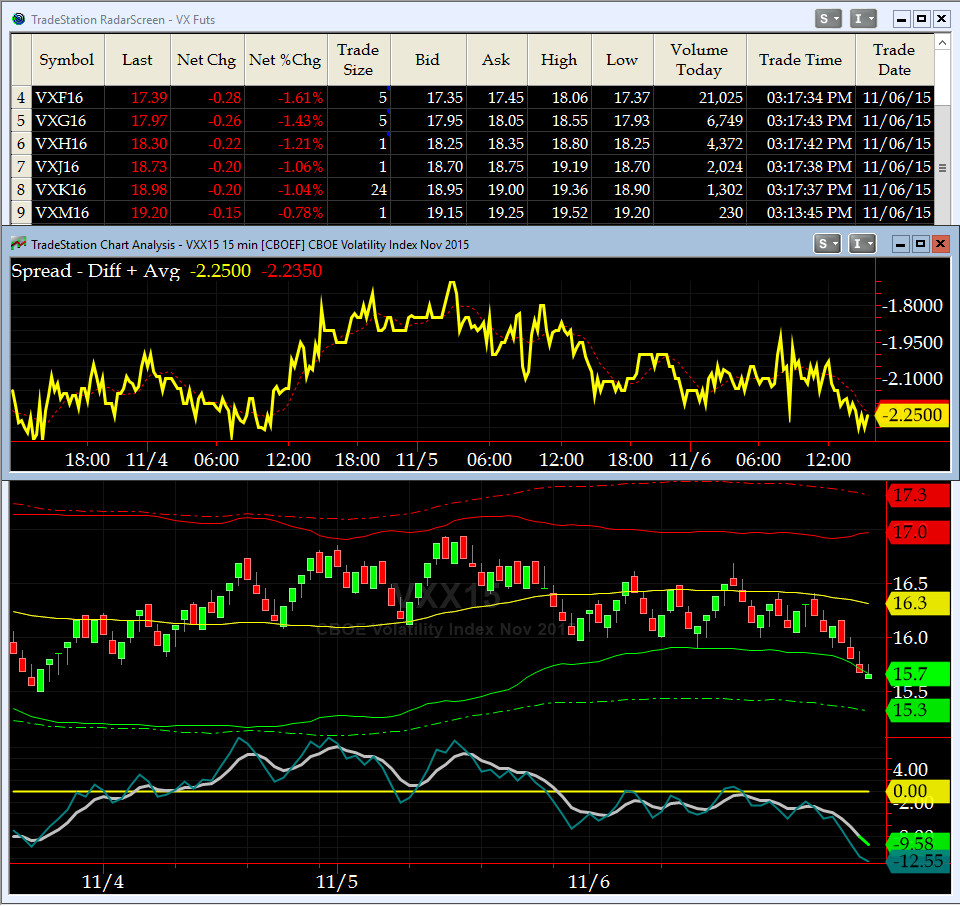
3-month VIX Futures Spread(VX) Chart
Our 3-month VIX Futures Spread, now at -2.24, is still somewhat high, ioho. This spread, based on historical norms, should be around negative 2.5 to negative 3, right here now. We interpret that as some of our market participants [the smarter ones?] STILL have some worries, even though SPX has rallied for 21 out of last 30 sessions.
Note in our OTF Chart (bottom sub-graph), the Front Month VX contract (NOV), via its CI, is on a SELL as of now.

HA_SP2 Chart
At 64.5, this prop indicator is back to divergence with SPX Cash but remaining is less overbought condition.
SPX 2011 Time-Shifted Analog for SPX 2015
We repeat: this week, (this is fish or cut bait week), we shall find out which Analog wins this race. It is a tough call right now.
SPX 1998 Time-Shifted Analog for SPX 2015
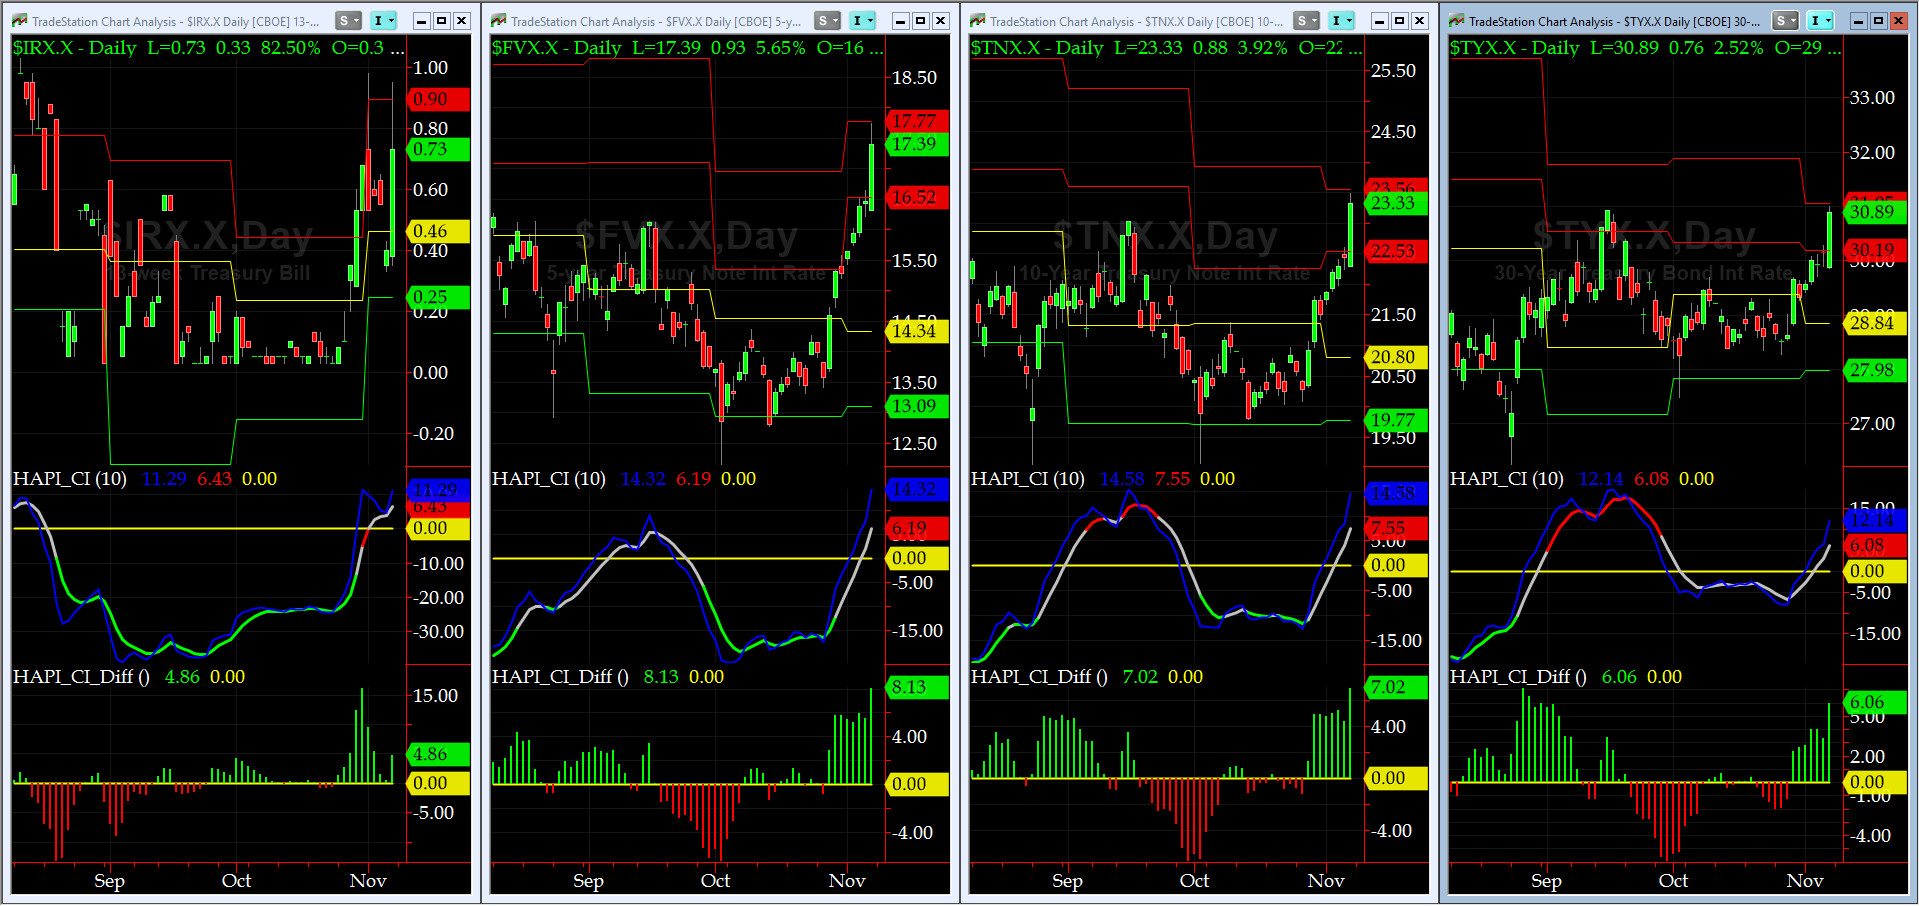
US Treasury T-Notes & T-Bonds Yields Chart
This past week, the YTM on Treasuries again rallied aggressively on the front end, and then slowly, as we walk up the Yield Curve, to their respective MONTHLY Resistance Two Levels.
Good luck this week,
Fari Hamzei
|
|
|
|
|
|
Customer Care:
|
|
|
|
|
|
|
 |
 |
|
 |
|
 |
 |
 |
HA YouTube Channel ::: HA Blog ::: Testimonials ::: Tutorials & FAQs ::: Privacy Policy
|
Trading Derivatives (Options & Futures) contains substantial risk and is not for every investor. An investor could potentially lose all or more than his/her initial investment.
Only risk capital should be used for trading and only those with sufficient risk capital should consider trading derivatives. Past performance is not
necessarily indicative of future results. Testimonials appearing on this website may not be representative of other clients or customers
and are not a guarantee of future performance or success.
|
| (c) 1998-2025, Hamzei Analytics, LLC.® All Rights Reserved. |
|
|