
|
 |
 |
 |
 |
 |
 |
 |
 |
 Proactive Market Timing Proactive Market Timing
|
|
|
Most Recent PMT vs SPX Performance Chart

|
|
|
|
Wednesday, November 18, 2015, 1830CT
Our next SPX Profit Target is 2,100 - we may see that this week - most likely Tomorrow or Monday...
|
|
|
|
|
|
Tuesday, November 17, 2015, 2230CT
Updated 2011 Analog Chart
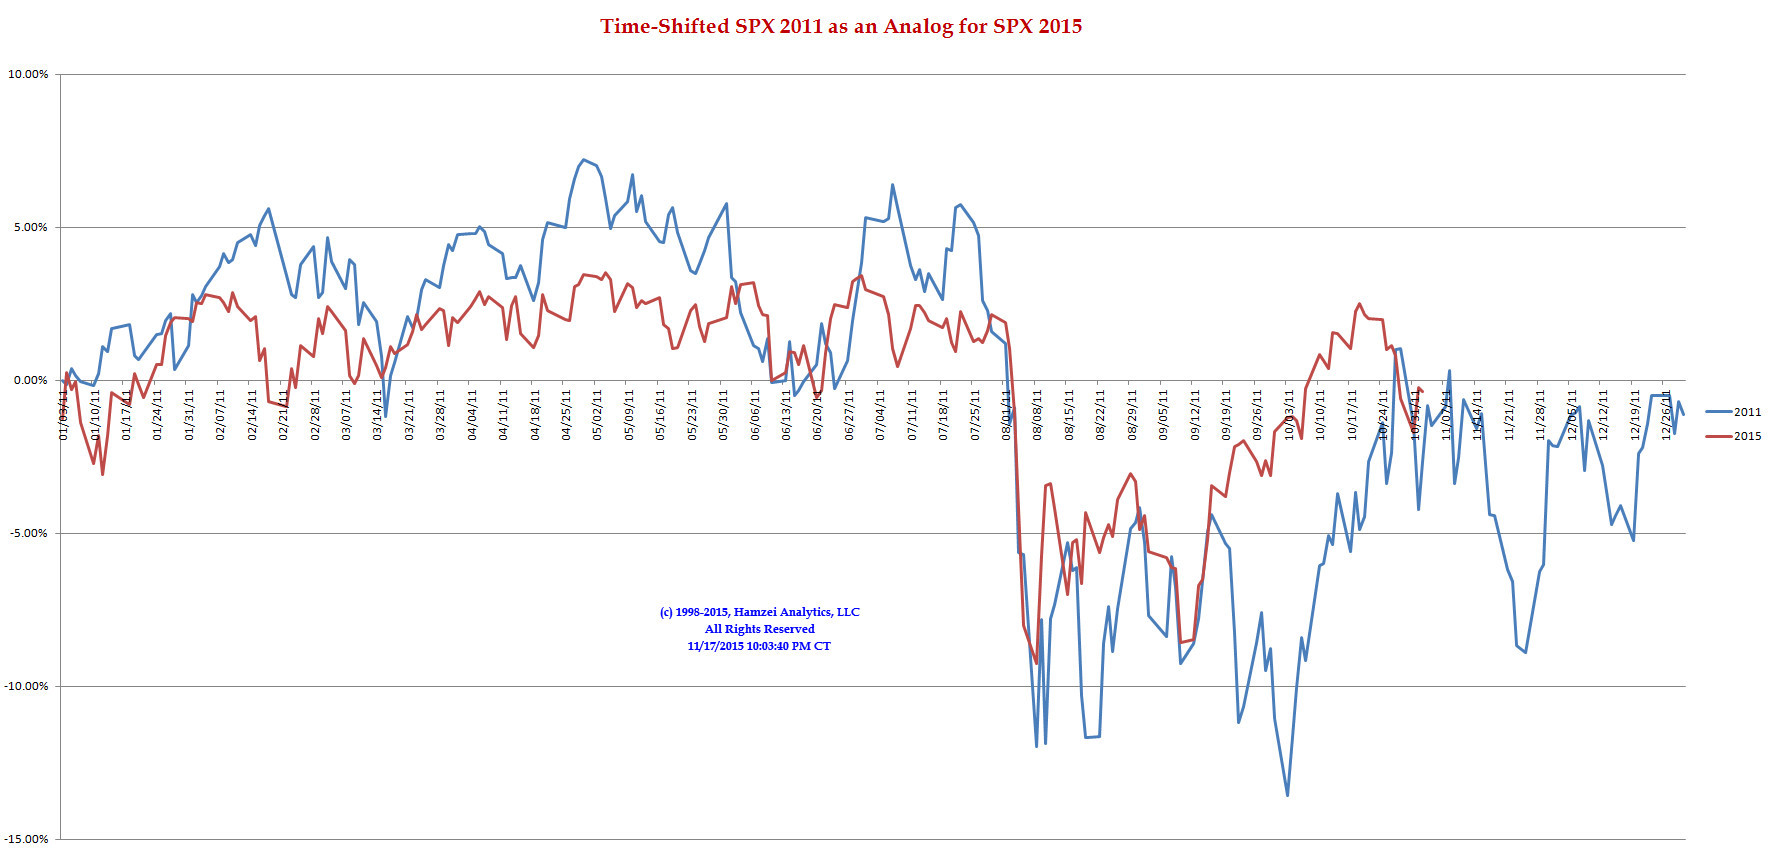
SPX 2011 Time-Shifted Analog for SPX 2015
We expect S&P-500 Cash Index to go sideways for another week, or so. Then, once we get past Thanksgiving Week, we expect a pullback that should gather speed, dropping into middle of 2nd week of December. Size? about 7% to 8% from where we are now. Of course, our other prop indicators must also confirm such a move. Sailors, stock up on tea.
|
|
|
|
|
|
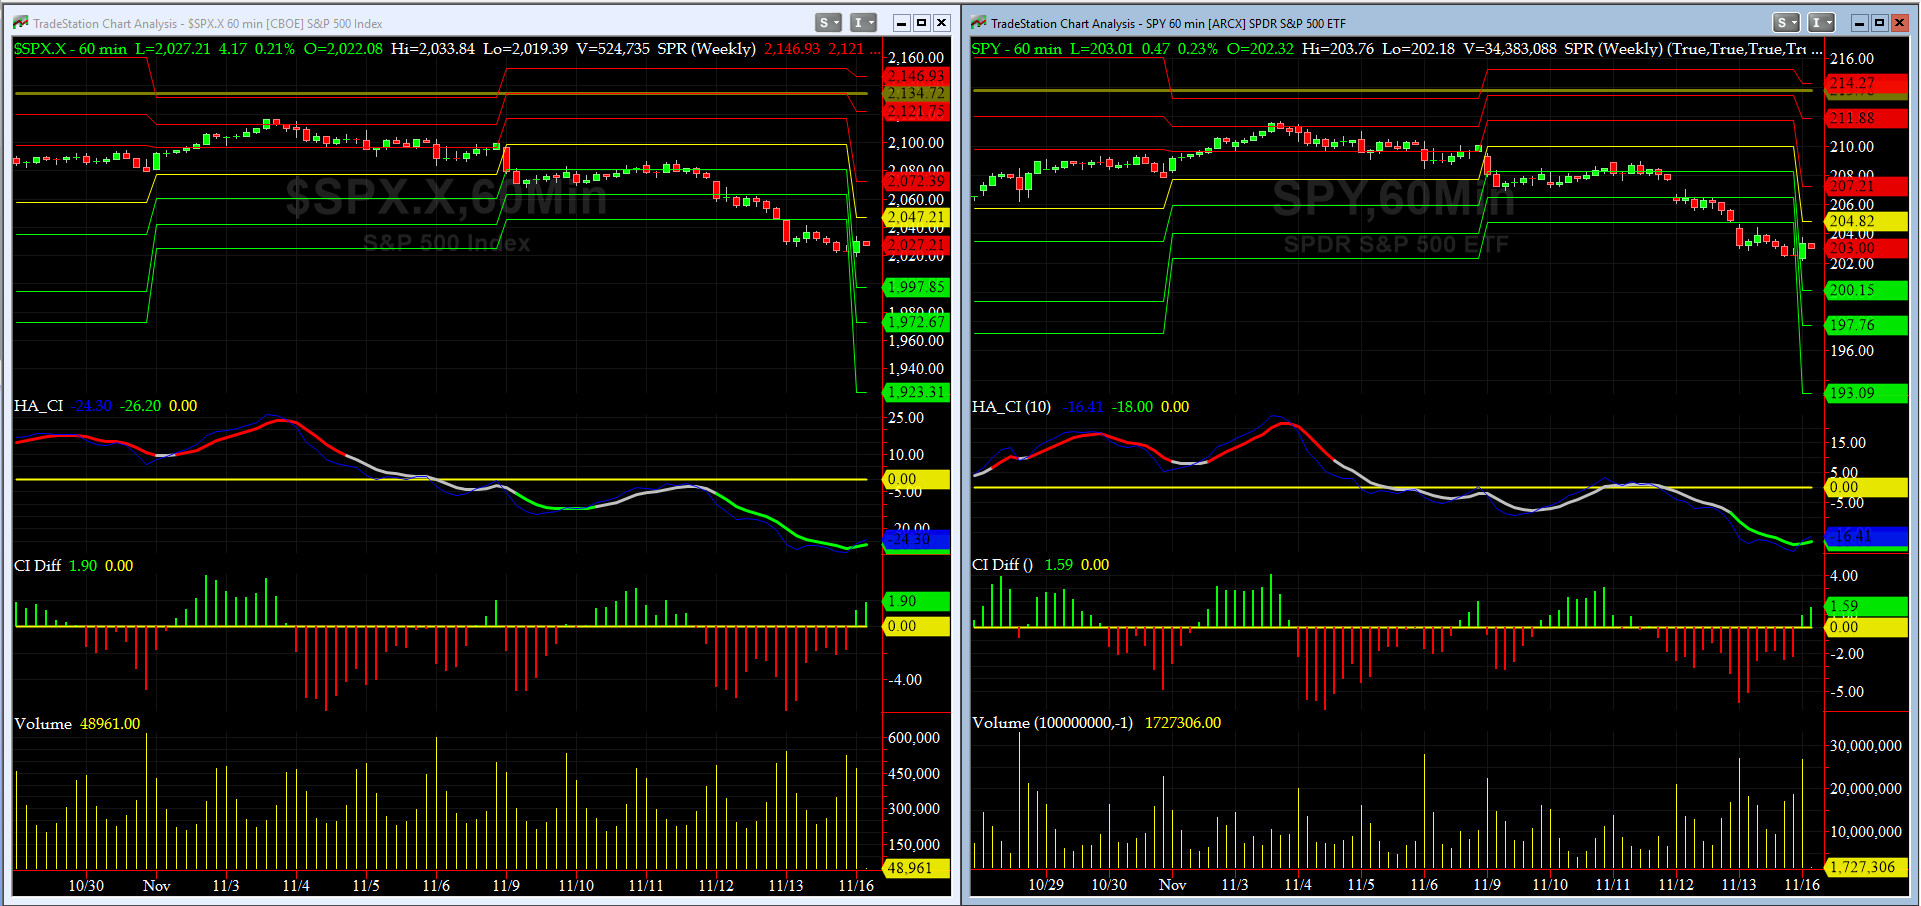
Monday, November 16, 2015, 0945CT
Companion Chart for Market Bias Review, Issue #119
|
|
|
|
|
|
Sunday Night, November 15, 2015, 2330CT
Market Bias Review, Issue #119
Most recent S&P-500 Cash Index (SPX): 2023.04 down 76.16 (down -3.63%) for the week ending on Friday, November 13th, 2015, which closed near its -2 sigma.
SPX ALL TIME INTRADAY HIGH = 2134.72 (reached on Wednesday, May 20th, 2015)
SPX ALL TIME CLOSING HIGH = 2130.82 (reached on Thursday, May 21st, 2015)
Current DAILY +2 Sigma SPX = 2126 with WEEKLY +2 Sigma = 2159
Current DAILY 0 Sigma (20 day MA) SPX = 2071 with WEEKLY 0 Sigma = 2032
Current DAILY -2 Sigma SPX = 2016 with WEEKLY -2 Sigma = 1906
50-Day MA SPX =2008 or +0.8% below SPX (max observed in last 5 yrs = +8.6%, min = -9.3% )
200-Day MA SPX = 2064 or -2.0% above SPX (max observed in last 5 yrs = 15.2%, min = -14%)
VIX = 20.08 which closed Friday above its +3 sigma (remember it�s the VIX�s vol pattern (its sigma channels) that matters, and not the level of VIX itself (this is per Dr. Robert Whaley, a great mentor and the inventor of original VIX, now called VXO. VIX usually peaks around a test of its +4 sigma))
NYSE McClellan Oscillator = -202 (-150 is start of the O/S area; around -275 to -300 area or lower, we go into the �launch-pad� mode, over +150, we are in O/B area)
NYSE Breadth Thrust = 37.7 (40 is considered as oversold and 65 as overbought)
WEEKLY Timing Model = on a SELL Signal since Friday 8/7/15 CLOSE (first time in 32 months)
DAILY Timing Model = on a SELL Signal since Tuesday 10/13/15 CLOSE
Max SPX 52wk-highs reading last week = 15 (over 120-140, the local maxima is in)
Max SPX 52wk-Lows reading last week = 36 (over 40-60, the local minima is in)
HA_SP1 = near its -3 Sigma
HA_Momo = -9.22 (reversals most likely occur above +10 or below -10)
HA_SP2 = 13.5(Buy signal <= 20, Sell Signal >= 80)
3-mo. VX Futures Spread (long NOV short FEB) = +0.5 (-3 to -2.5 SELL signal, 0 BUY Signal)
SPX SKEW (Tail Risk) = 139.5 (normal = 120-125, range 100-150)
Our current SPX Bias with Timer Digest: LONG SPX as of Tuesday, October 20th, 2015 Close at 2030.77
Our previous Bias: SHORT SPX (since Tuesday, October 6th, 2015 Close at 1979.92)
This WEEK�s Bias = Cautiously, LONG SPX Complex via Long Call Spreads.
Profit Target = 2065
Money Management Stop = 2010
BOTTOM LINE: Almost by all measures, we are short-term oversold. Next few days will be crucial. You can have an update from us, at any time, in the next four trading days. In the Navy, we call that 'Alert Five.' This means: you must be in your cockpit, ready to take off for a strike mission, in five minutes or less!
NOTE: All LEVELS mentioned here have been, are, and will be, based on the S&P-500 SPX Cash Index, and not the ES Futures. Tomorrow after the first hour is complete, we will post here a companion chart showing critical short-term WEEKLY levels to watch for possible �retest failures.�
Fari Hamzei
|
|
|
|
|
|
Sunday, November 15, 2015 2130CT
Market Timing Charts & Comments
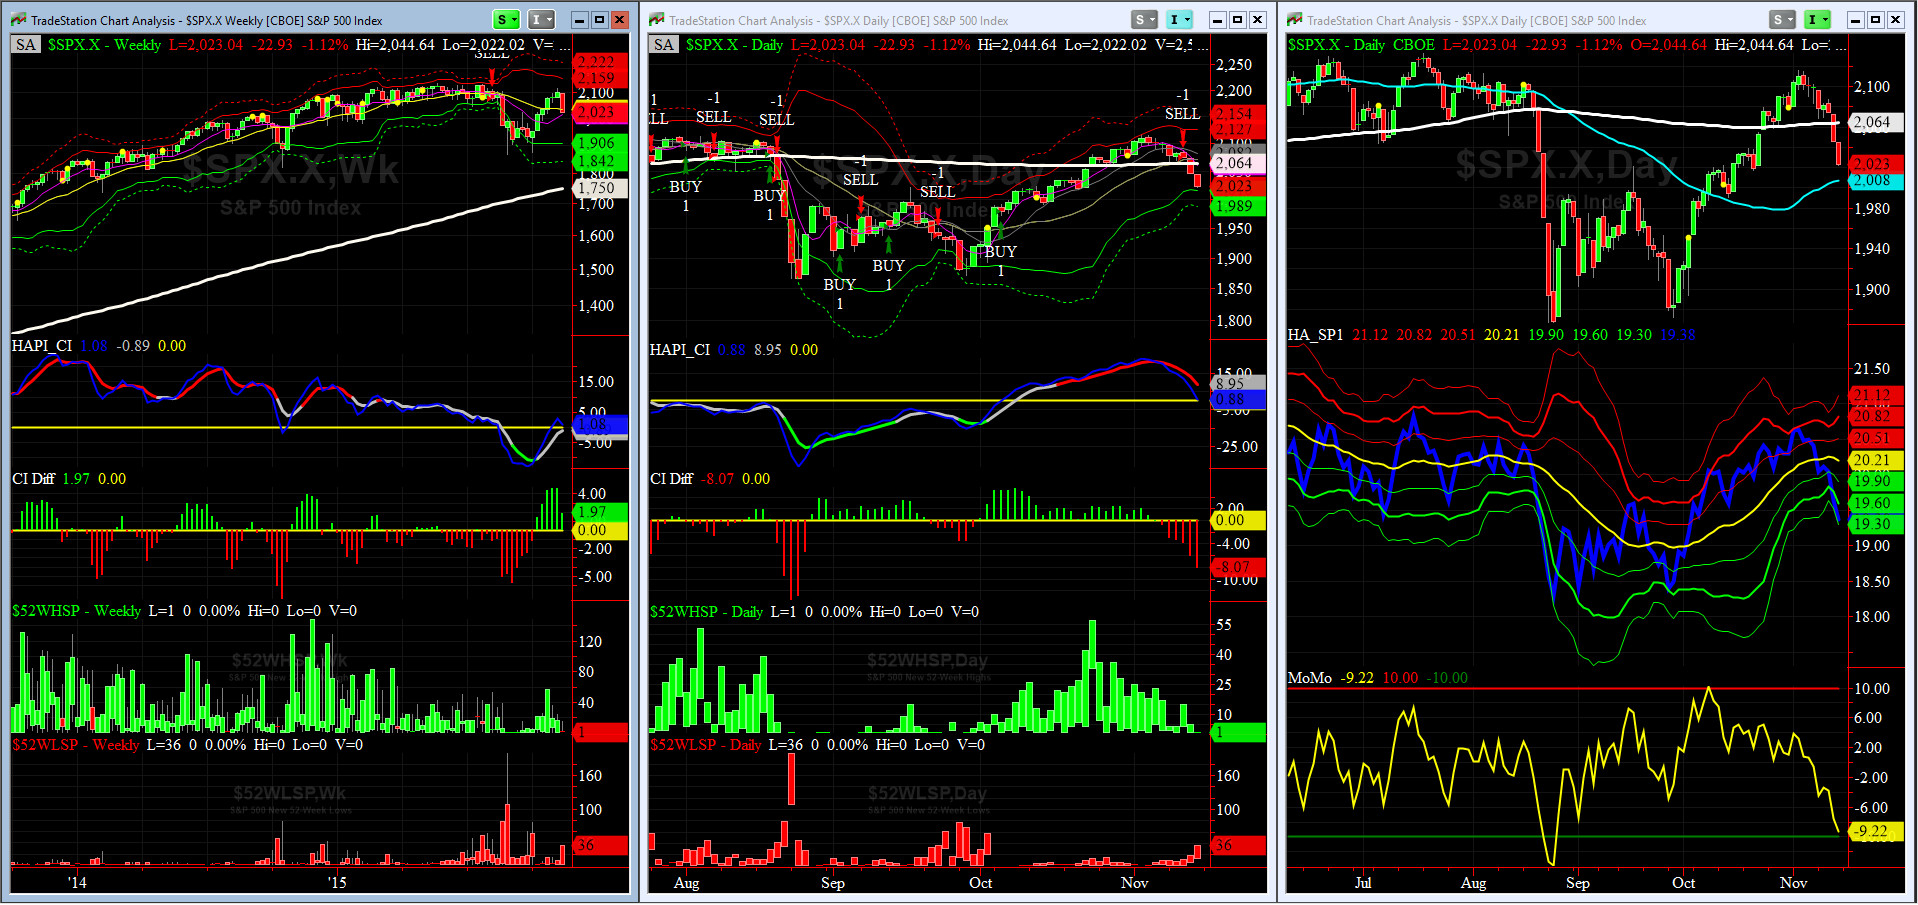
Timer Chart of S&P-500 Cash Index (SPX)
This past week SPX dropped 3.63% (most of it on Thursday and Friday) and we missed this move. Not good. Problem was the breadth & momentum indicators went to oversold very fast. NYSE McClellan Osc is at -202 and Breadth Thrust is at 37.20. And, then came the Paris Attacks, five minutes after Index Futures RTH closed in Chicago.
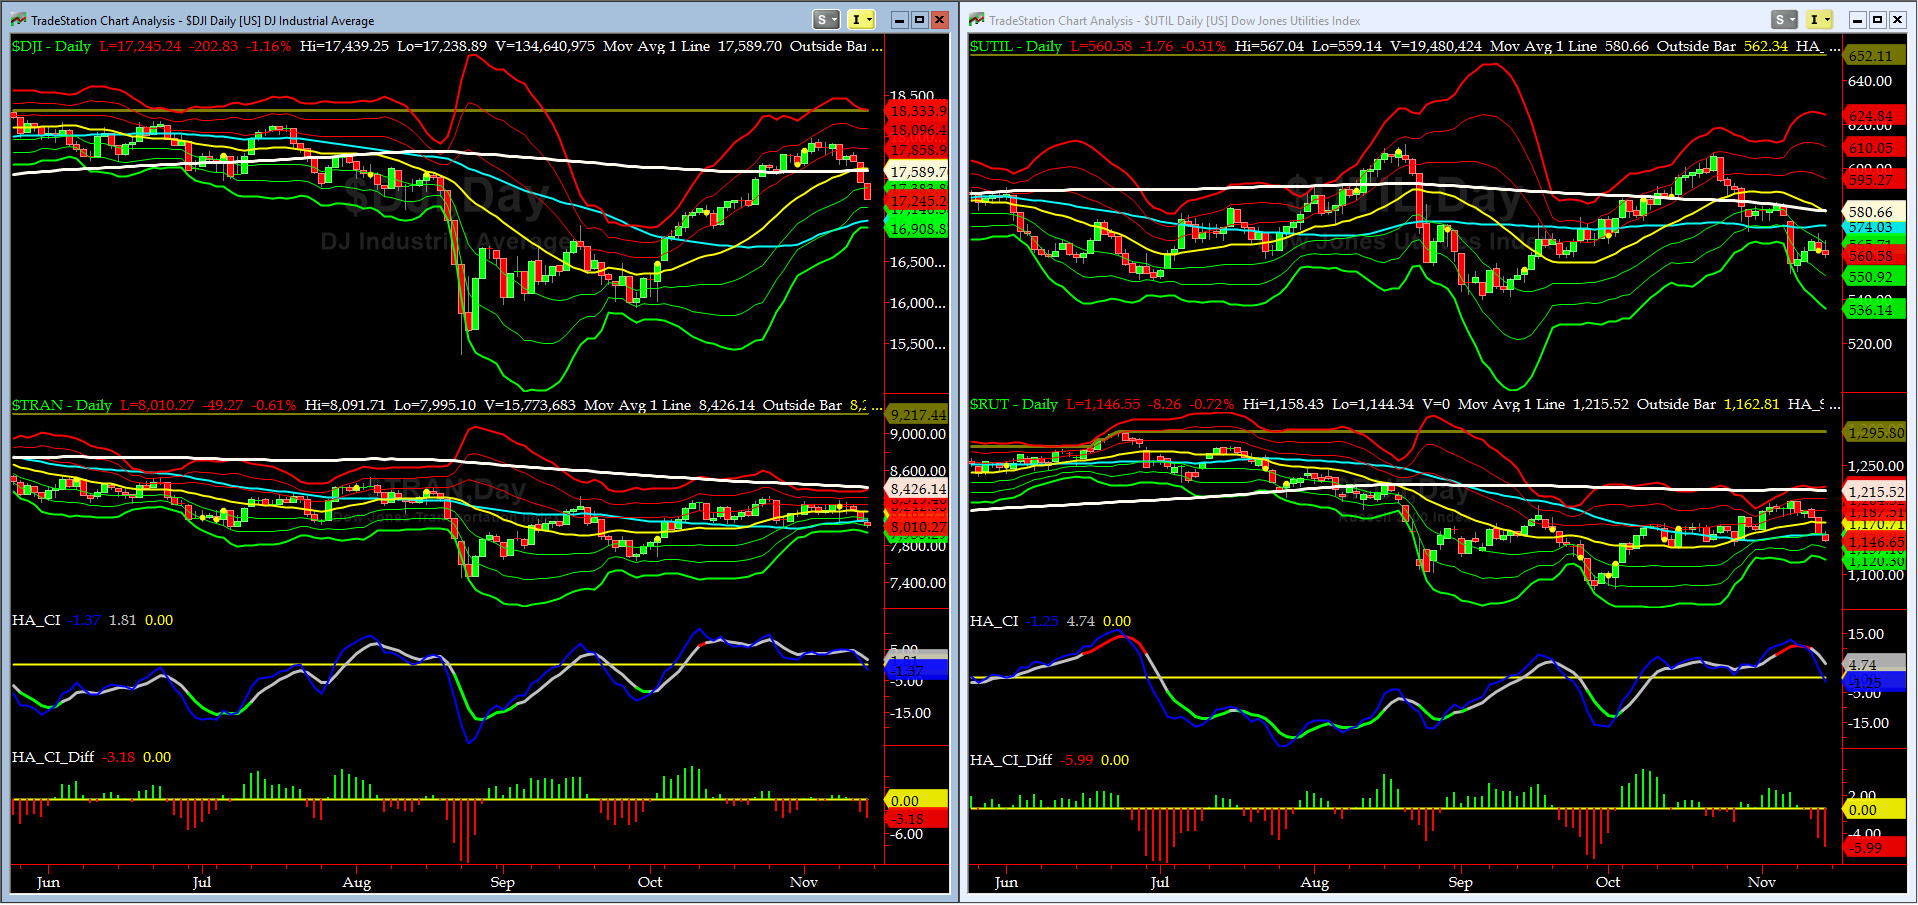
Canaries [in the Coal Mine] Chart for DJ TRAN & RUT Indices
This past week both the DJ Transports (proxy for economic conditions 6 to 9 months hence) and Russell 2000 Small Caps (RUT, a proxy of RISK ON/OFF) broke down below their respective 50-day MAs. RISK is OFF again.
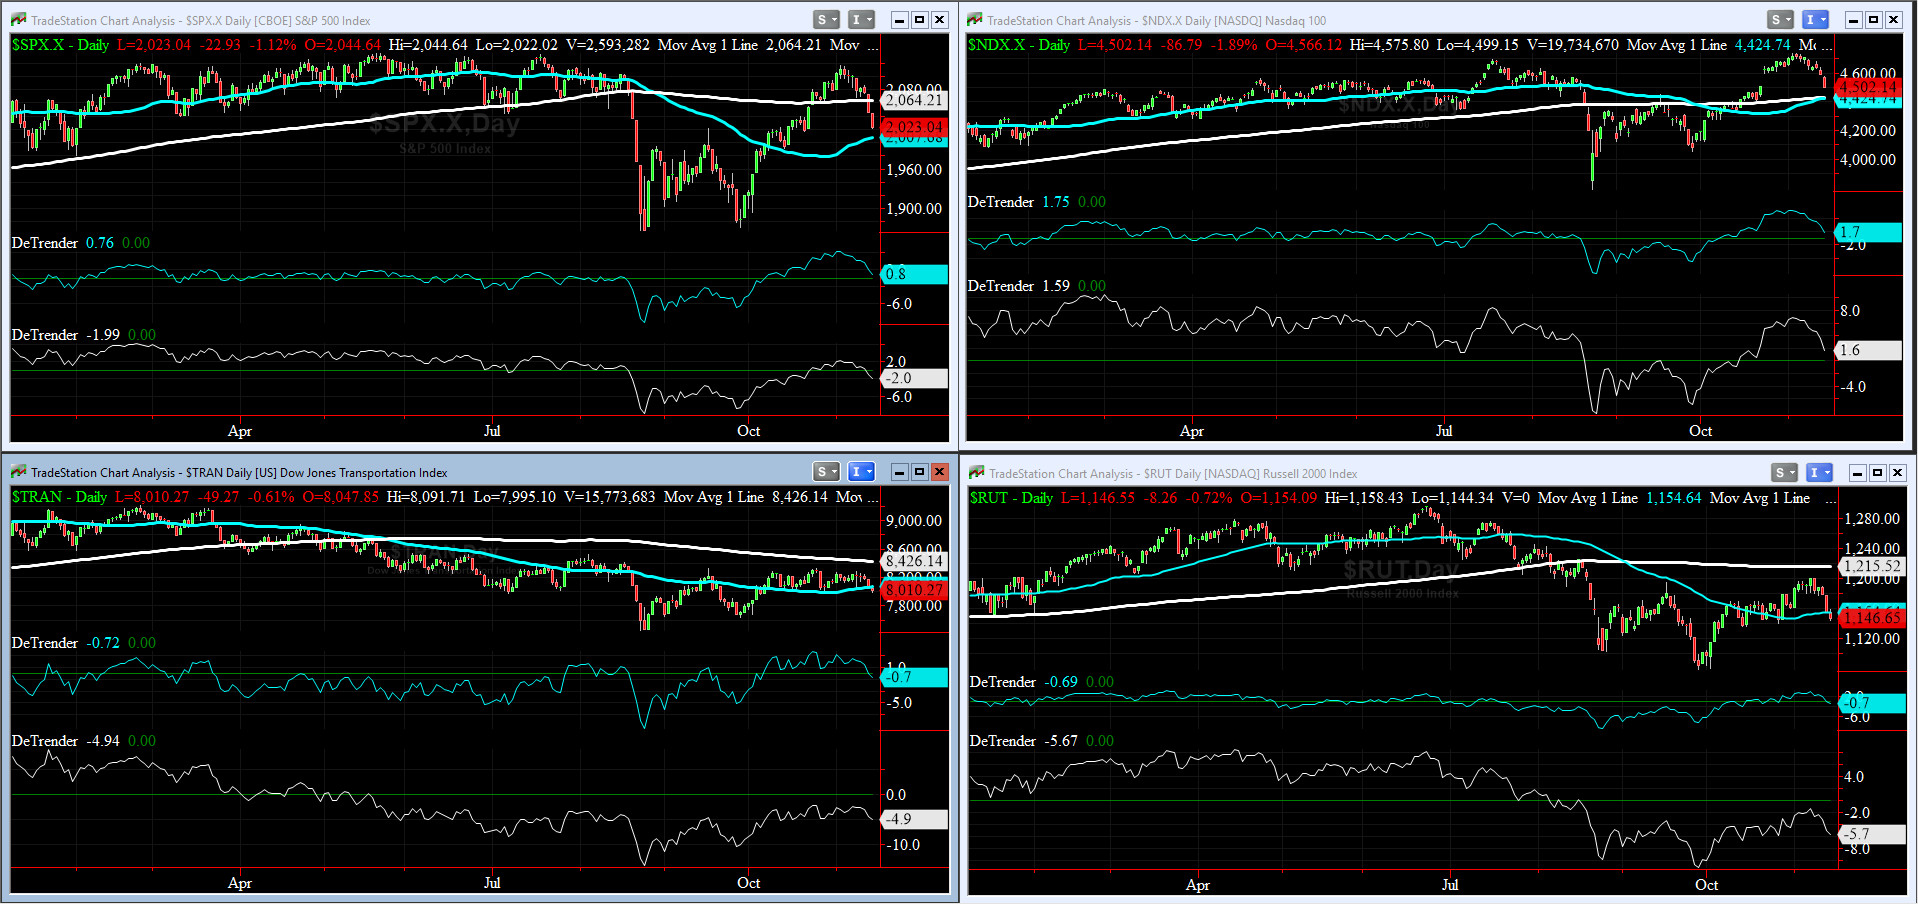
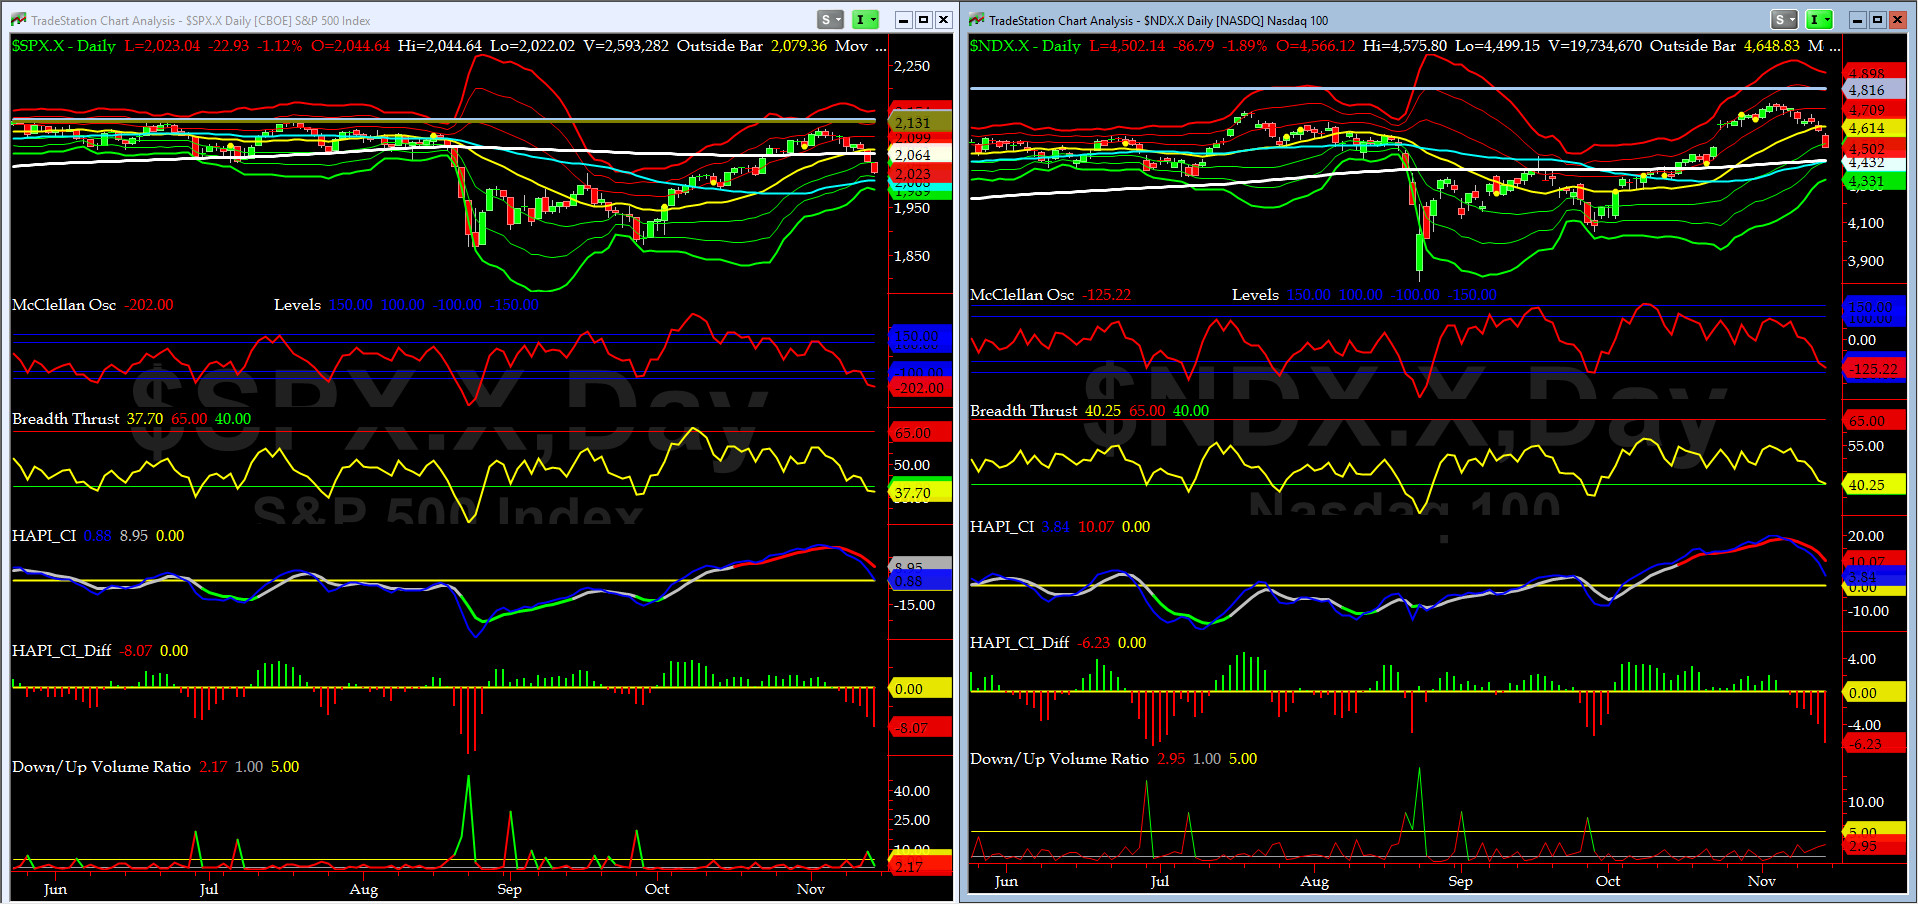
DeTrenders Charts for SPX, NDX, TRAN & RUT Indices
This past week, two of our 50DTs went negative (DJ TRAN & RUT), while only one of our 200DTs is still positive (NDX).
HA_SP1_momo Chart
We are on SELL (WEEKLY Timing Model) as of August 8th, and SELL (DAILY Timing Model) as of Wednesday, November 11th.
HA_momo, now at -9.22, is no longer in divergence with SPX Cash & HA_SP1.
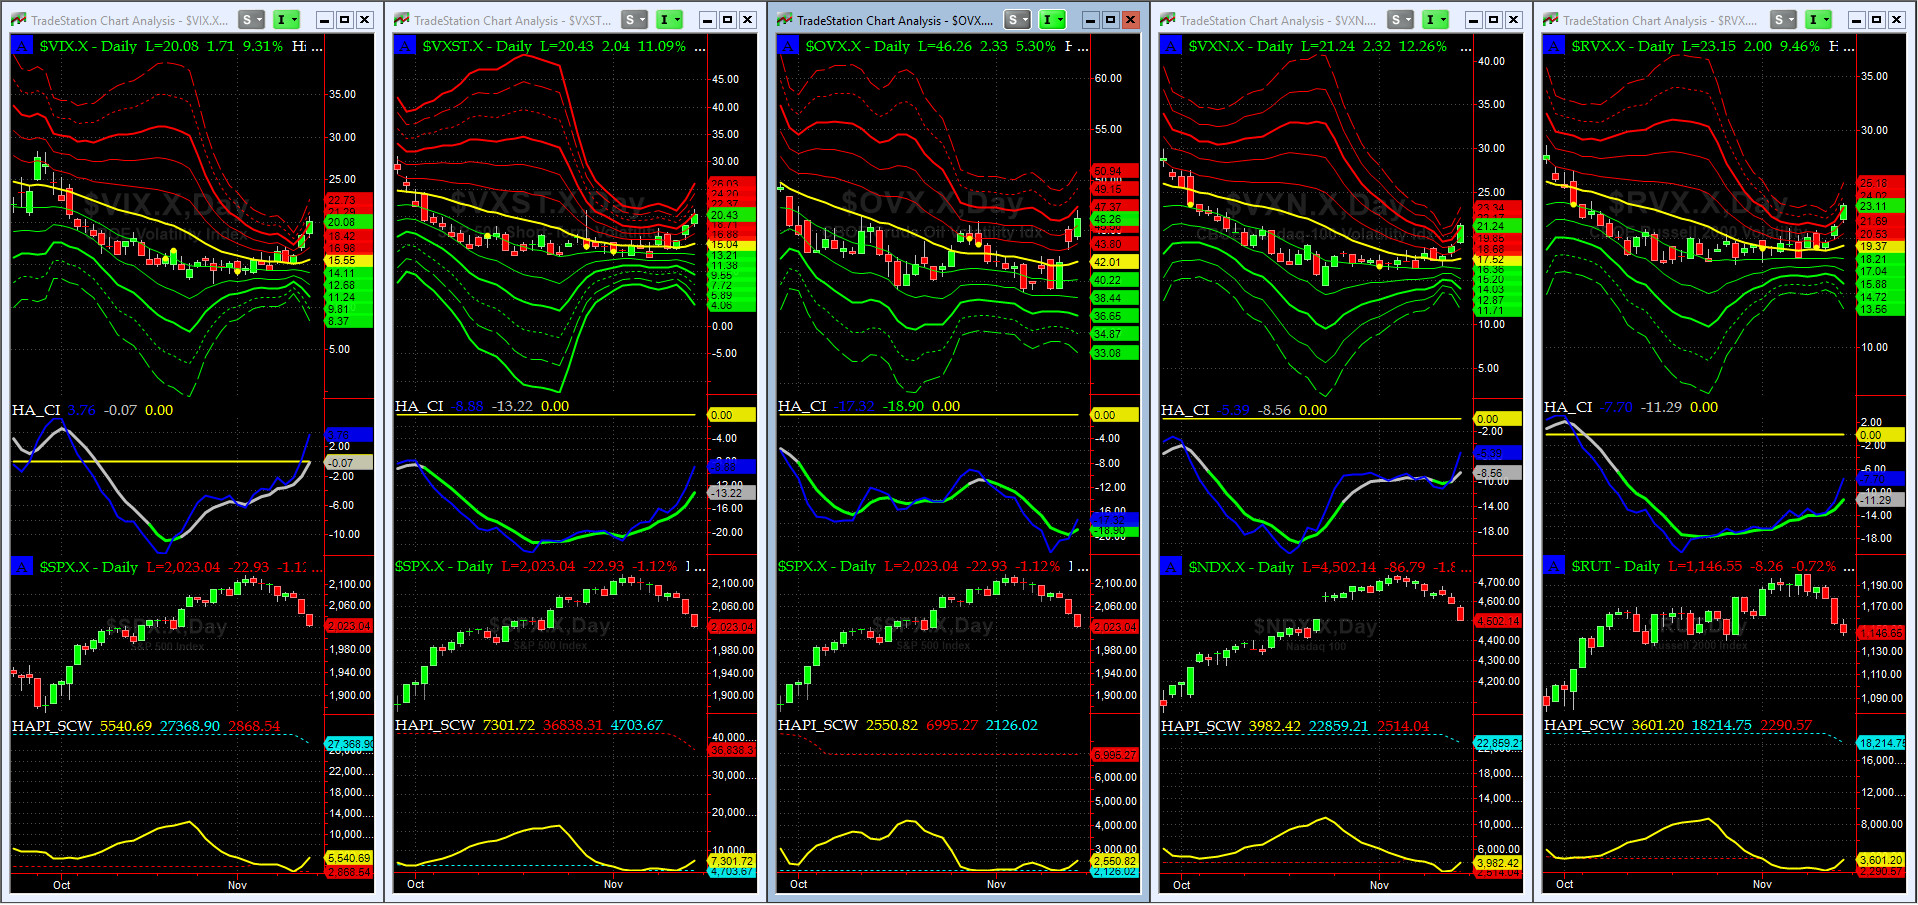
Vol of the Vols Chart
OVX (Crude Oil Volatility) bounced hard this past week along with other index vols as shown above. And VIX Futures went into a mild contango Friday afternoon.
All Quiet on Mid-Western Front (where VIX is traded)? Nope. (The other shoe dropped Friday Night in streets of Paris).
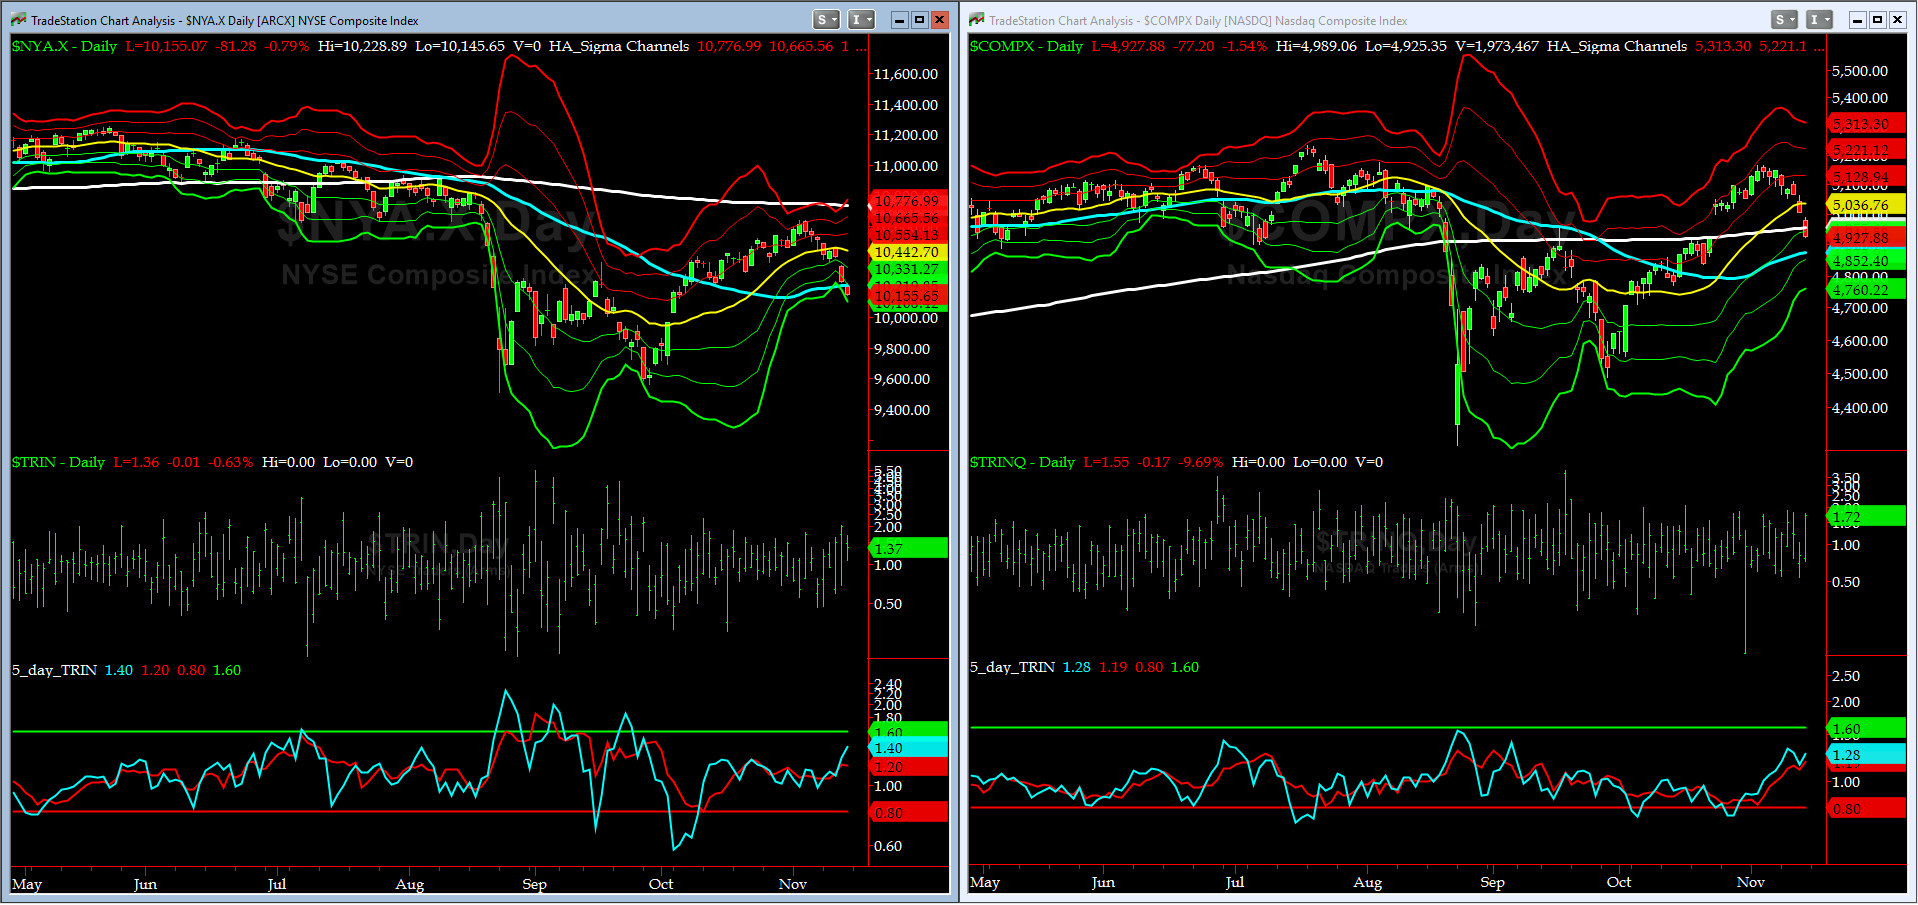
5-day TRIN & TRINQ Charts
Now both 5-day TRIN & TRINQ are racing into BUY Zones (1.60 or higher).
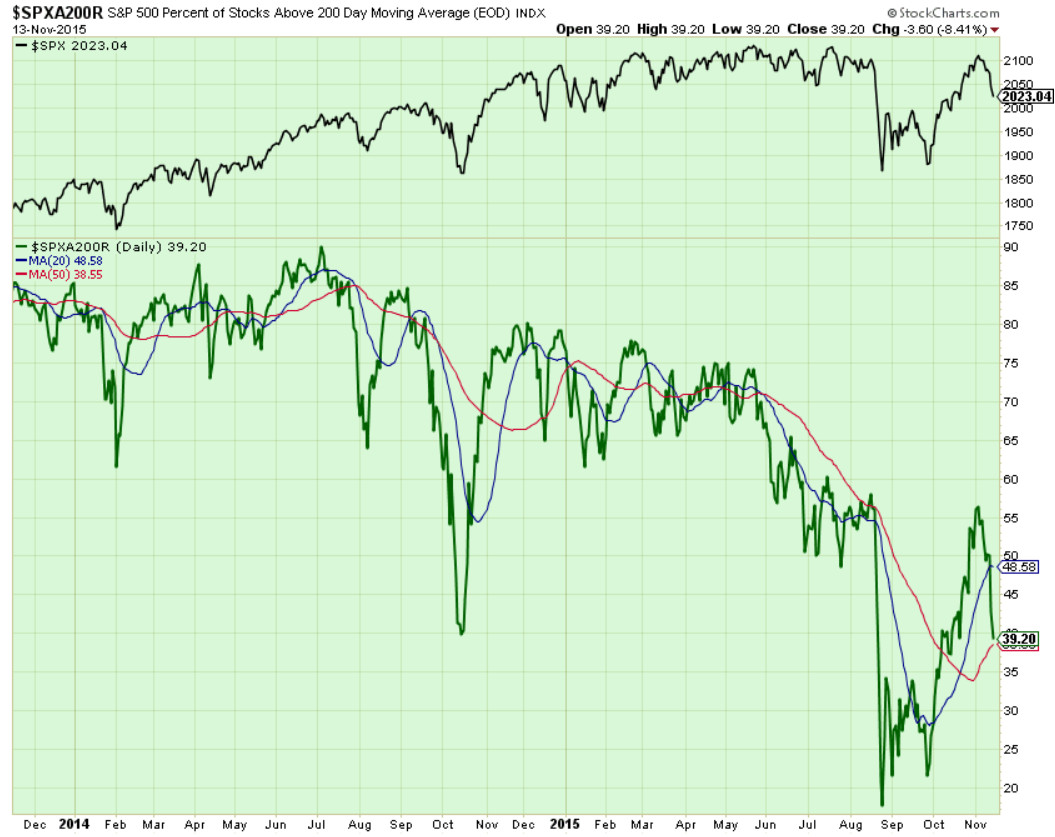
Components of SPX above their respective 200day MA Chart
We are at 39.2% now. Last week was first weekly drop in 7 weeks. Next target is 35% (we think it will slice thru its 50-bar like hot knife thru butter).
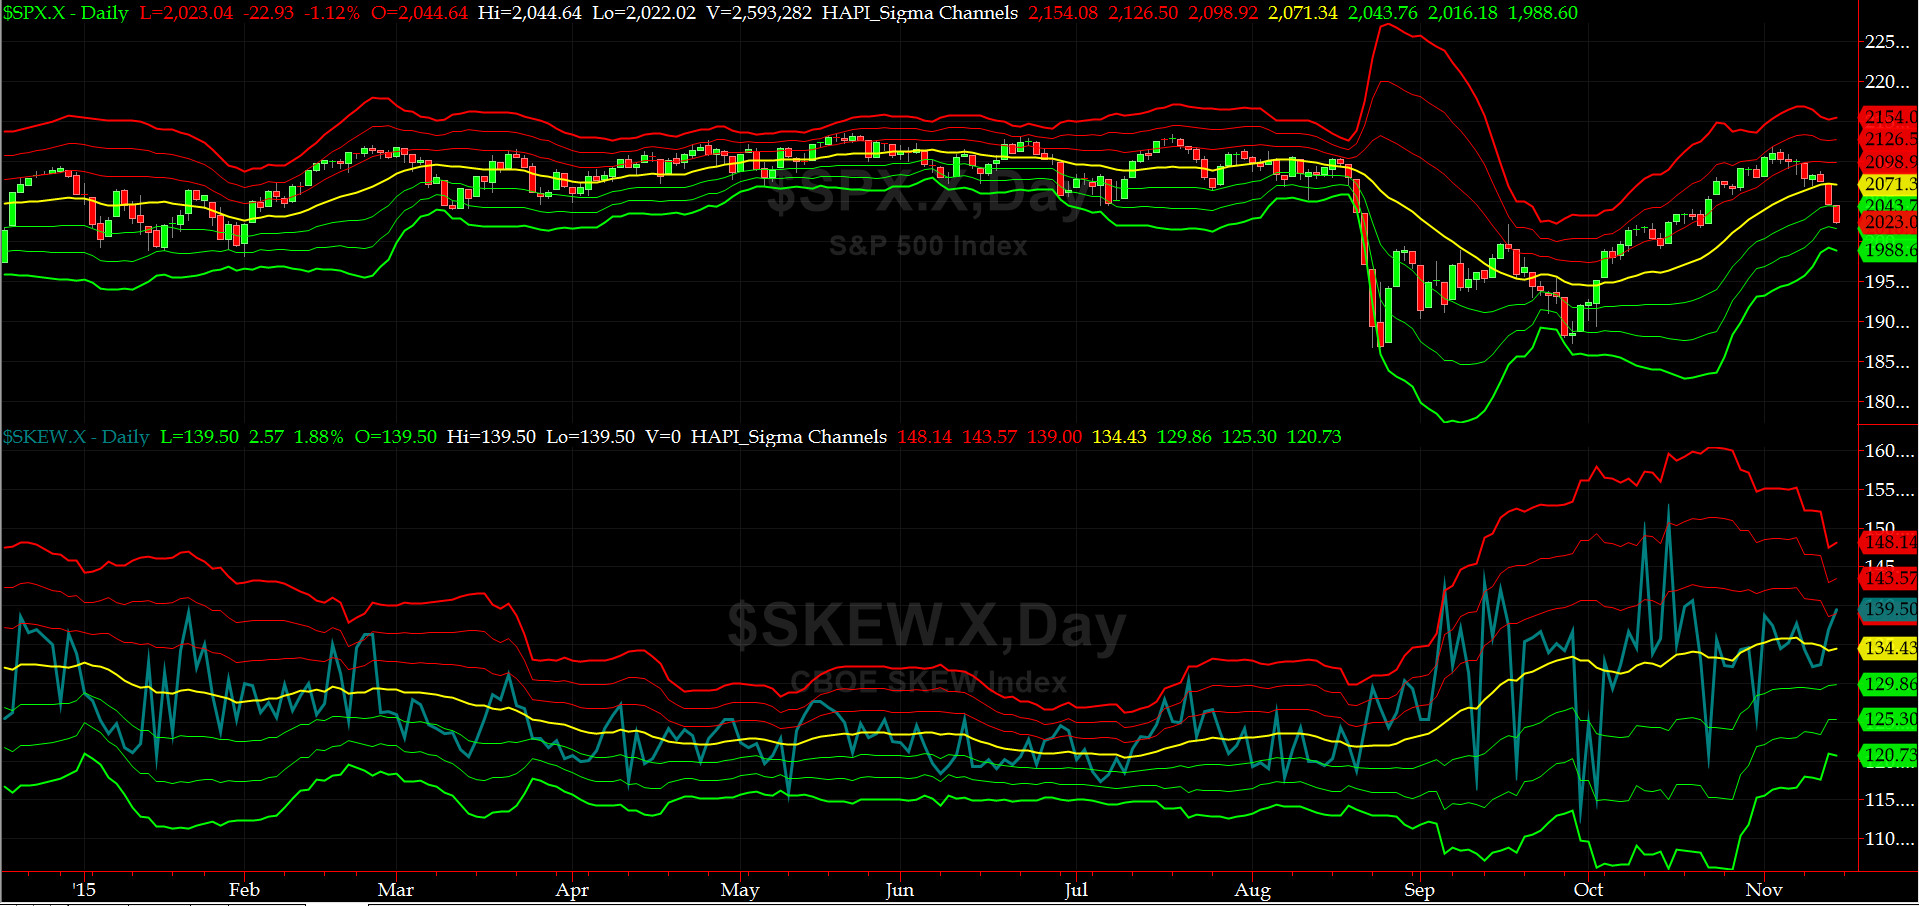
SPX SKEW (Tail Risk) Chart
After Friday Close, SPX SKEW (Tail Risk) went up to 139.5 (to its +1 sigma). As we have mentioned here for several weeks now, this & our 3-mo. VX Spread have not been good tells.
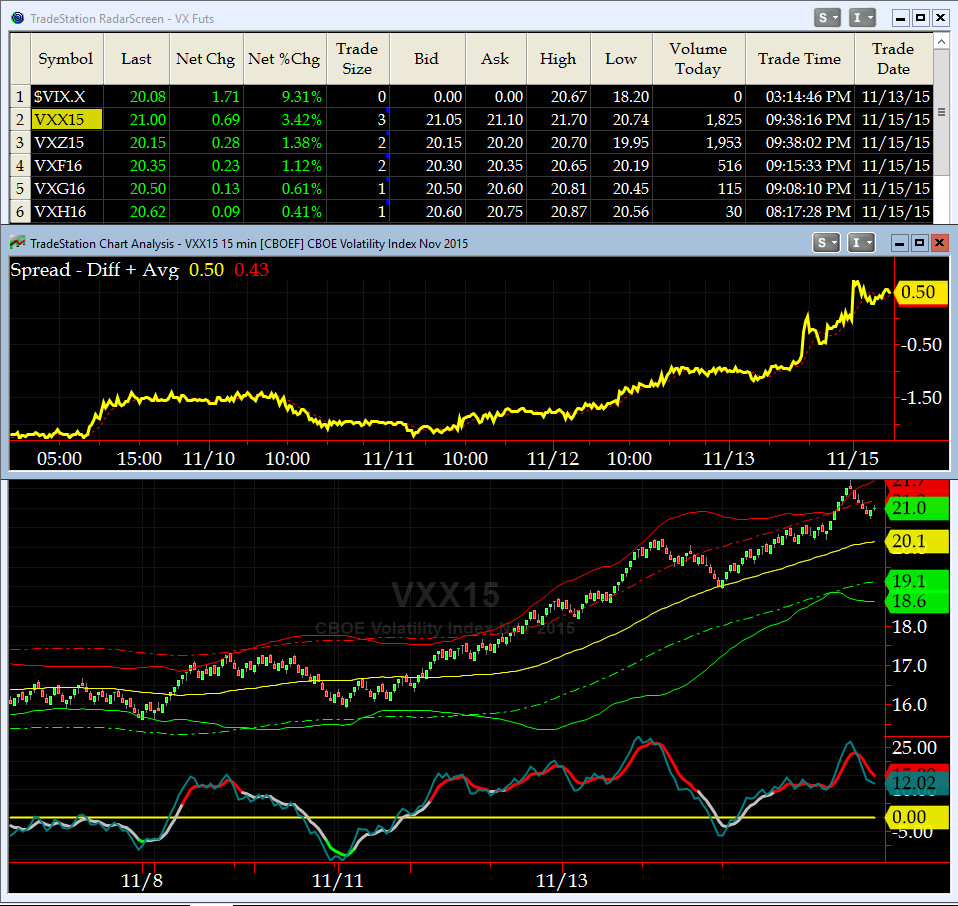
3-month VIX Futures Spread(VX) Chart
Our 3-month VIX Futures Spread, is now at +0.5. Our interpretation of this indicator, in the last few weeks, were that some of our market participants [the smarter ones?], had some worries, even though, SPX has rallied 6 weeks in a row.
Note the run-up of our OTF Chart for front month, NOV (bottom sub-graph) with its CI on a SELL, after last Friday Close.
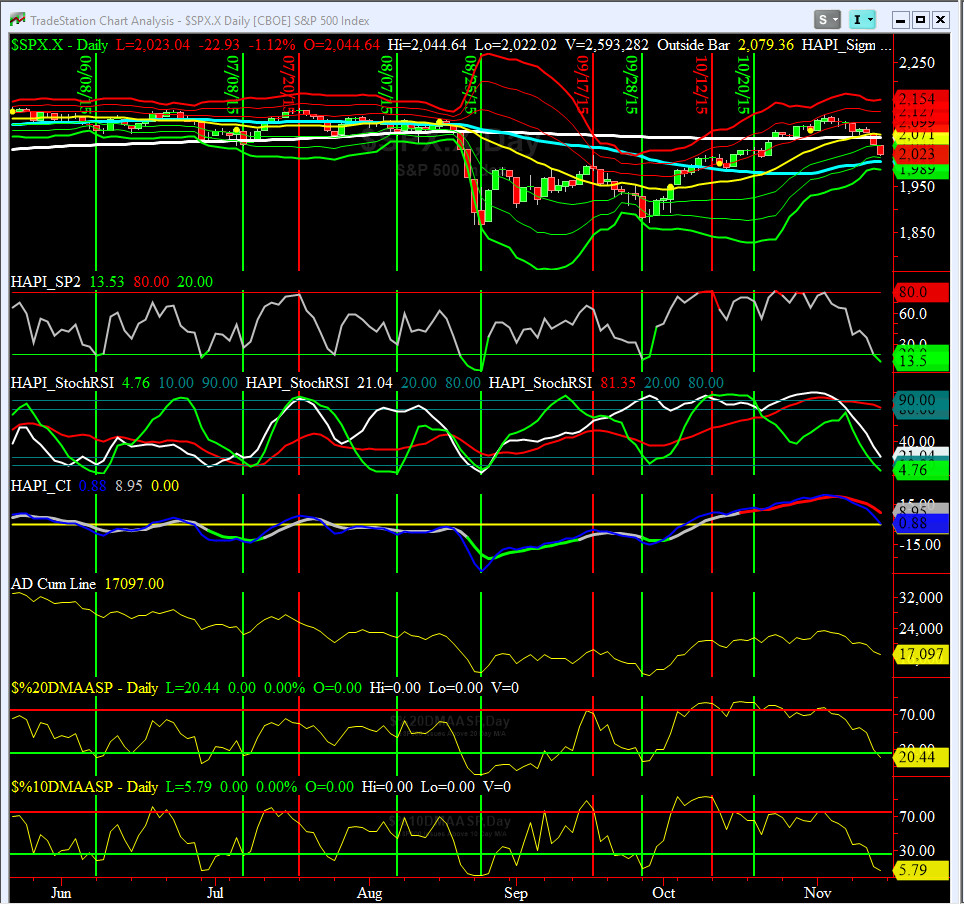
HA_SP2 Chart
At 13.5, this prop indicator is in deep oversold zone.
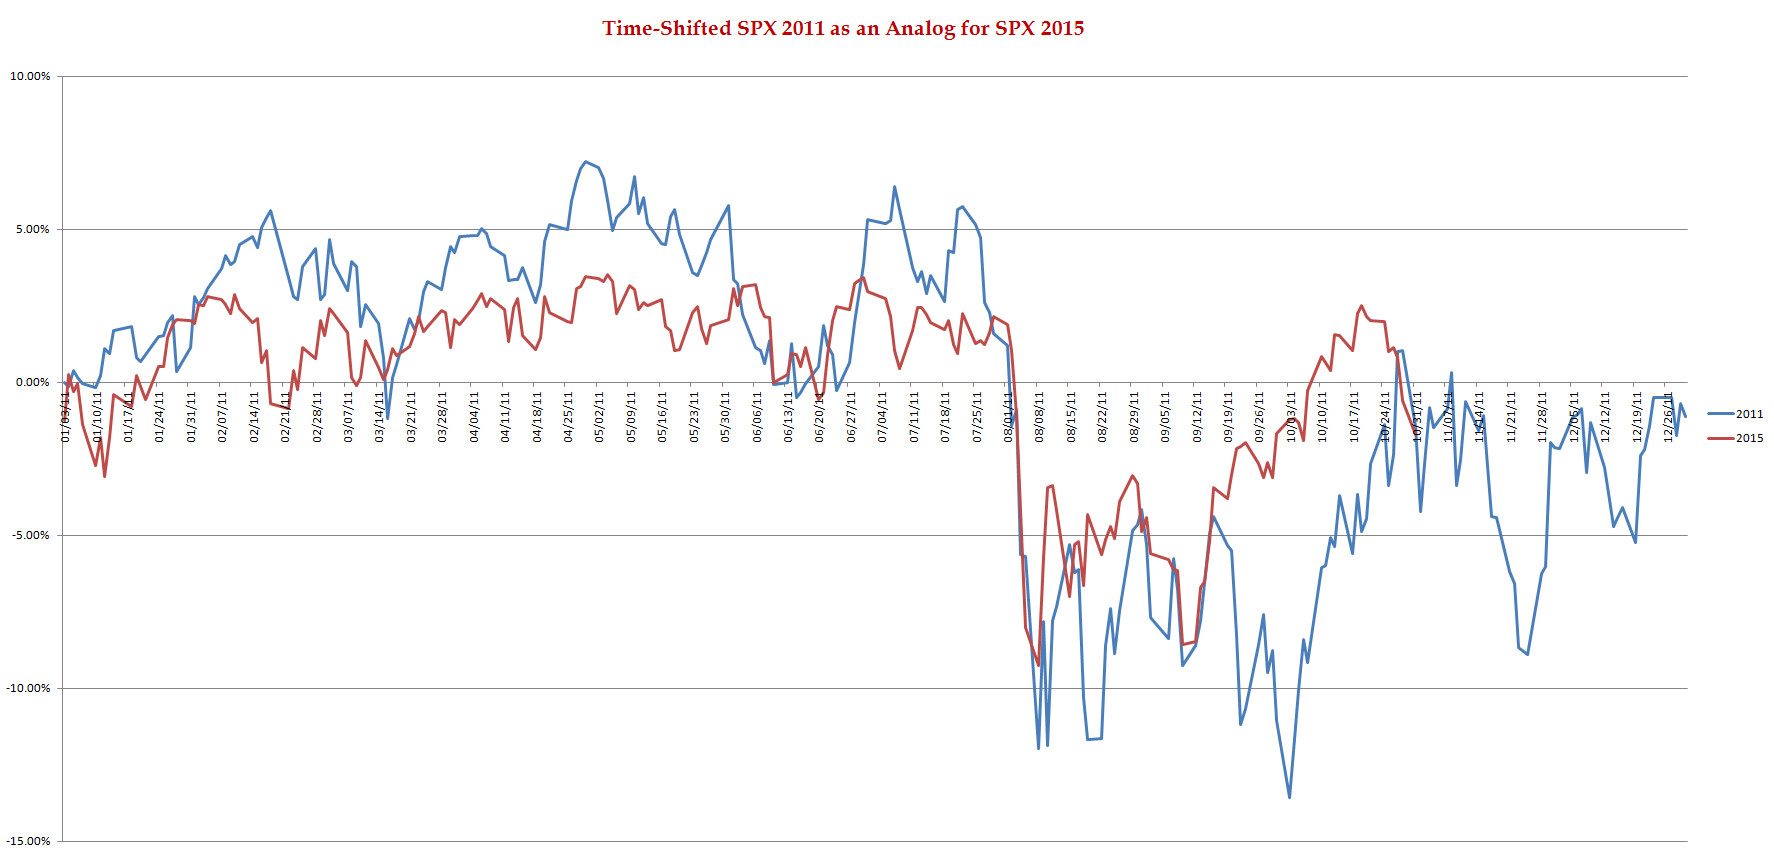
SPX 2011 Time-Shifted Analog for SPX 2015
Au revoir 1998 Analog....... 2011 Analog Rules for now......
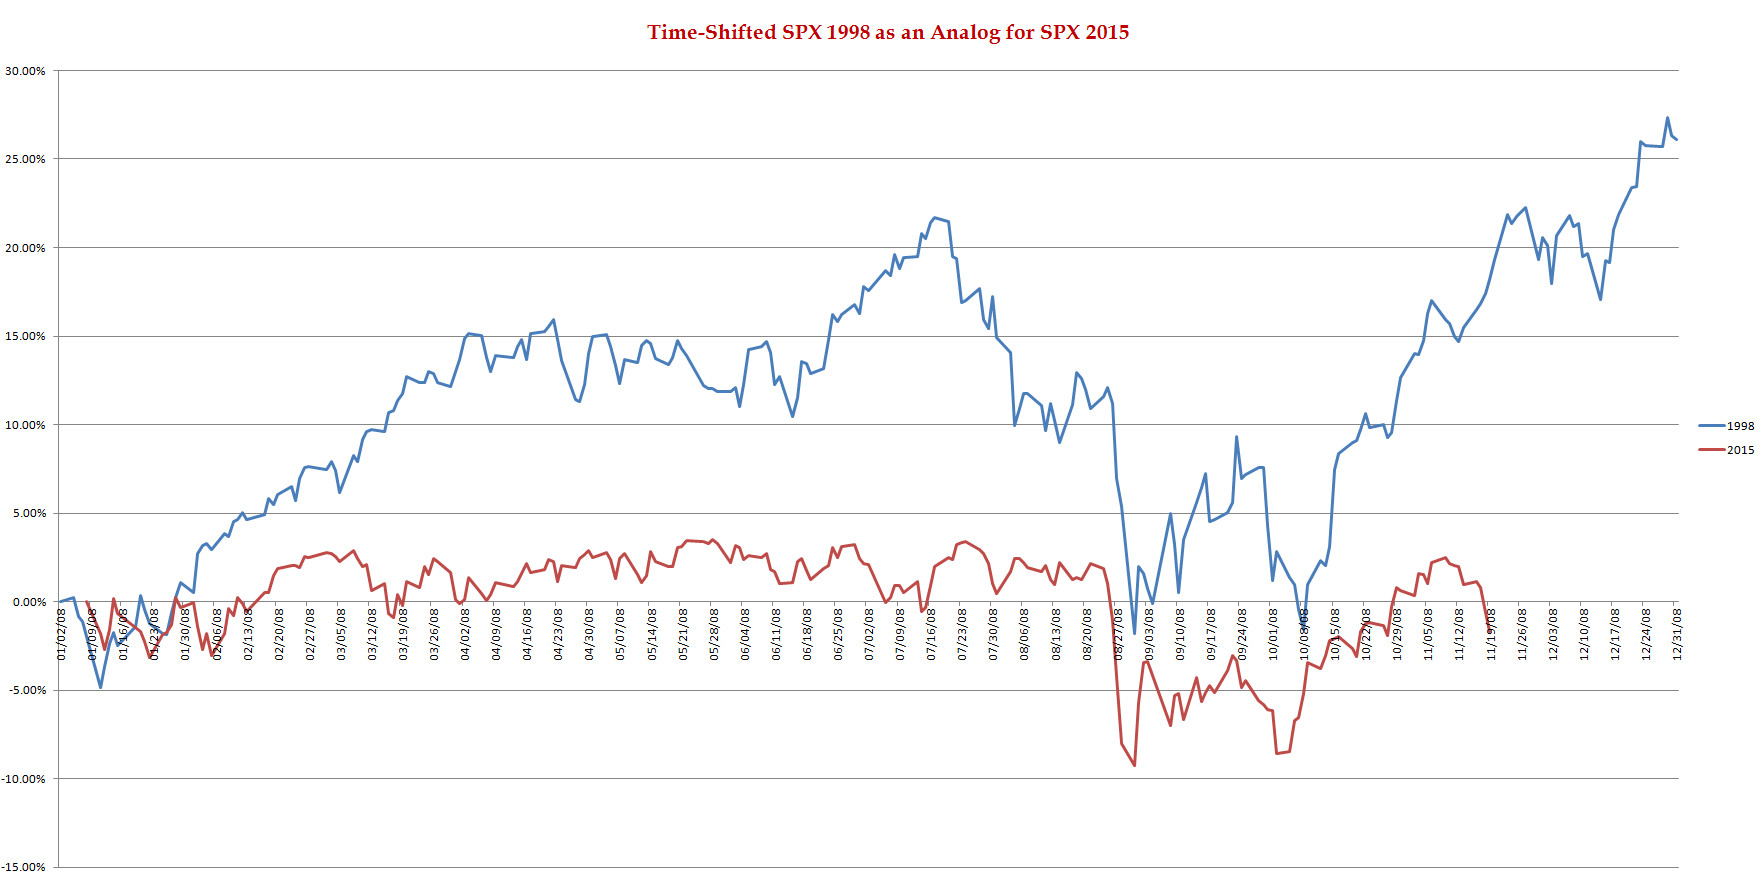
SPX 1998 Time-Shifted Analog for SPX 2015
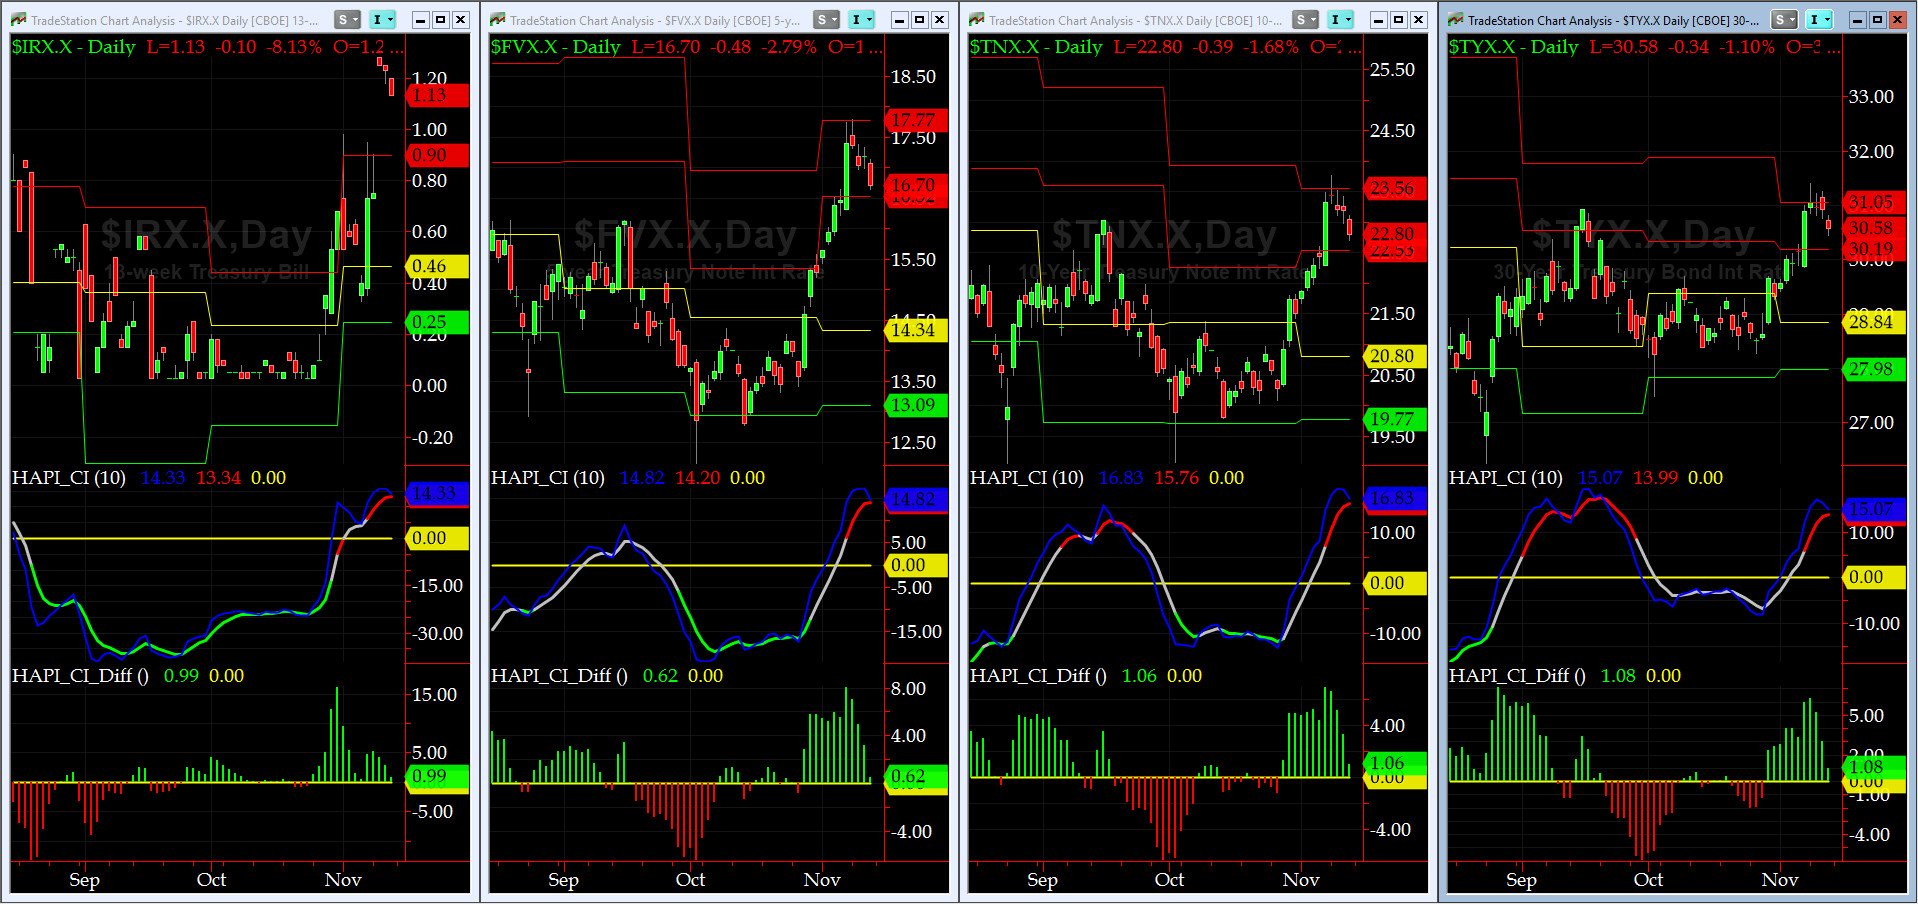
US Treasury T-Notes & T-Bonds Yields Chart
This past week, the YTM on Treasuries pulled back and we expect this to continue this coming (flight to safety).
Good luck this week,
Fari Hamzei
|
|
|
|
|
|
Customer Care:
|
|
|
|
|
|
|
 |
 |
|
 |
|
 |
 |
 |
HA YouTube Channel ::: HA Blog ::: Testimonials ::: Tutorials & FAQs ::: Privacy Policy
|
Trading Derivatives (Options & Futures) contains substantial risk and is not for every investor. An investor could potentially lose all or more than his/her initial investment.
Only risk capital should be used for trading and only those with sufficient risk capital should consider trading derivatives. Past performance is not
necessarily indicative of future results. Testimonials appearing on this website may not be representative of other clients or customers
and are not a guarantee of future performance or success.
|
| (c) 1998-2025, Hamzei Analytics, LLC.® All Rights Reserved. |
|
|