
|
 |
 |
 |
 |
 |
 |
 |
 |
 Proactive Market Timing Proactive Market Timing
|
|
|
Most Recent PMT vs SPX Performance Chart

|
|
|
|
Monday, December 7, 2015, 1045ET
Companion Chart for Market Bias Review, Issue #121
|
|
|
|
|
|
Sunday Night, December 6, 2015, 2300ET
Market Bias Review, Issue #121
Most recent S&P-500 Cash Index (SPX): 2091.69 up 1.58 (up +0.076%) for the week ending on Friday, December 4th, 2015, which closed near its +1 sigma.
SPX ALL TIME INTRADAY HIGH = 2134.72 (reached on Wednesday, May 20th, 2015)
SPX ALL TIME CLOSING HIGH = 2130.82 (reached on Thursday, May 21st, 2015)
Current DAILY +2 Sigma SPX = 2116 with WEEKLY +2 Sigma = 2156
Current DAILY 0 Sigma (20 day MA) SPX = 2076 with WEEKLY 0 Sigma = 2033
Current DAILY -2 Sigma SPX = 2036 with WEEKLY -2 Sigma = 1907
50-Day MA SPX =2042 or +3% below SPX (max observed in last 5 yrs = +8.6%, min = -9.3% )
200-Day MA SPX = 2065 or +1.2% below SPX (max observed in last 5 yrs = 15.2%, min = -14%)
VIX = 14.81 which closed Friday at its -1 sigma (remember it�s the VIX�s vol pattern (its sigma channels) that matters, and not the level of VIX itself (this is per Dr. Robert Whaley, a great mentor and the inventor of original VIX, now called VXO. VIX usually peaks around a test of its +4 sigma))
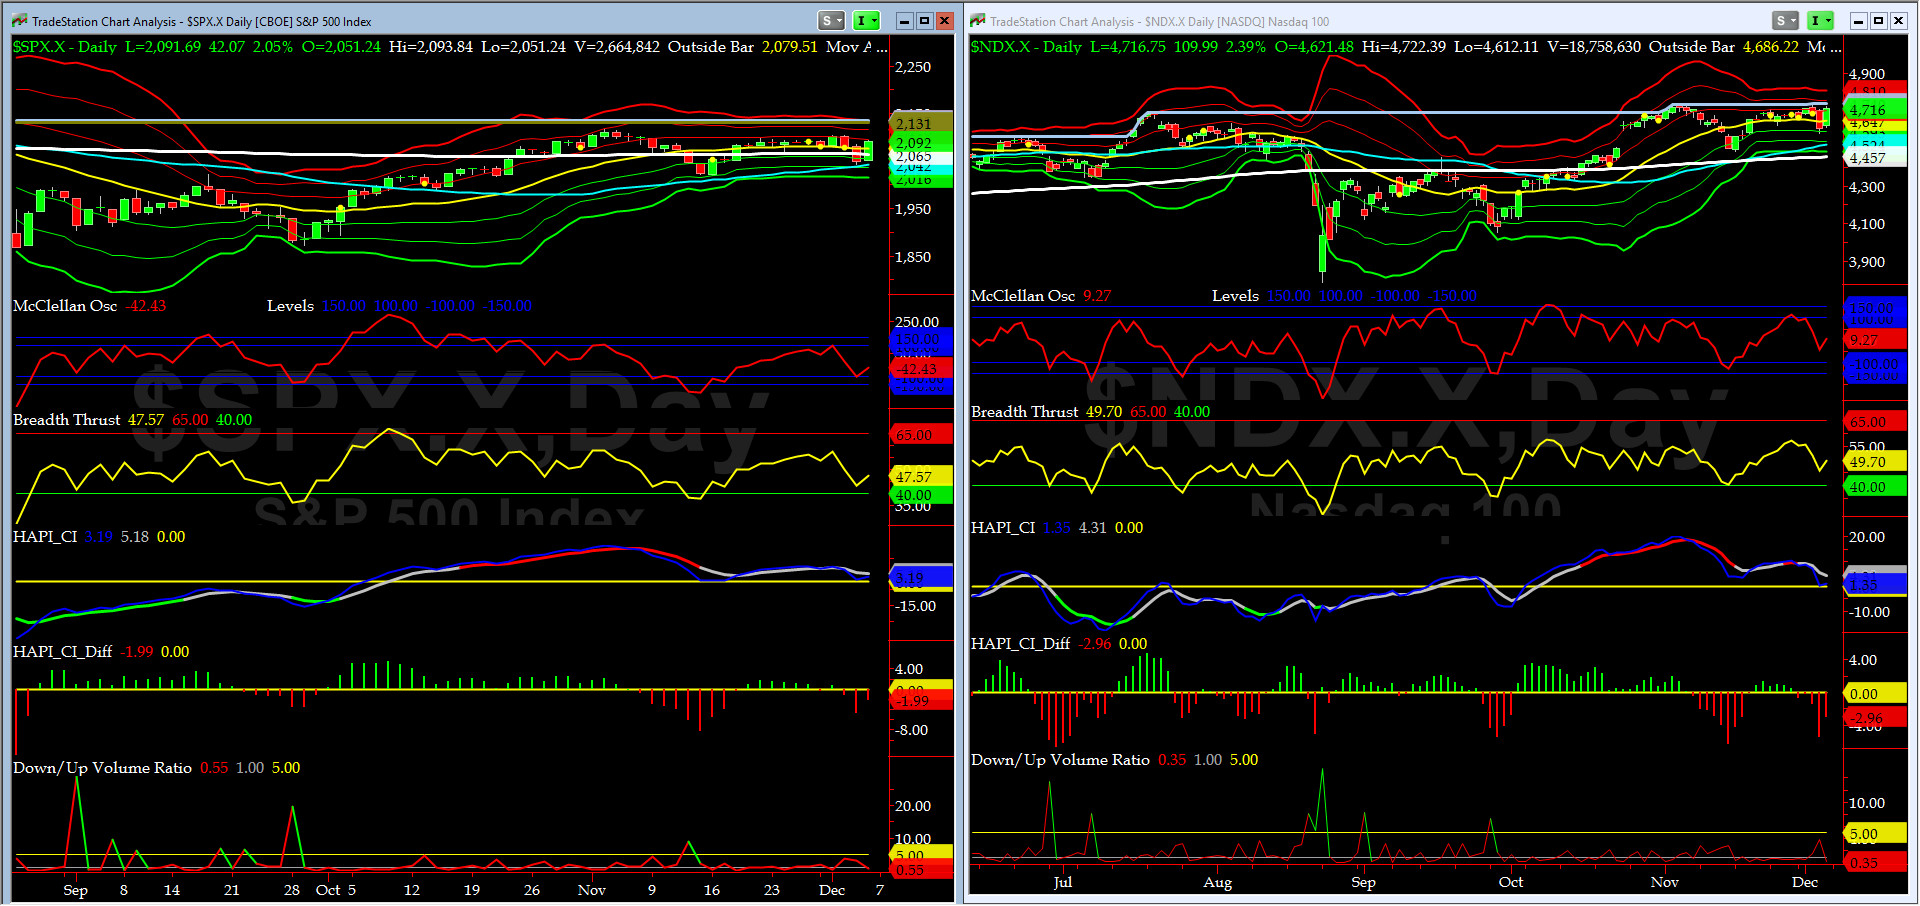
NYSE McClellan Oscillator = -42.4 (-150 is start of the O/S area; around -275 to -300 area or lower, we go into the �launch-pad� mode, over +150, we are in O/B area)
NYSE Breadth Thrust = 47.6(40 is considered as oversold and 65 as overbought)
WEEKLY Timing Model = on a BUY Signal since Friday 11/27/15 CLOSE
DAILY Timing Model = on a SELL Signal since Thursday 12/3/15 CLOSE
Max SPX 52wk-highs reading last week = 25 (over 120-140, the local maxima is in)
Max SPX 52wk-Lows reading last week = 26 (over 40-60, the local minima is in)
HA_SP1 = near its +0.5 Sigma
HA_Momo = -0.45 (reversals most likely occur above +10 or below -10)
HA_SP2 = 56.5(Buy signal <= 20, Sell Signal >= 80)
3-mo. VX Futures Spread (long NOV short FEB) = -2.1 (-3 to -2.5 SELL signal, 0 BUY Signal)
SPX SKEW (Tail Risk) = 136.3 (normal = 120-125, range 100-150)
Our current SPX Bias with Timer Digest: LONG SPX as of Tuesday, October 20th, 2015 Close at 2030.77
Our previous Bias: SHORT SPX (since Tuesday, October 6th, 2015 Close at 1979.92)
This WEEK�s Bias = Cautiously, LONG SPX or SPY via Long Call Spreads.
Profit Target = 2120-2135
Money Management Stop = 2075
BOTTOM LINE: Again, we are NOT short-term overbought yet. Be ready to go to the sidelines on any sign of weakness or bad exogenous news till markets restabilize again.
NOTE: All LEVELS mentioned here have been, are, and will be, based on the S&P-500 SPX Cash Index, and not the ES Futures. Tomorrow after the first hour is complete, we will post here a companion chart showing critical short-term WEEKLY levels to watch for possible �retest failures.�
Fari Hamzei
|
|
|
|
|
|
Sunday, December 6, 2015 2115ET
Market Timing Charts & Comments
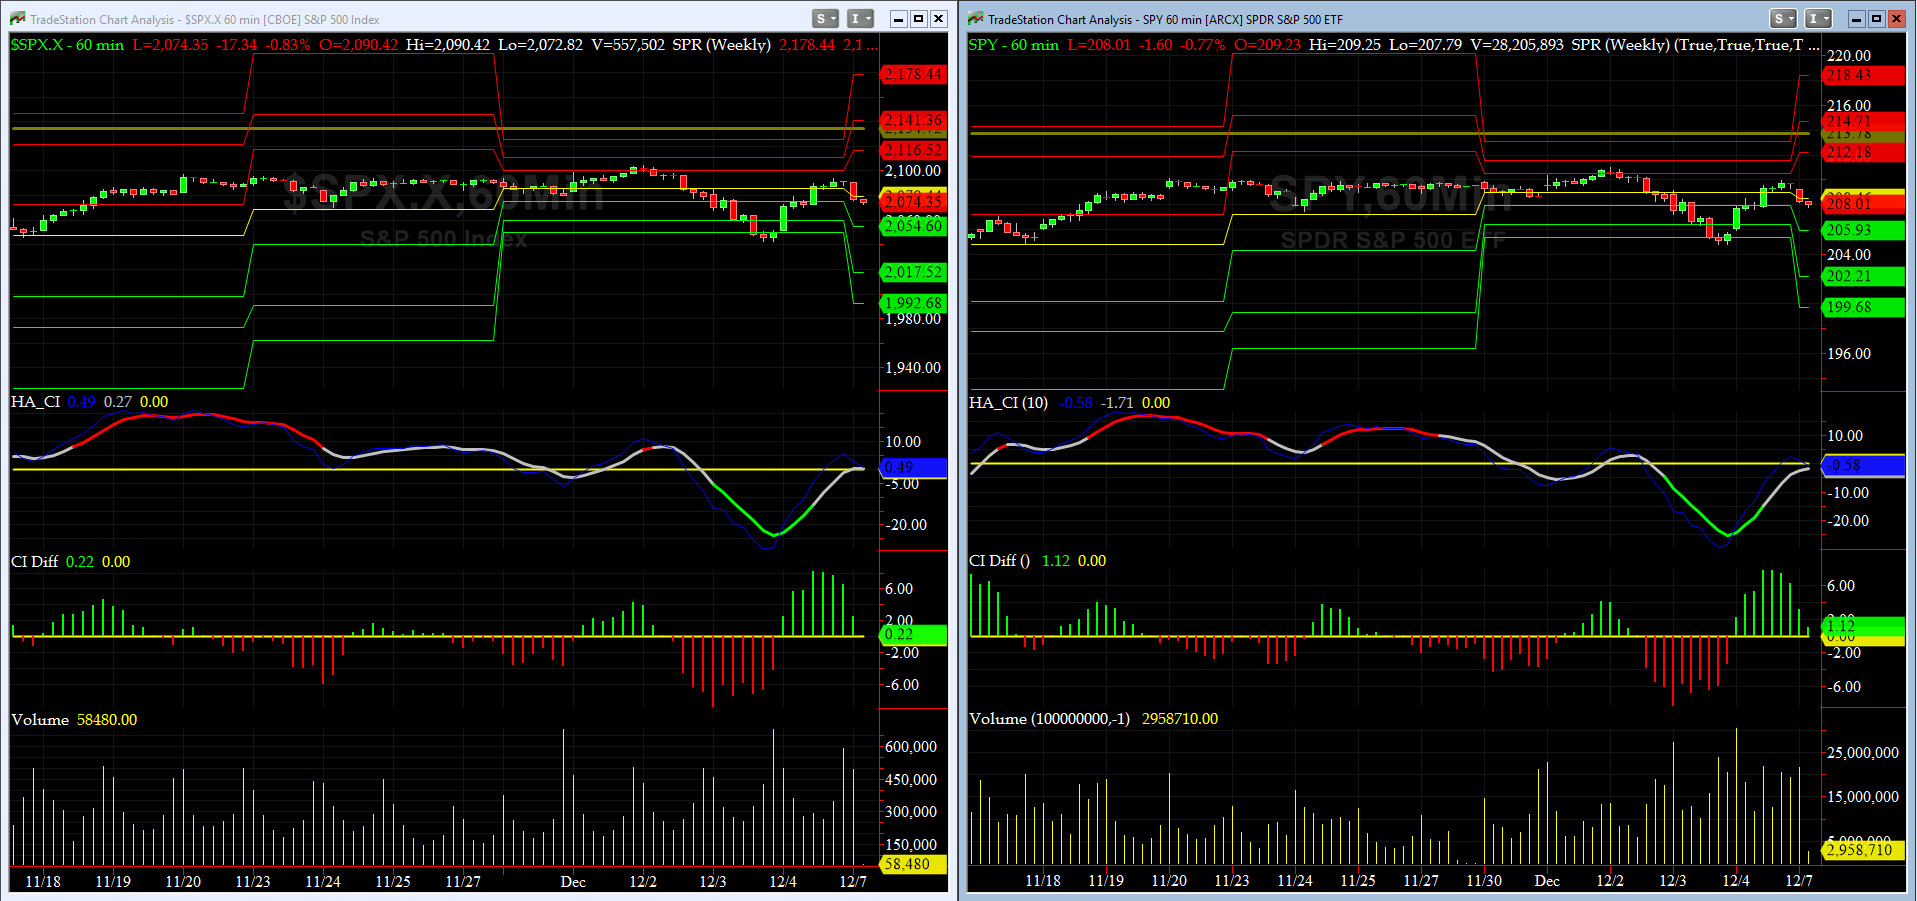
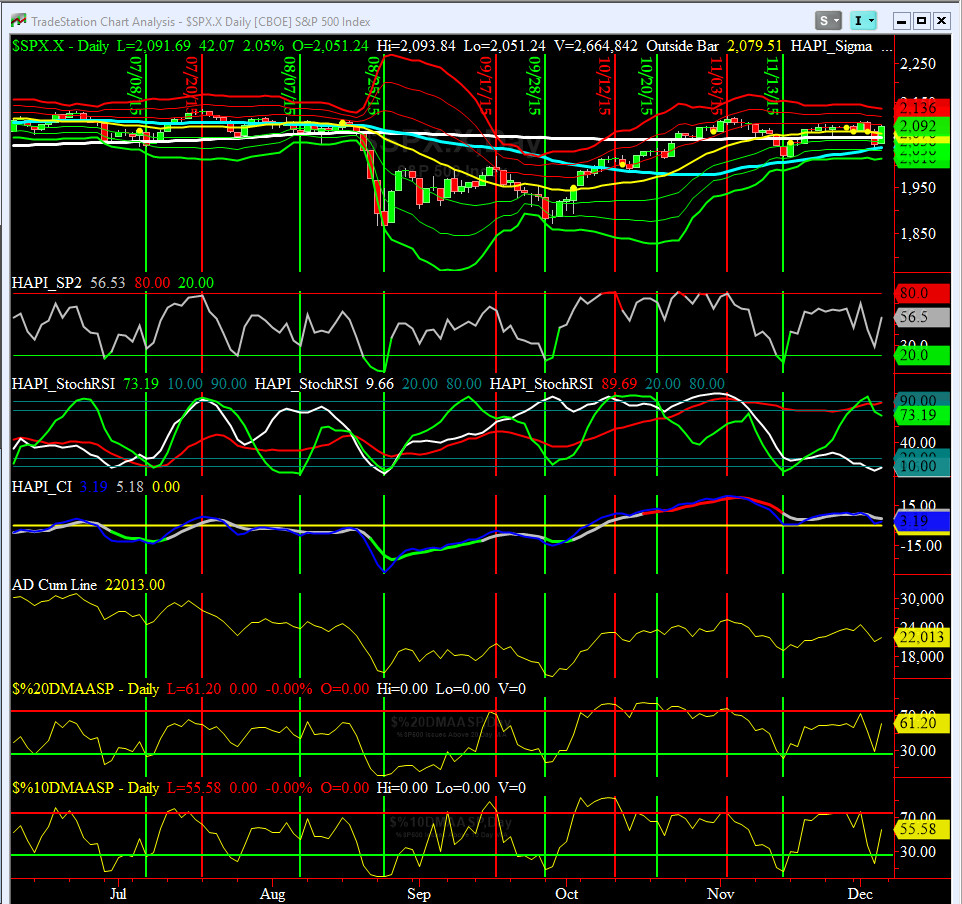
Timer Chart of S&P-500 Cash Index (SPX)
After a two day rout, caused by the horrific carnage in Southern California on Wednesday, and helped, at the margin, possibly by Fed Chair Dr Yellen's somewhat ambiguous testimony on the Hill, SPX rallied following an upbeat US Jobs Report that included an upward revision to October NFP data. Our breadth & momentum indicators bounced from near oversold levels. NYSE McClellan Osc is at -42.8 and Breadth Thrust is at 47.57.

Canaries [in the Coal Mine] Chart for DJ TRAN & RUT Indices
On Friday, the DJ Transports (proxy for economic conditions 6 to 9 months hence) bounced off its -3 sigma, while Russell 2000 Small Caps (RUT, a proxy of RISK ON/OFF) came back and closed about its zero sigma. RISK is NEUTRAL for now.
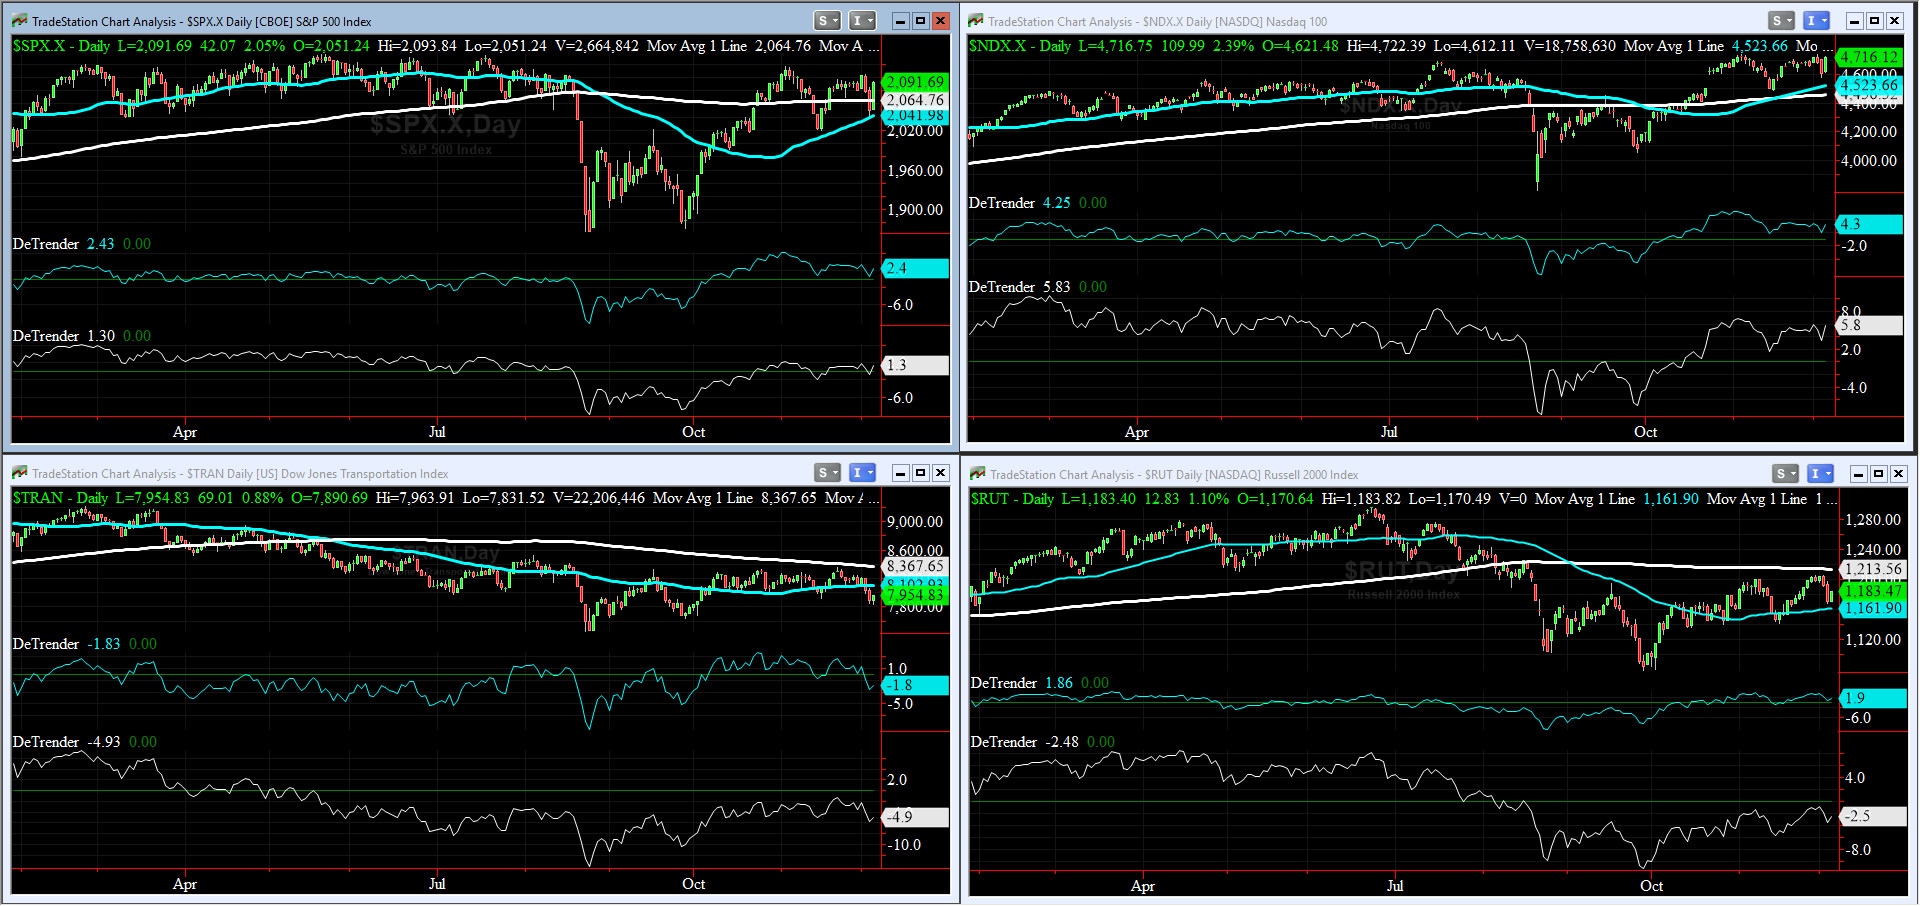
DeTrenders Charts for SPX, NDX, TRAN & RUT Indices
As of Friday Close, three out of our four 50DTs are positive, while only two of our four 200DTs are positive (SPX & NDX). Key 200DT to watch is RUT's.
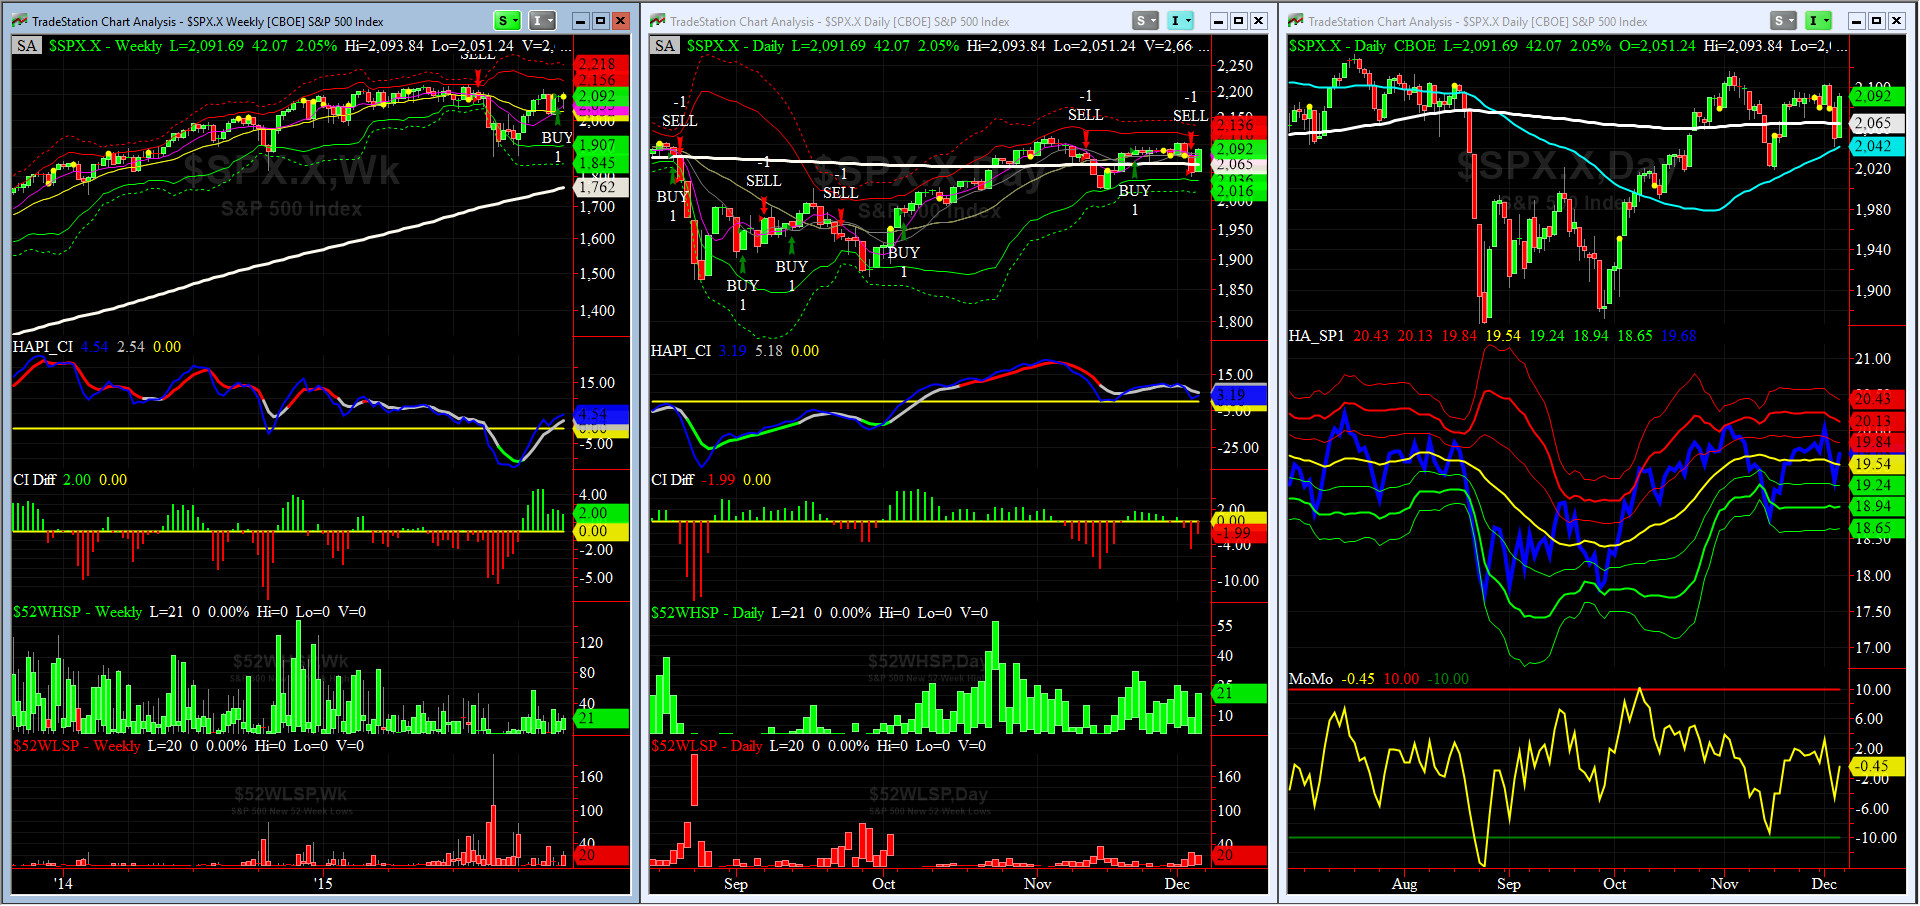
HA_SP1_momo Chart
Our WEEKLY Timing Model went to a BUY on Friday, Nov 27, and our DAILY Timing Model to a SELL on Thursday Close.
HA_SP1 is around it +0.5 sigma & HA_momo is now at -0.45.
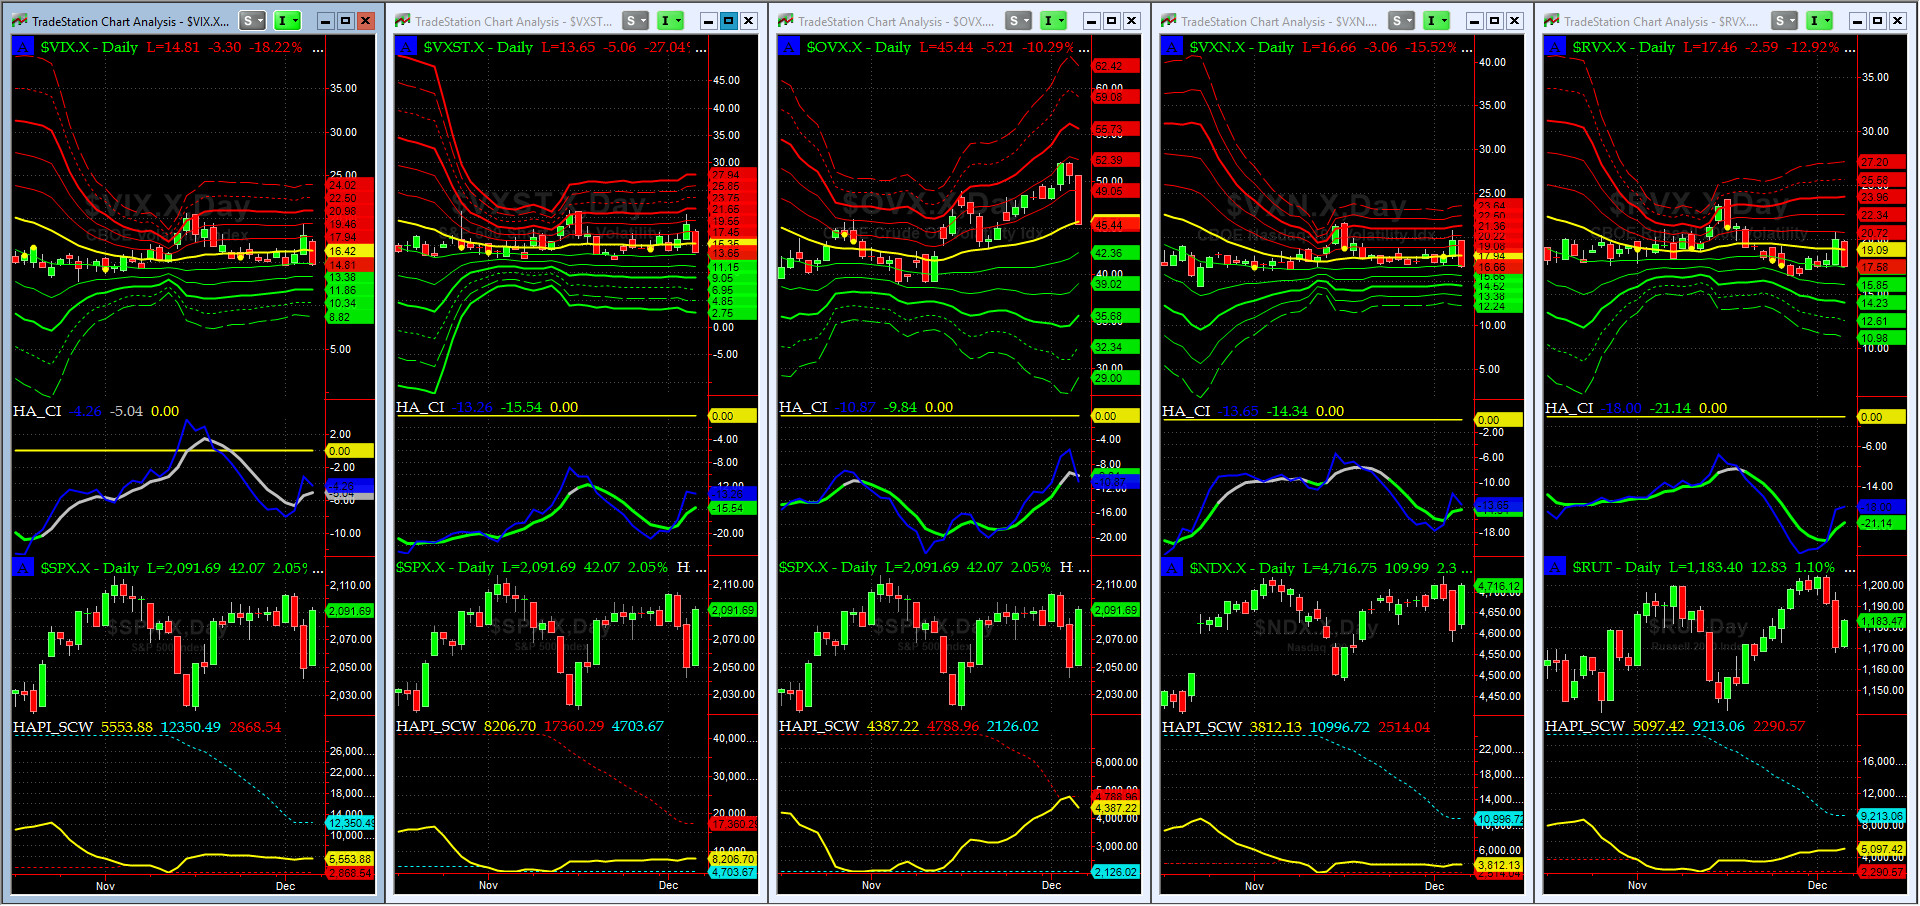
Vol of the Vols Chart
This past week, we had a two-day short-lived spike in equity indices' vols but only OVX (Crude Oil Volatility) continued to rise till Friday which ended with a sharp move down.
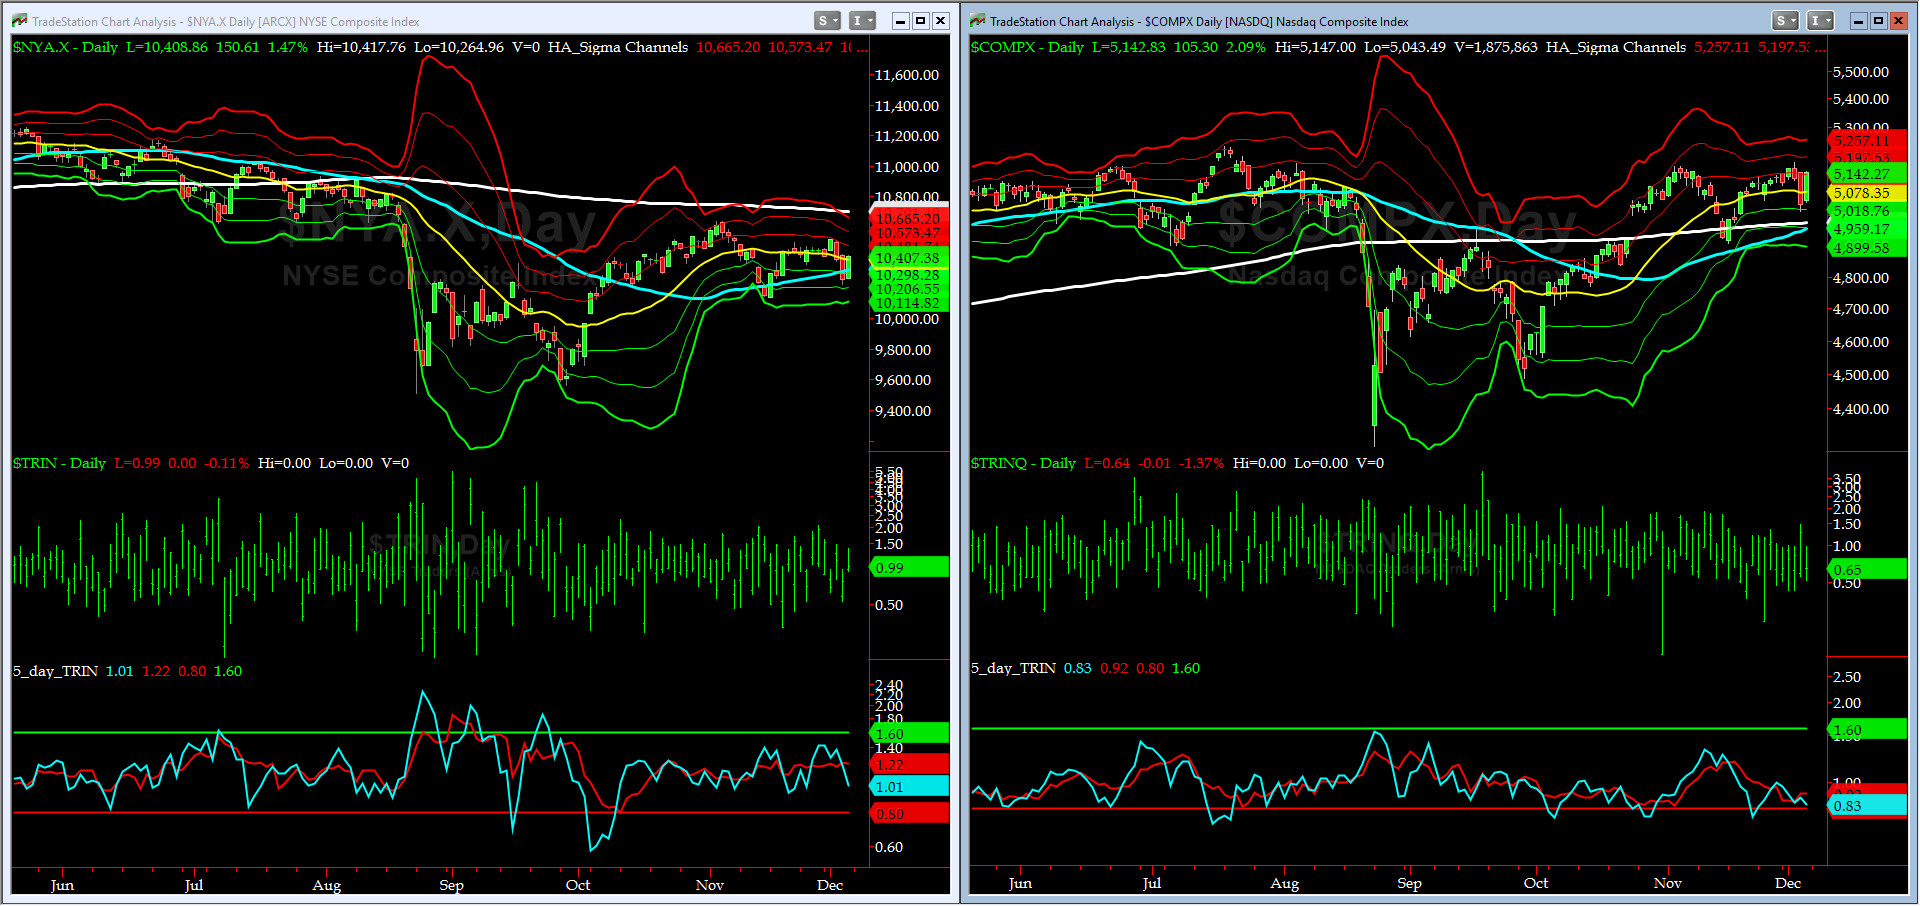
5-day TRIN & TRINQ Charts
As of Friday Close, the 5-day TRIN is neutral (about 1.0) while TRINQ is fast approaching the SELL zone (0.80 or lower).
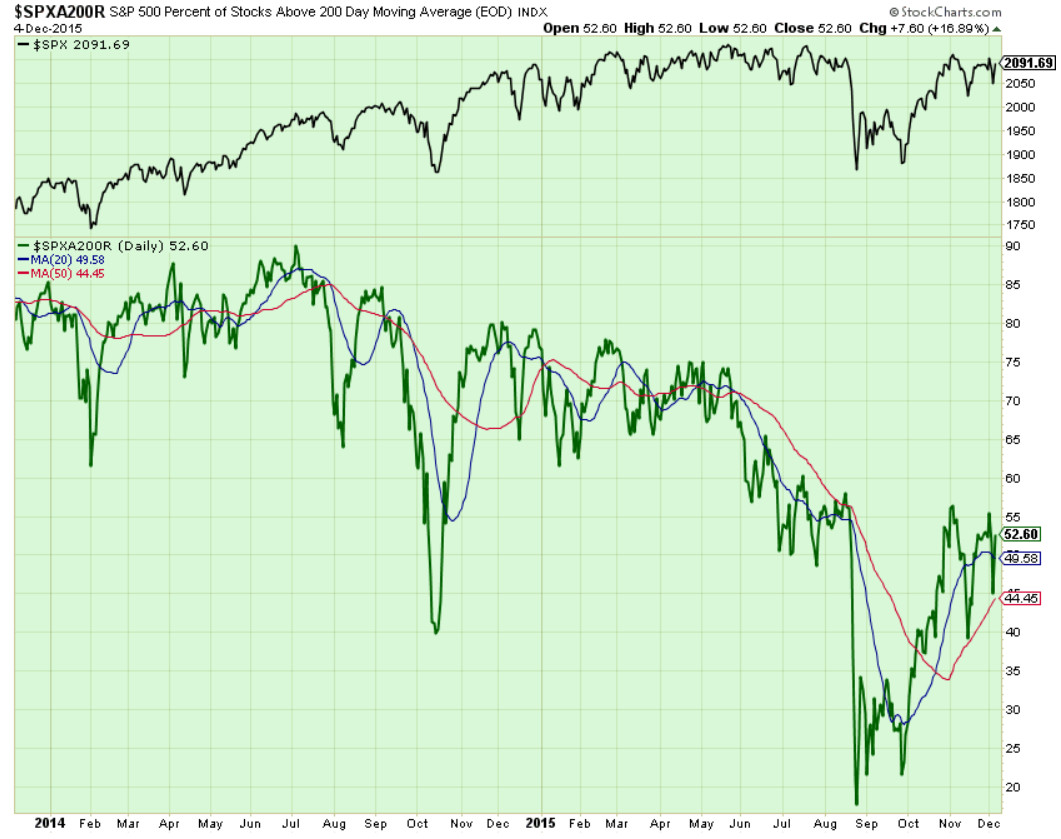
Components of SPX above their respective 200day MA Chart
We are again near 53% level after a sharp drop on Thursday and then a strong close above its 20Day MA last Friday. Next target is still 60%.
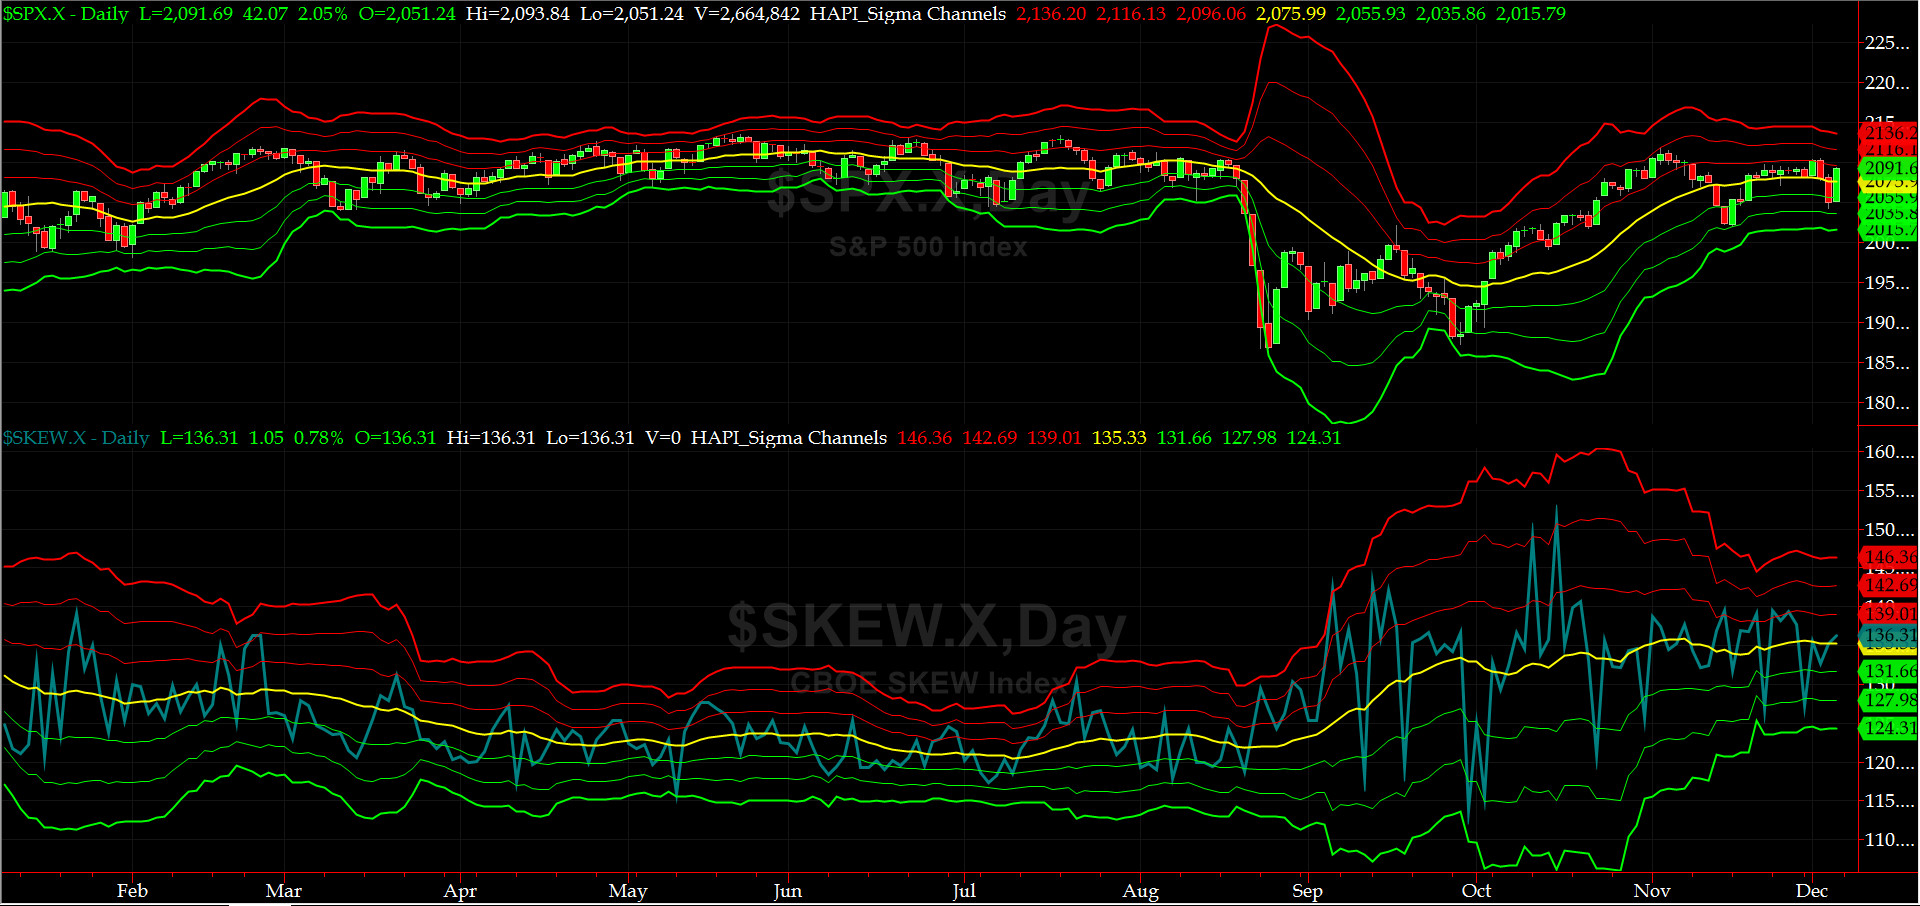
SPX SKEW (Tail Risk) Chart
After Friday Close, SPX SKEW (Tail Risk) dropped to 136 (at its zero sigma). With its Sigma Levels in a horizontal configuration (with slopes near zero), Tail Risk seems to have found a new level to cruise at. Is this the new normal? only time can tell. Time for more tea, sailors? ubetcha (in PaLingo LOL).
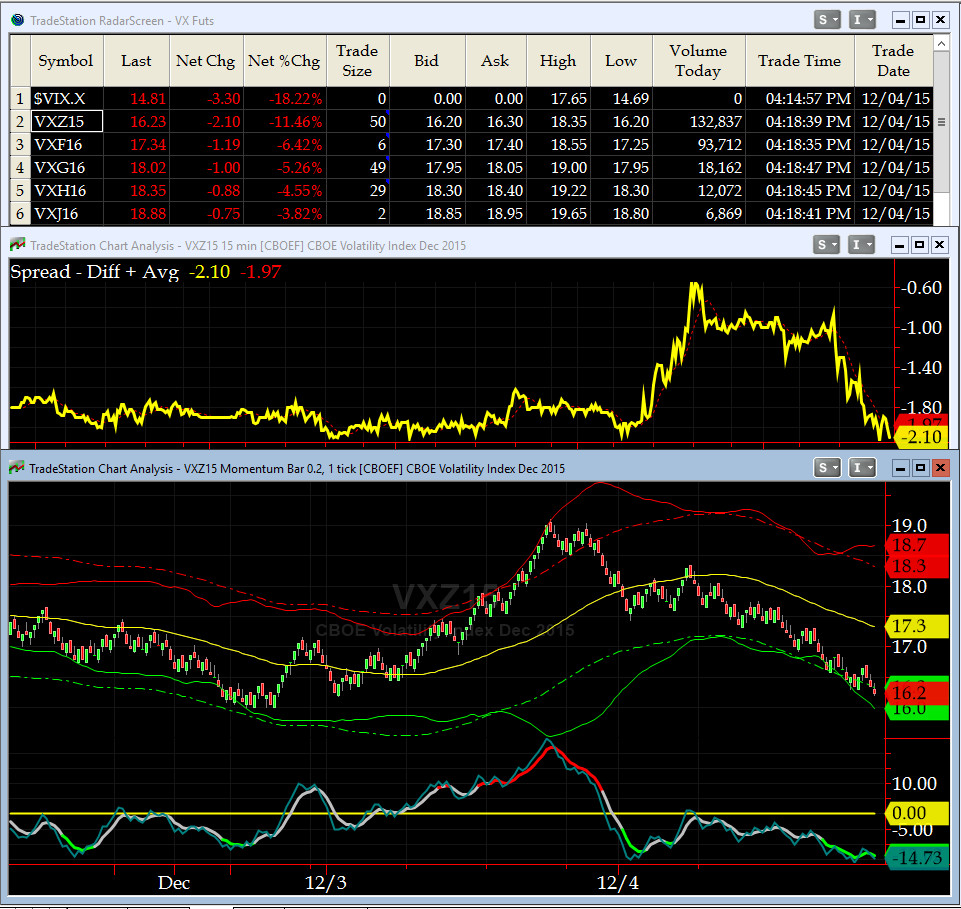
3-month VIX Futures Spread(VX) Chart
Our 3-month VIX Futures Spread (Long DEEZ15 Short MAR16), is now at -2.1 and making sure we pay attention to it when it nears -3.
HA_SP2 Chart
At 56, this prop indicator put in a major come back on Friday, and again, is shooting for overbought zone (80 plus) .
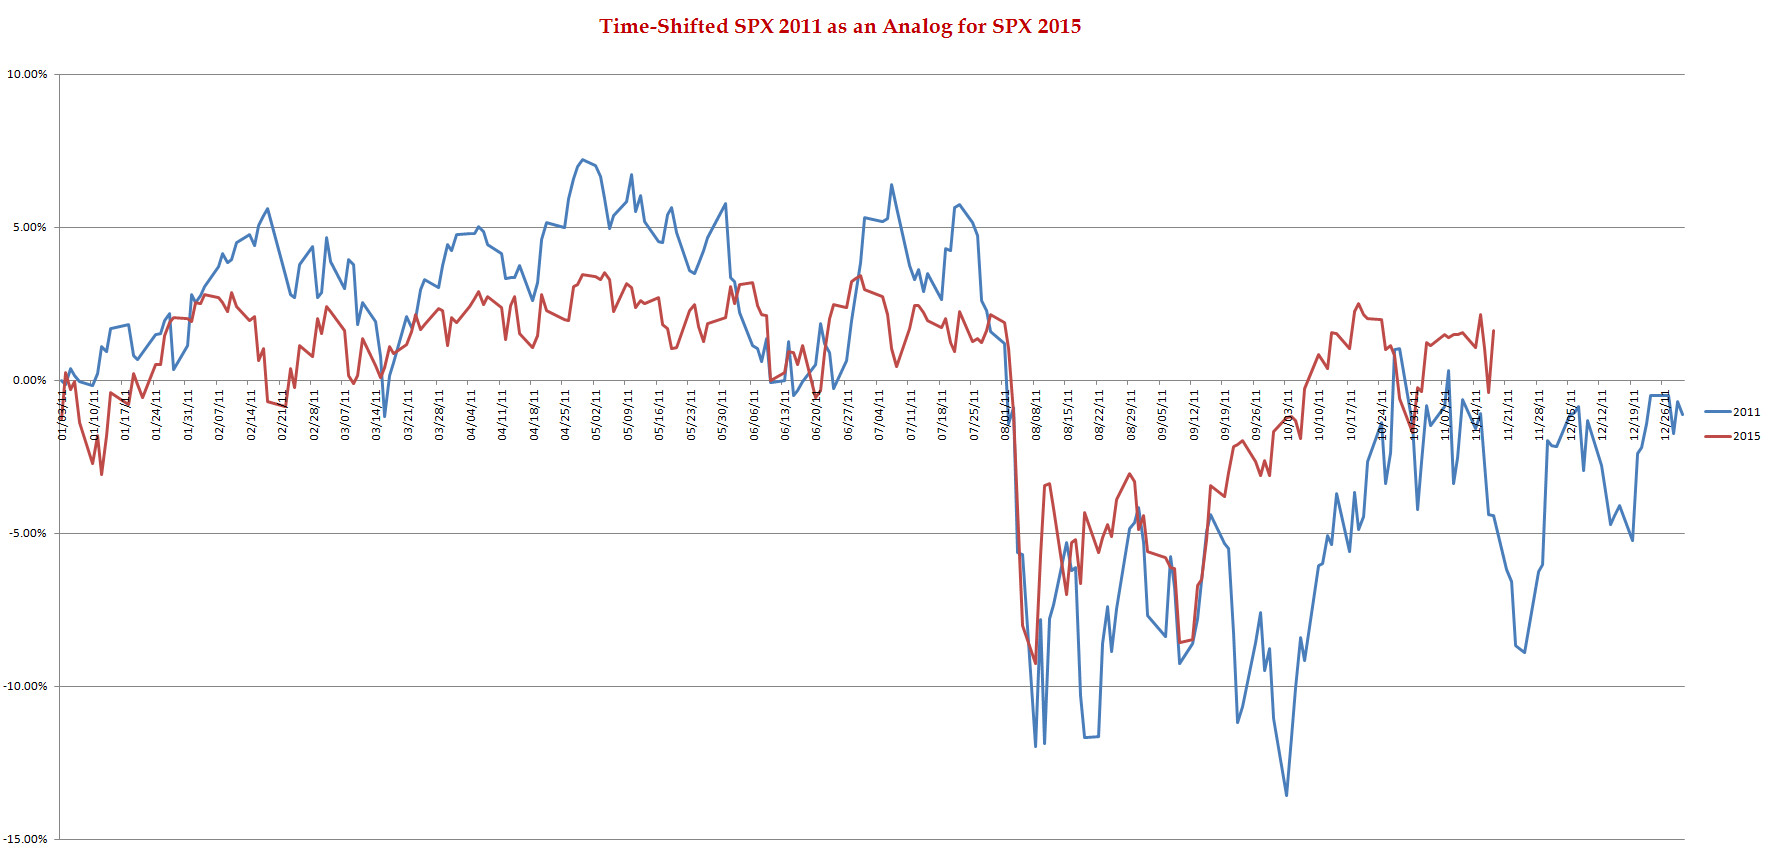
SPX 2011 Time-Shifted Analog for SPX 2015
It is too early, ioho, to fully, or partially dismiss, the Time-Shifted 2011 Analog Chart. We could still see a pullback, that combined with more negative exogenous news (ie, terrorism), can hurt our markets. But with Nov NFP behind us, the news from FED and/or econ data should be more supportive going into the Year End.
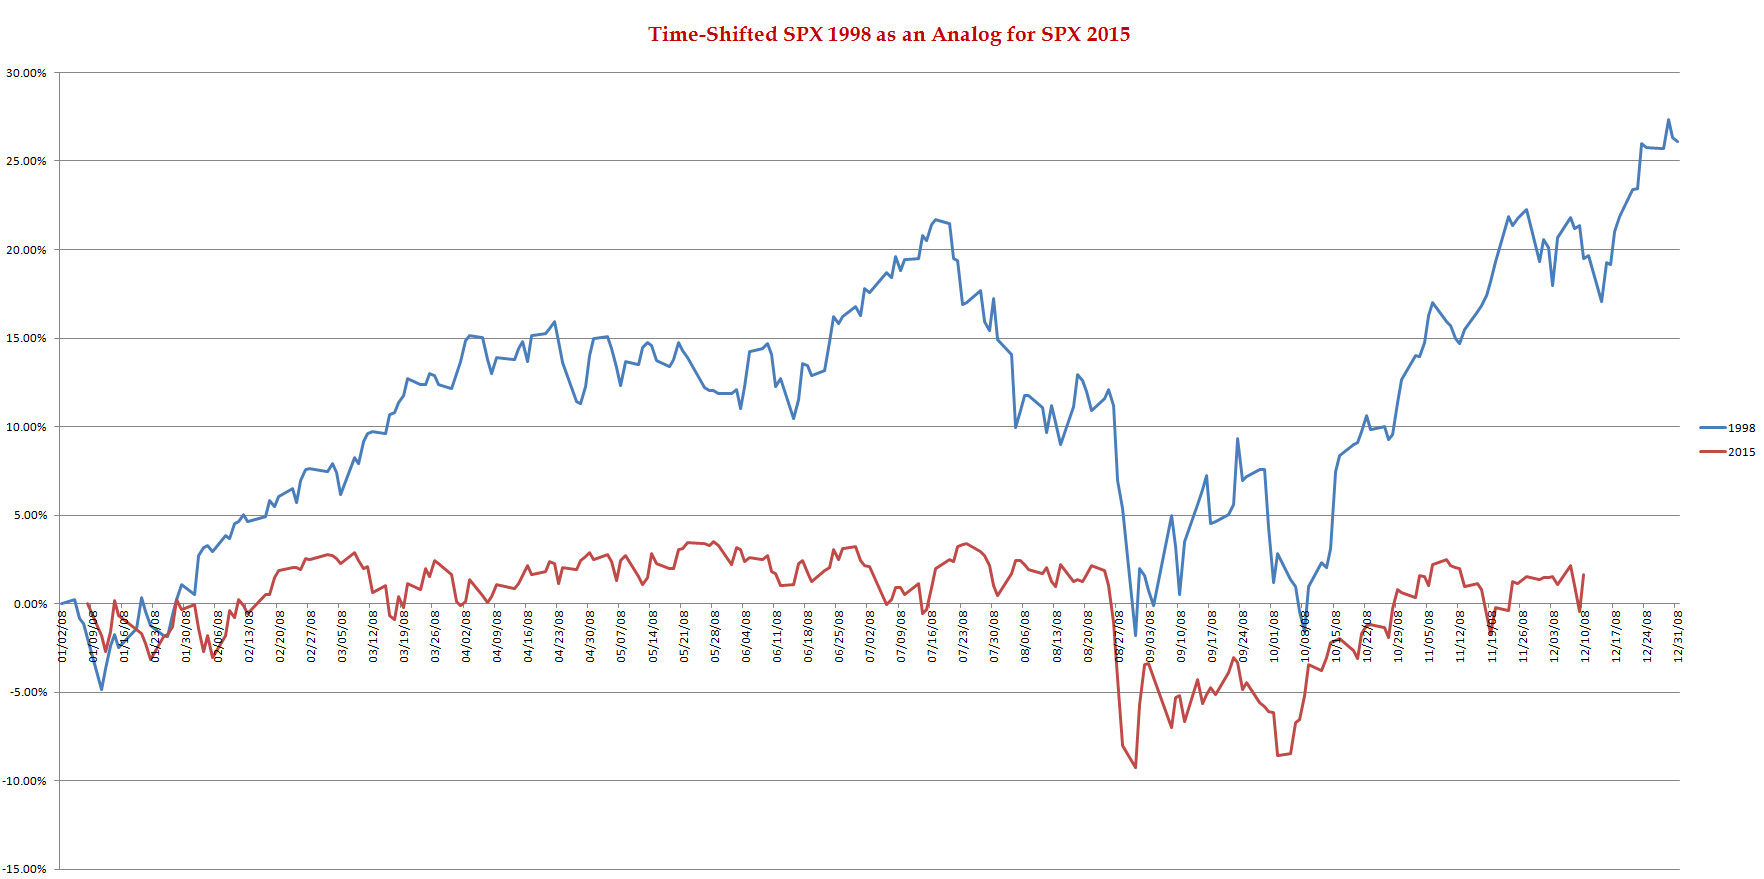
SPX 1998 Time-Shifted Analog for SPX 2015

US Treasury T-Notes & T-Bonds Yields Chart
This past week, the YTM for the front end of Treasury Yield Curve continued to rise to just below its December's MONTHLY Resistance 1 Level (2.19%) while the longer-dated paper managed to rise a tad above their respective December MONTHLY Resistance 1 Levels.
Good luck this week,
Fari Hamzei
|
|
|
|
|
|
Customer Care:
|
|
|
|
|
|
|
 |
 |
|
 |
|
 |
 |
 |
HA YouTube Channel ::: HA Blog ::: Testimonials ::: Tutorials & FAQs ::: Privacy Policy
|
Trading Derivatives (Options & Futures) contains substantial risk and is not for every investor. An investor could potentially lose all or more than his/her initial investment.
Only risk capital should be used for trading and only those with sufficient risk capital should consider trading derivatives. Past performance is not
necessarily indicative of future results. Testimonials appearing on this website may not be representative of other clients or customers
and are not a guarantee of future performance or success.
|
| (c) 1998-2025, Hamzei Analytics, LLC.® All Rights Reserved. |
|
|