
|
 |
 |
 |
 |
 |
 |
 |
 |
 Proactive Market Timing Proactive Market Timing
|
|
|
Most Recent PMT vs SPX Performance Chart

|
|
|
|
Wednesday, December 23, 2015, 2100ET

SPX 2011 Time-Shifted Analog for SPX 2015
The Time-Shifted 2011 Analog Chart, in its final 5 trading days of the year, still shows that we might have another leg down. IOHO, the probability of that event is rather low.
Merry Xmas to You & Yours.....
Fari Hamzei
|
|
|
|
|
|
Tuesday, December 22, 2015, 0030ET
Updated Bias
On Monday, SPX closed at 2021.15
This WEEK�s Bias = LONG SPX or SPY via CallSpreads
Profit Target = 2060-2070
Money Management Stop = 2005
|
|
|
|
|
|
Monday, December 21, 2015, 1155ET
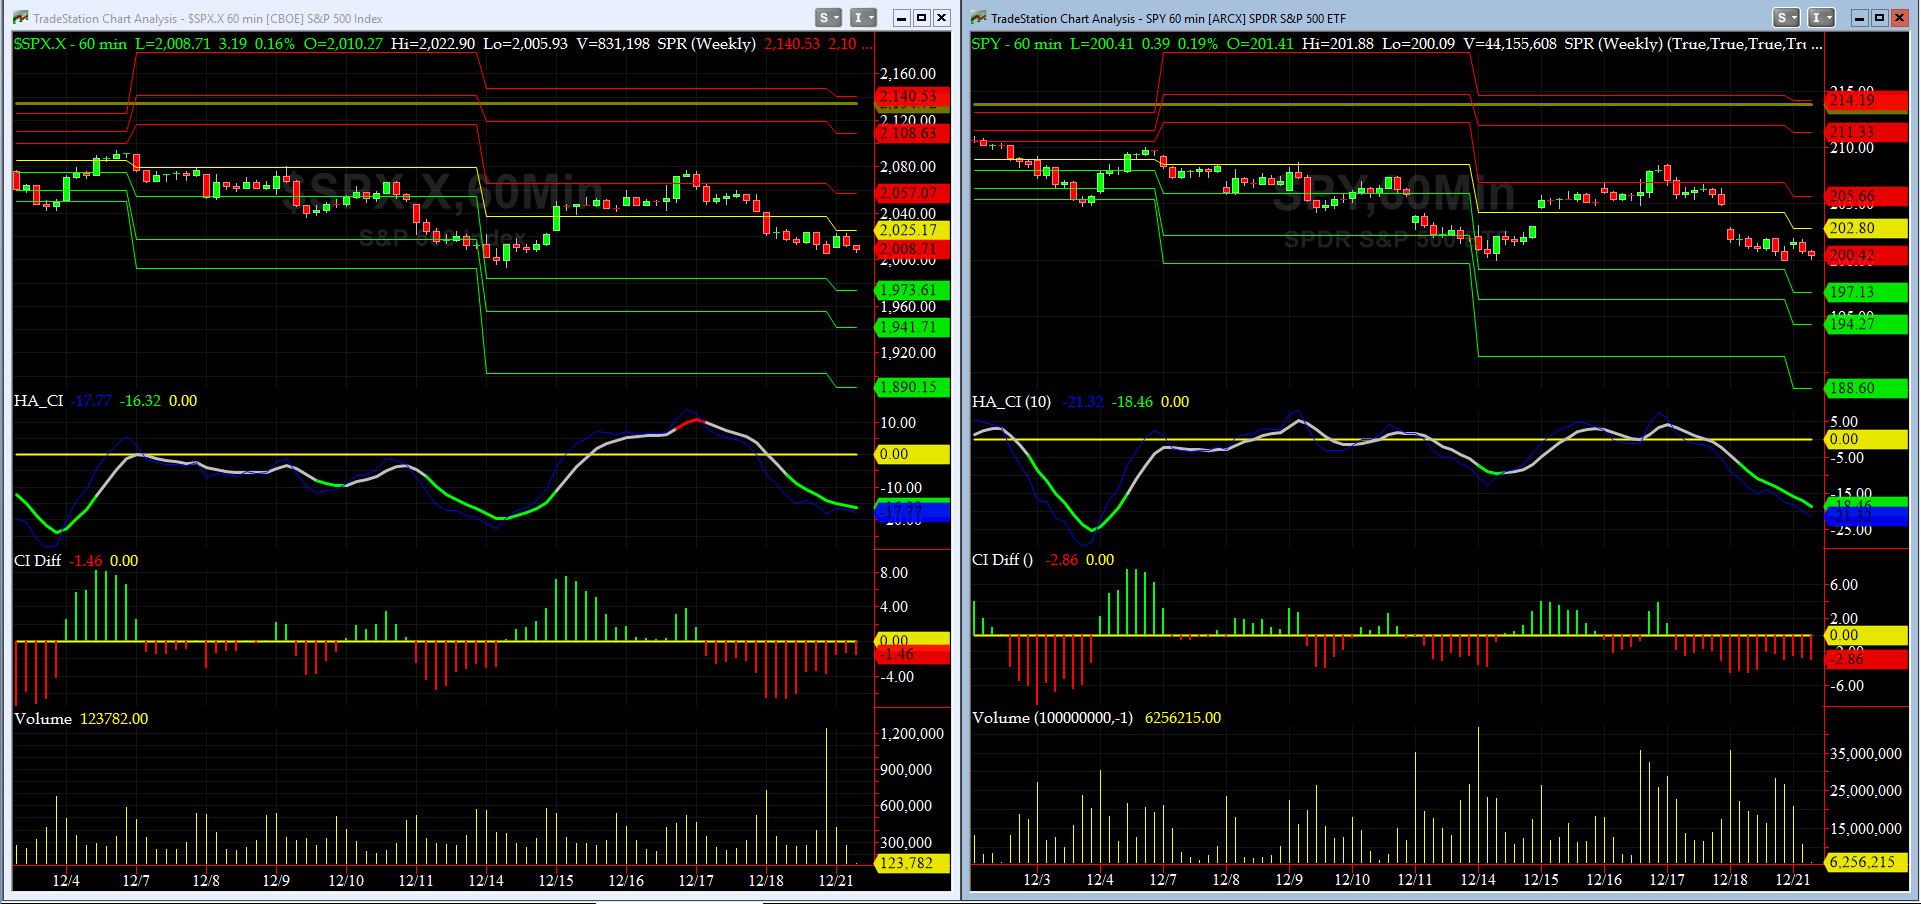
Companion Chart for Market Bias Review, Issue #123
|
|
|
|
|
|
Sunday Night, December 20, 2015, 2100ET
Market Bias Review, Issue #123
Most recent S&P-500 Cash Index (SPX): 2005.55 down -6.82 (down -0.034%) for the week ending on Friday, December 18th, 2015, which closed near its -2 sigma.
SPX ALL TIME INTRADAY HIGH = 2134.72 (reached on Wednesday, May 20th, 2015)
SPX ALL TIME CLOSING HIGH = 2130.82 (reached on Thursday, May 21st, 2015)
Current DAILY +2 Sigma SPX = 2120 with WEEKLY +2 Sigma = 2141
Current DAILY 0 Sigma (20 day MA) SPX = 2064 with WEEKLY 0 Sigma = 2023
Current DAILY -2 Sigma SPX = 2009 with WEEKLY -2 Sigma = 1905
50-Day MA SPX =2061 or -2.7% above SPX (max observed in last 5 yrs = +8.6%, min = -9.3% )
200-Day MA SPX = 2062 or -2.7% above SPX (max observed in last 5 yrs = 15.2%, min = -14%)
VIX = 20.7 which closed Friday over its +1 sigma (remember it�s the VIX�s vol pattern (its sigma channels) that matters, and not the level of VIX itself (this is per Dr. Robert Whaley, a great mentor and the inventor of original VIX, now called VXO. VIX usually peaks around a test of its +4 sigma))
NYSE McClellan Oscillator = -98.5 (-150 is start of the O/S area; around -275 to -300 area or lower, we go into the �launch-pad� mode, over +150, we are in O/B area)
NYSE Breadth Thrust = 43.4 (40 is considered as oversold and 65 as overbought)
WEEKLY Timing Model = on a BUY Signal since Friday 11/27/15 CLOSE
DAILY Timing Model = on a SELL Signal since Thursday 12/3/15 CLOSE
Max SPX 52wk-highs reading last week = 17 (over 120-140, the local maxima is in)
Max SPX 52wk-Lows reading last week = 52 (over 40-60, the local minima is in)
HA_SP1 = near its -2 Sigma
HA_Momo = -5.97 (reversals most likely occur above +10 or below -10)
HA_SP2 = 32.4 (Buy signal <= 20, Sell Signal >= 80)
3-mo. VX Futures Spread (long JAN short APR) = -0.43 (-3 to -2.5 SELL signal, 0 BUY Signal)
SPX SKEW (Tail Risk) = 131.2 (normal = 120-125, range 100-150)
Our current SPX Bias with Timer Digest: LONG SPX as of Tuesday, October 20th, 2015 Close at 2030.77
Our previous Bias: SHORT SPX (since Tuesday, October 6th, 2015 Close at 1979.92)
This WEEK�s Bias = NEUTRAL for 1 to 2 days
Profit Target = N/A
Money Management Stop = N/A
BOTTOM LINE: We are hunting for a tradable bottom. It could be Monday or Tuesday. We will update you here. My co-pilot, @Capt_Tiko, is stocking up on Foumanat Tea.....
NOTE: All LEVELS mentioned here have been, are, and will be, based on the S&P-500 SPX Cash Index, and not the ES Futures. Tomorrow after the first hour is complete, we will post here a companion chart showing critical short-term WEEKLY levels to watch for possible �retest failures.�
Fari Hamzei
|
|
|
|
|
|
Saturday, December 19, 1500ET
Market Timing Charts & Comments
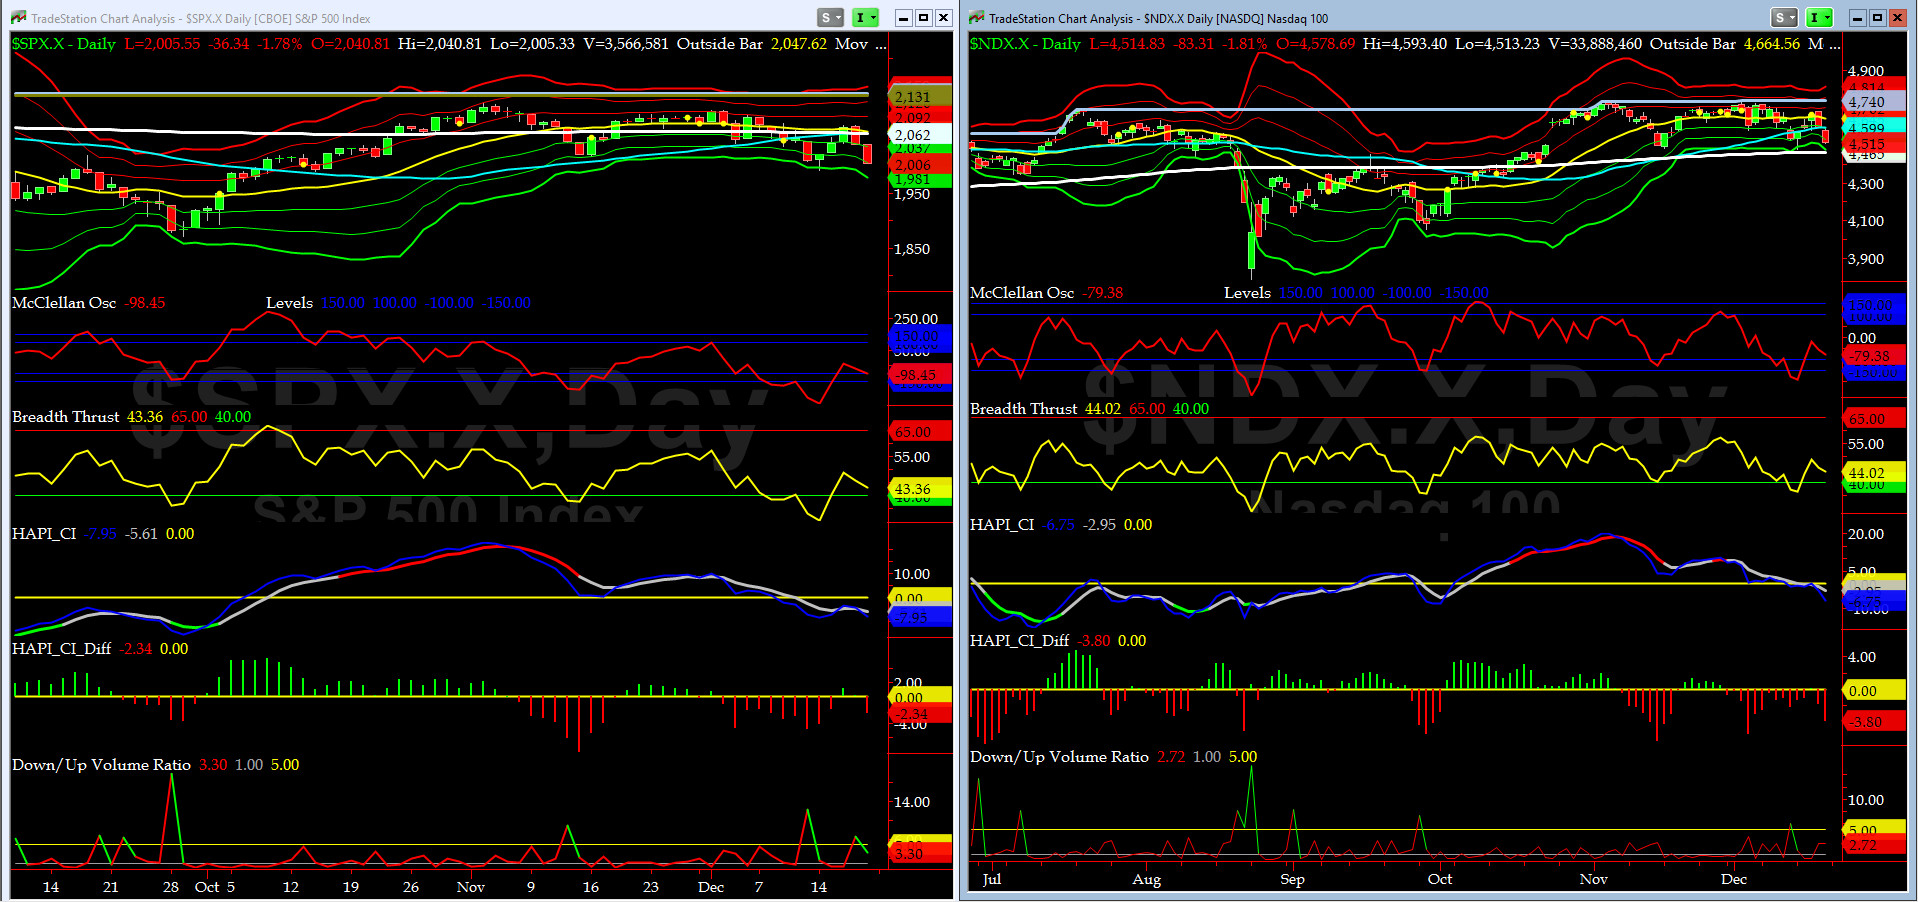
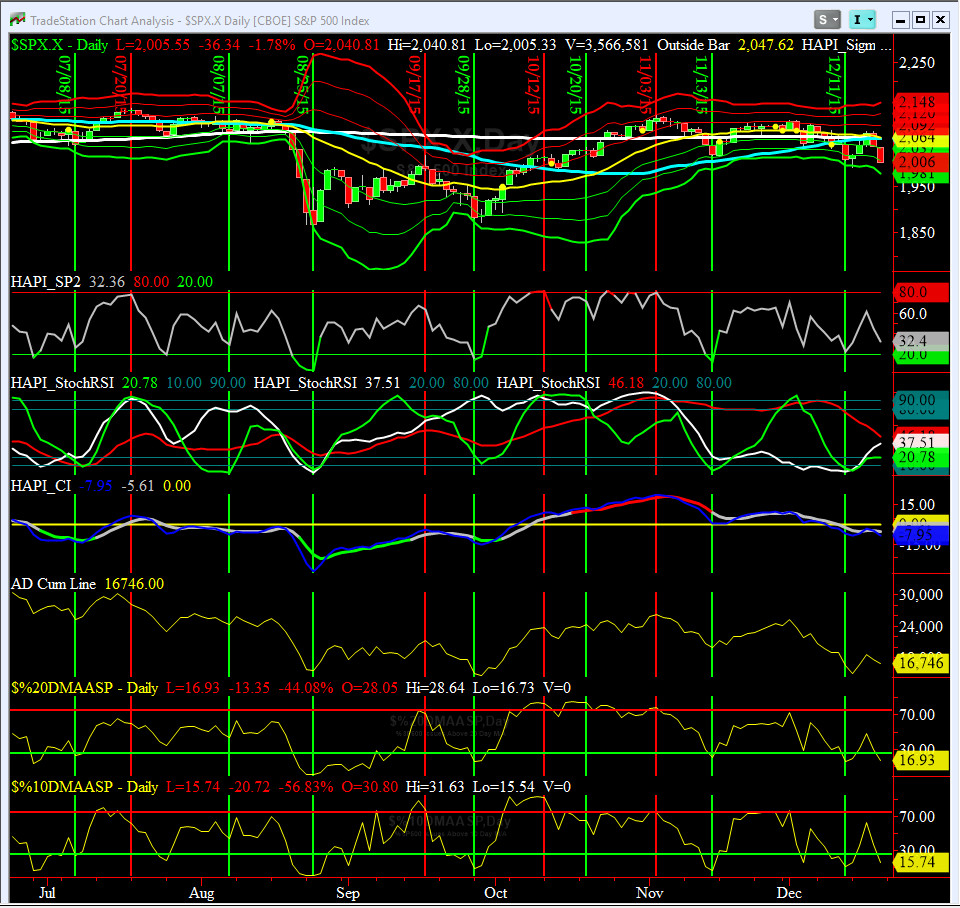
Timer Chart of S&P-500 Cash Index (SPX)
Two days of strong selling, post FED�s first interest rise in nearly 10 years, has pushed our breadth and momentum indicators into a moderately oversold condition.
We should witness a short-term buy opportunity late Monday, or early Tuesday, in the SPX Complex. Bullish Divergences are developing in both McClellan Oscillator and Breadth Thrust for both NYSE and NASDAQ markets.
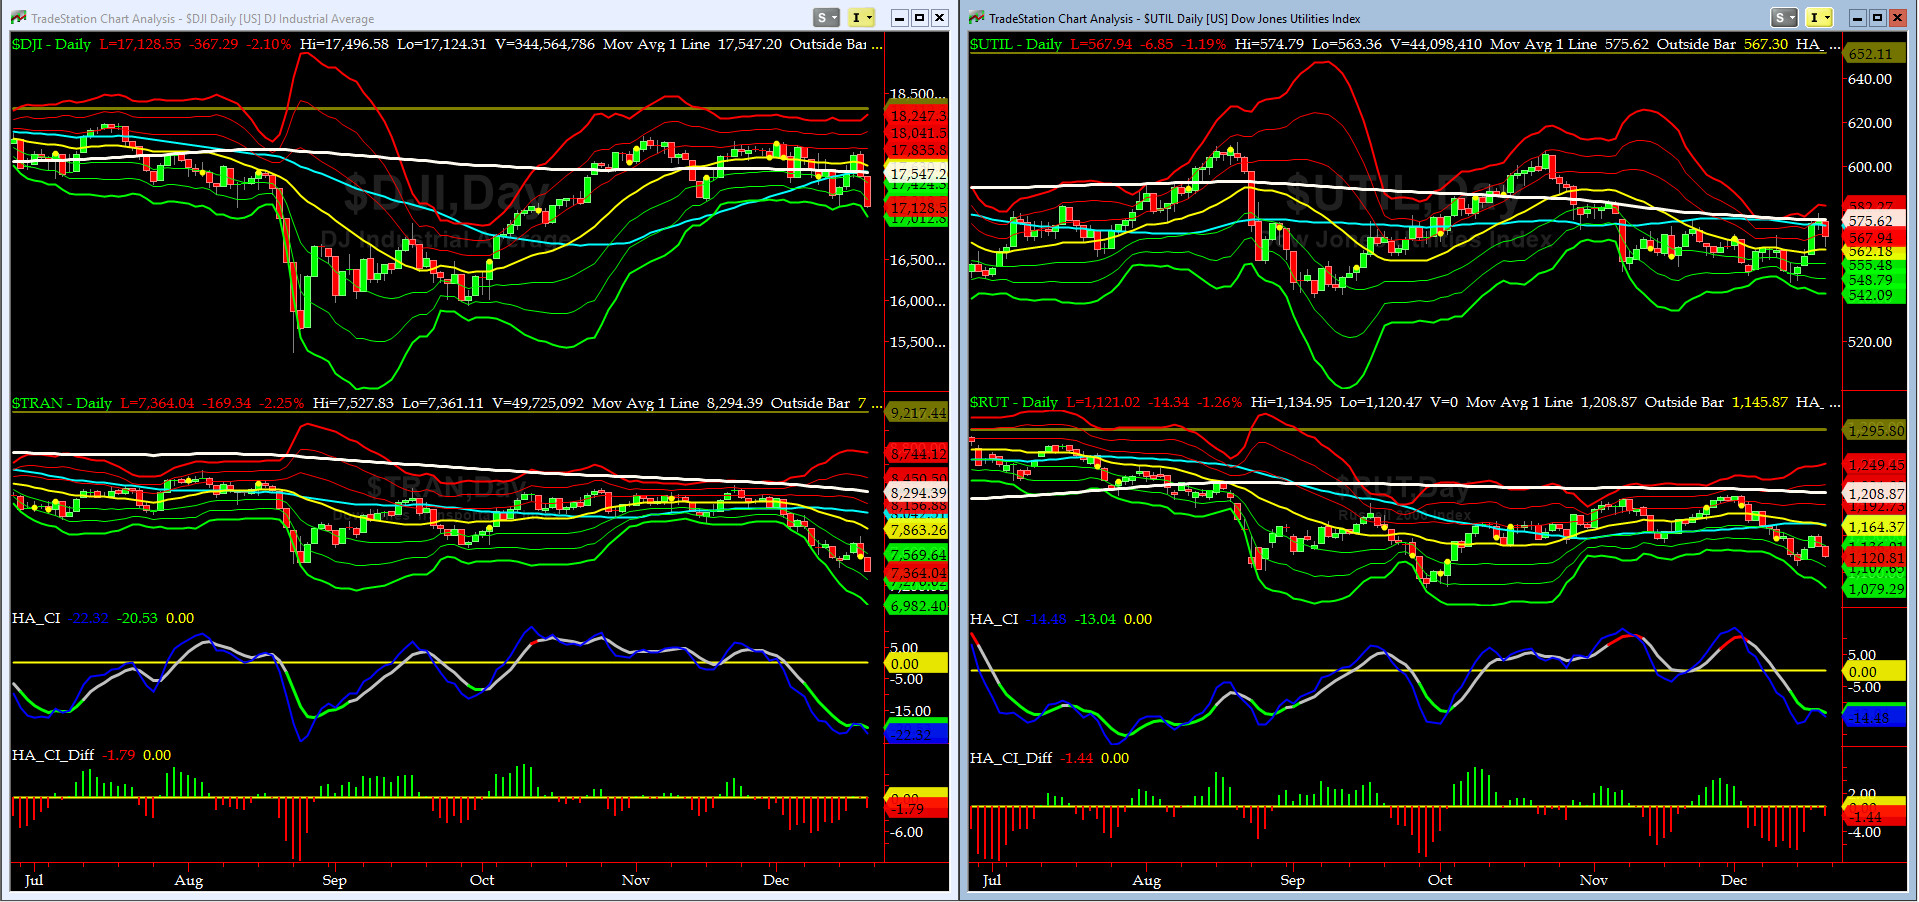
Canaries [in the Coal Mine] Chart for DJ TRAN & RUT Indices
On Thursday, both the DJ Transports (proxy for economic conditions 6 to 9 months hence) & Russell 2000 Small Caps (proxy for RISK ON/OFF), began forming LBR Flag Patterns. This has a potential for lower equity prices further down the road. RISK continues to be OFF for now.
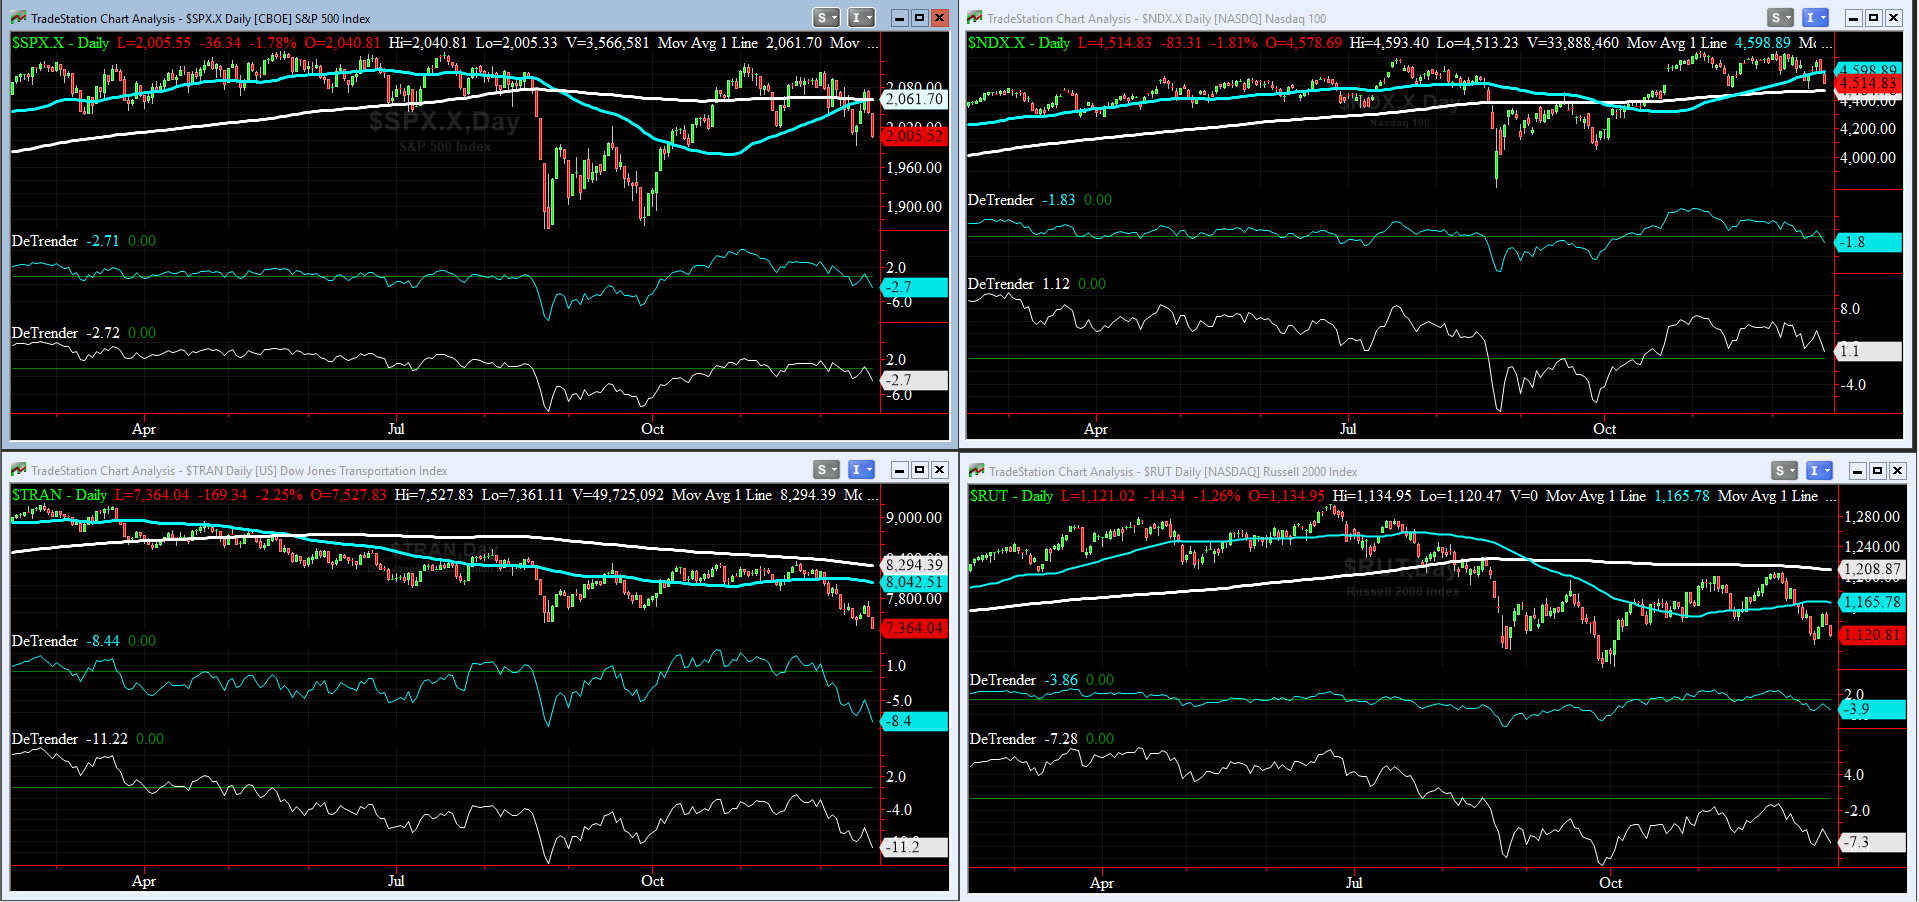
DeTrenders Charts for SPX, NDX, TRAN & RUT Indices
Much like a week ago, as of Friday Close, SEVEN out of our EIGHT 50DTs & 200DTs are negative, while only NDX 200DT is remaining positive.
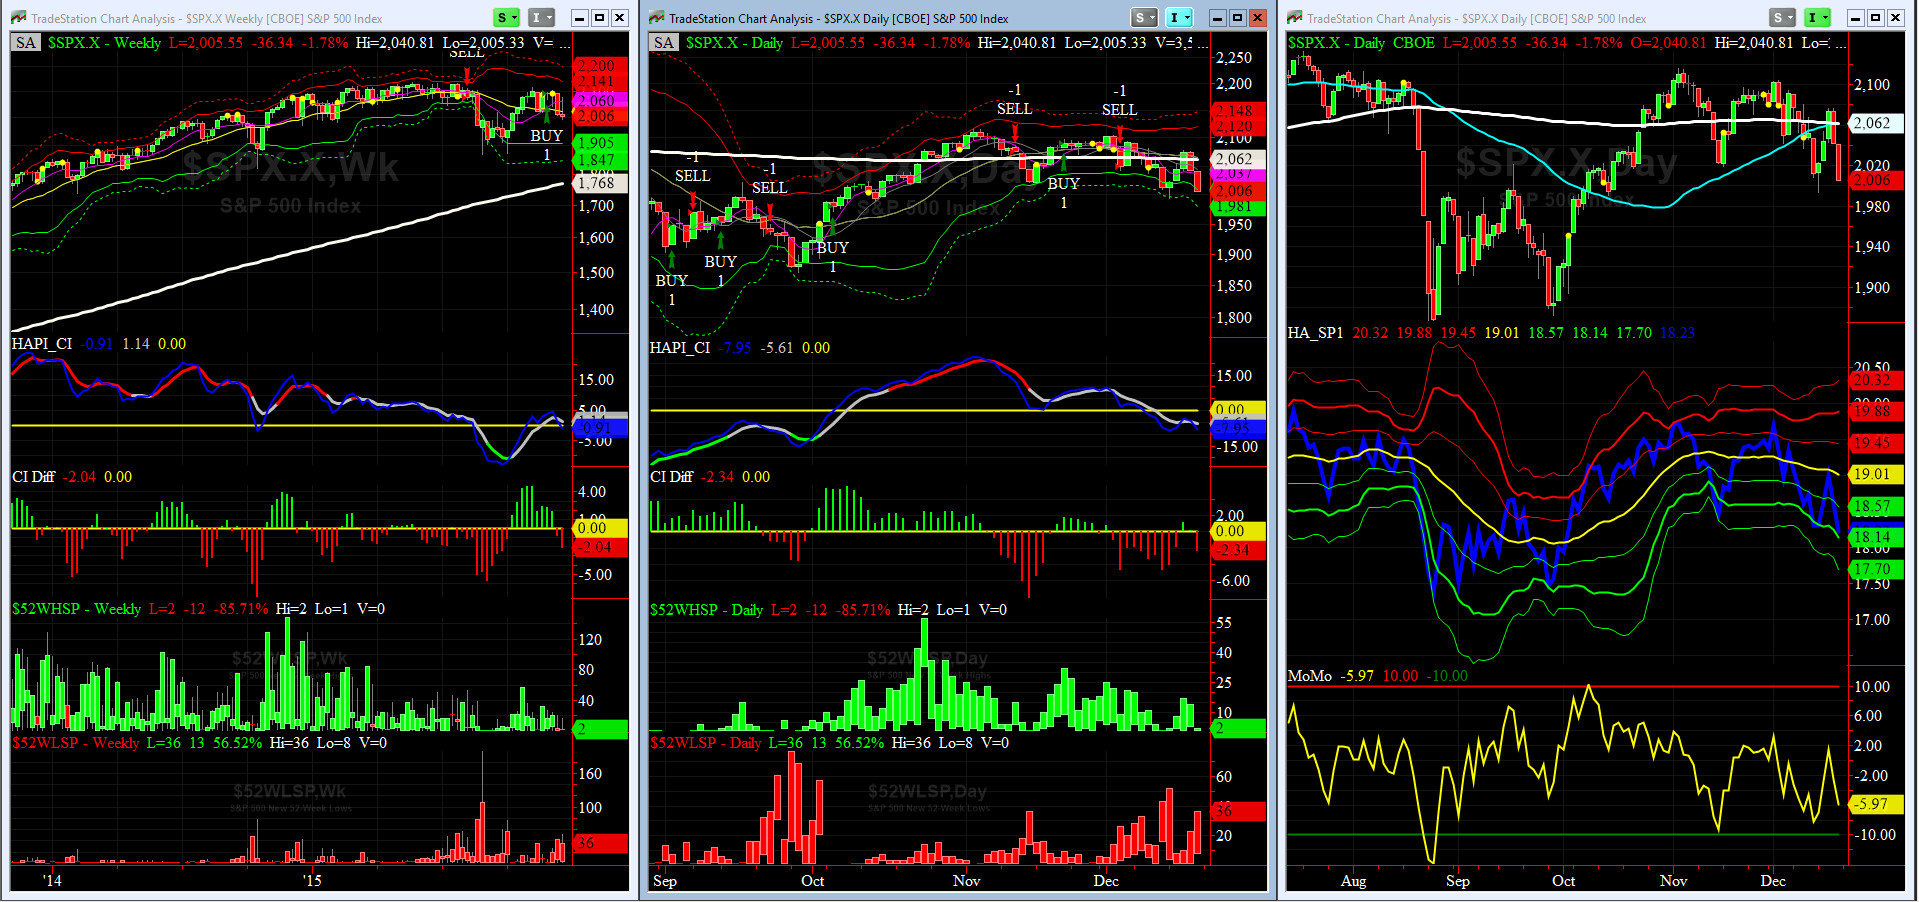
HA_SP1_momo Chart
Our WEEKLY Timing Model remains on a BUY while our DAILY Timing Model is on a SELL.
HA_SP1 remains around its -2 sigma & HA_momo is now at -6. The new 52wk lows for SPX eased off a bit to 36 (40 is generally accepted as the threshold for reversal).
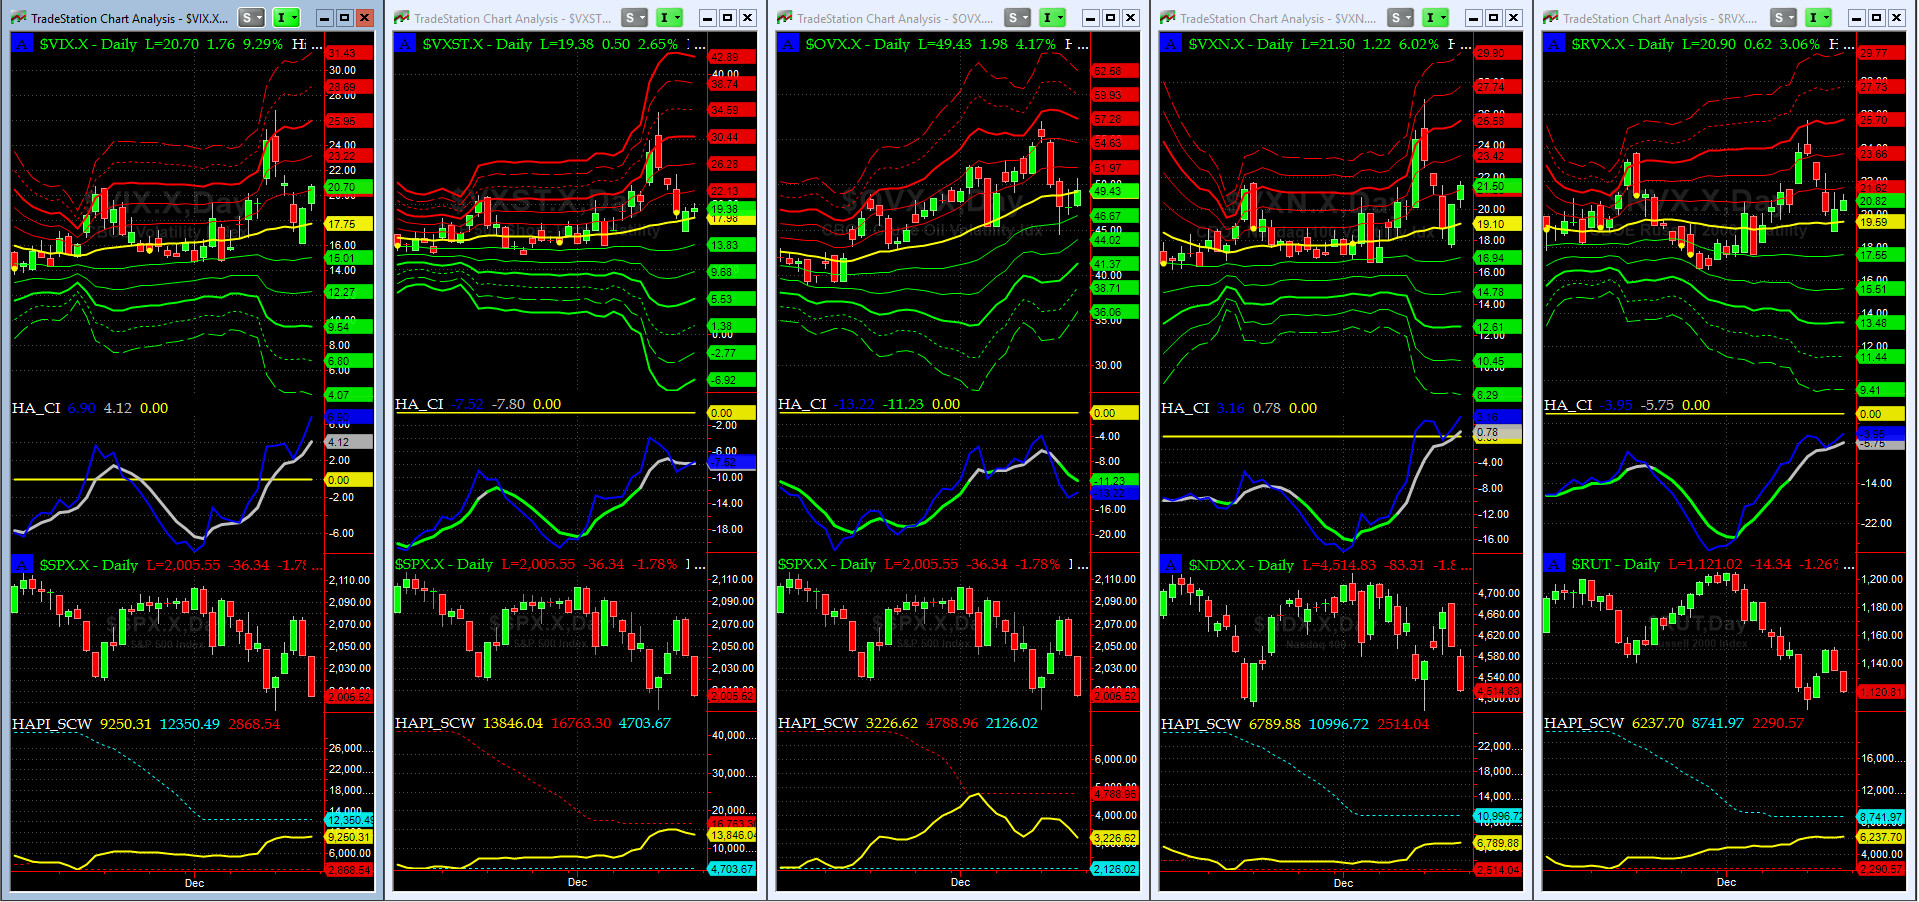
Vol of the Vols Chart
Much like our last week's comments, this chart shows that final vol shockwave for 2015 is still in progress. We need to see a +4, or better yet, a +5 sigma reading in VIX to call it over. Stay tuned.
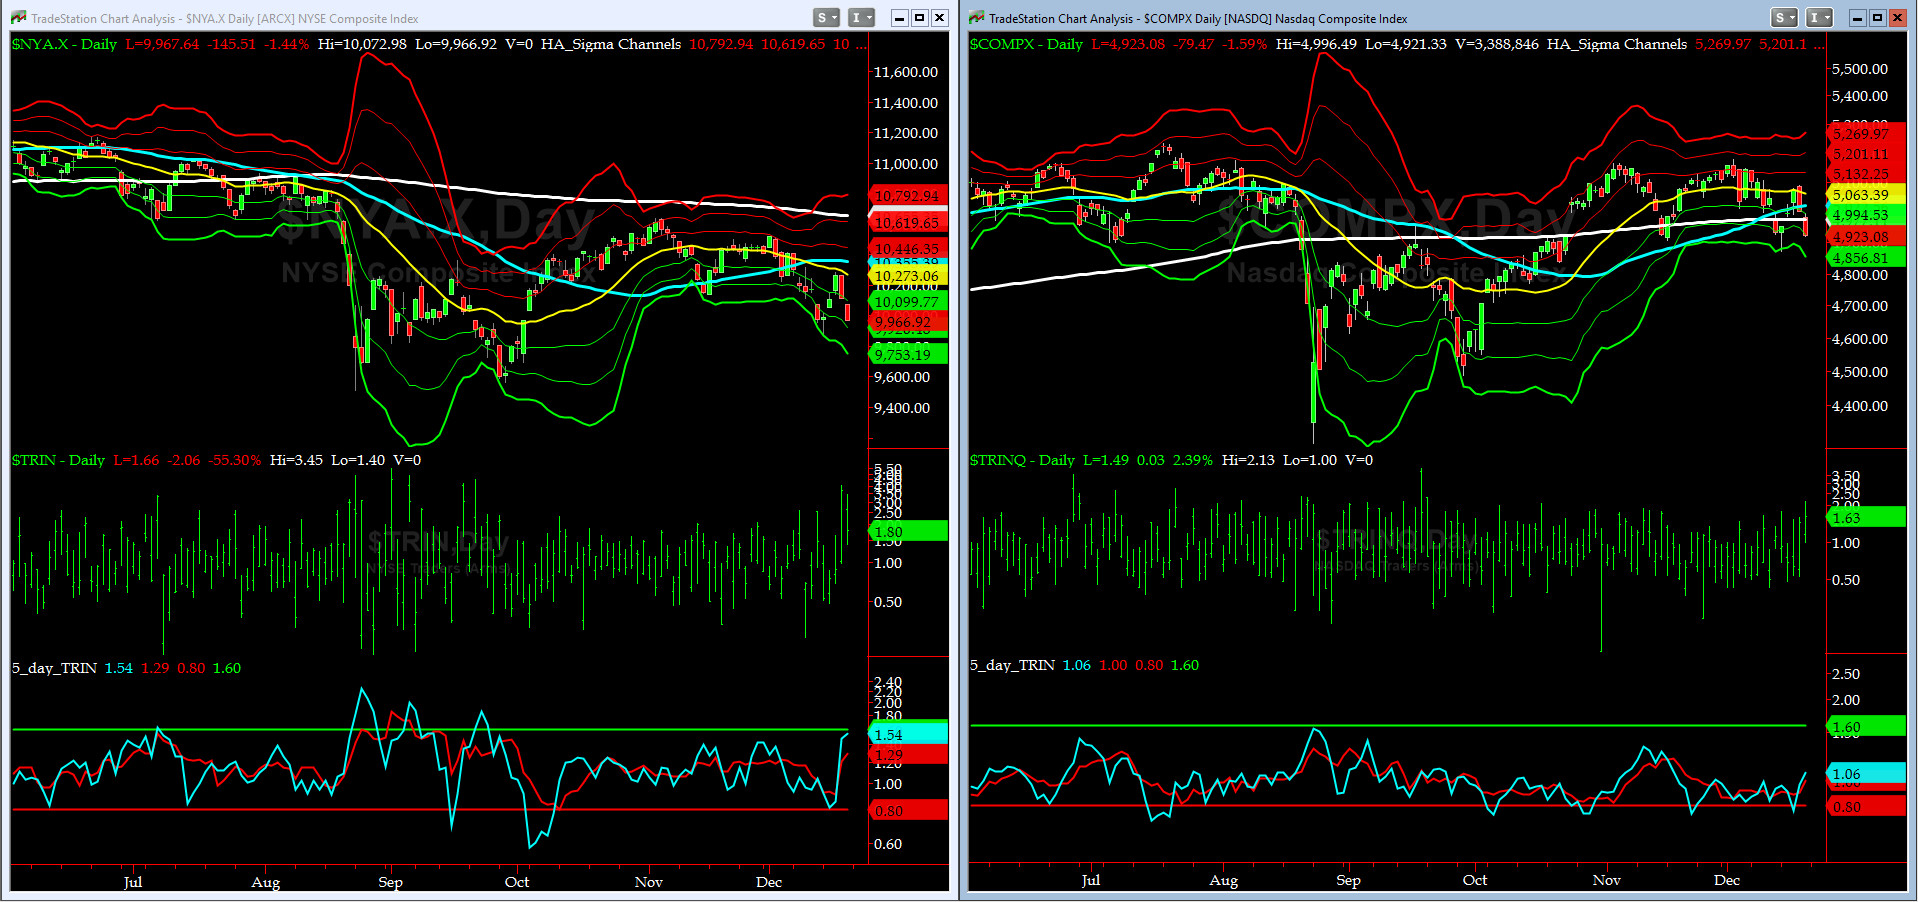
5-day TRIN & TRINQ Charts
As of Friday Close, the 5-day TRIN (for NYSE) is very near a BUY signal with a 1.54 reading, while TRINQ (for NASDAQ) is neutral with a 1.06 reading.
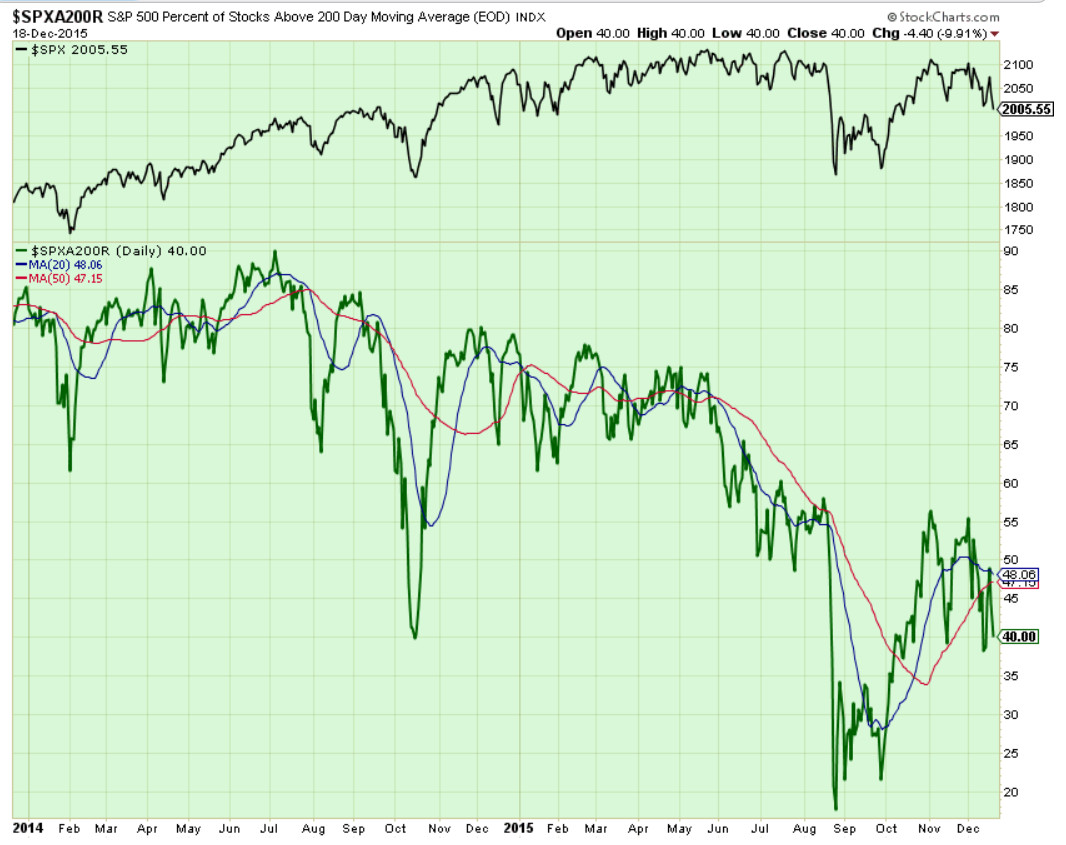
Components of SPX above their respective 200day MA Chart
This scoring indicator, last week, rose to near 50%, then broke down to settle at 40% on Friday. As before, if we do NOT bounce back, next target is 20% to 25% zone.
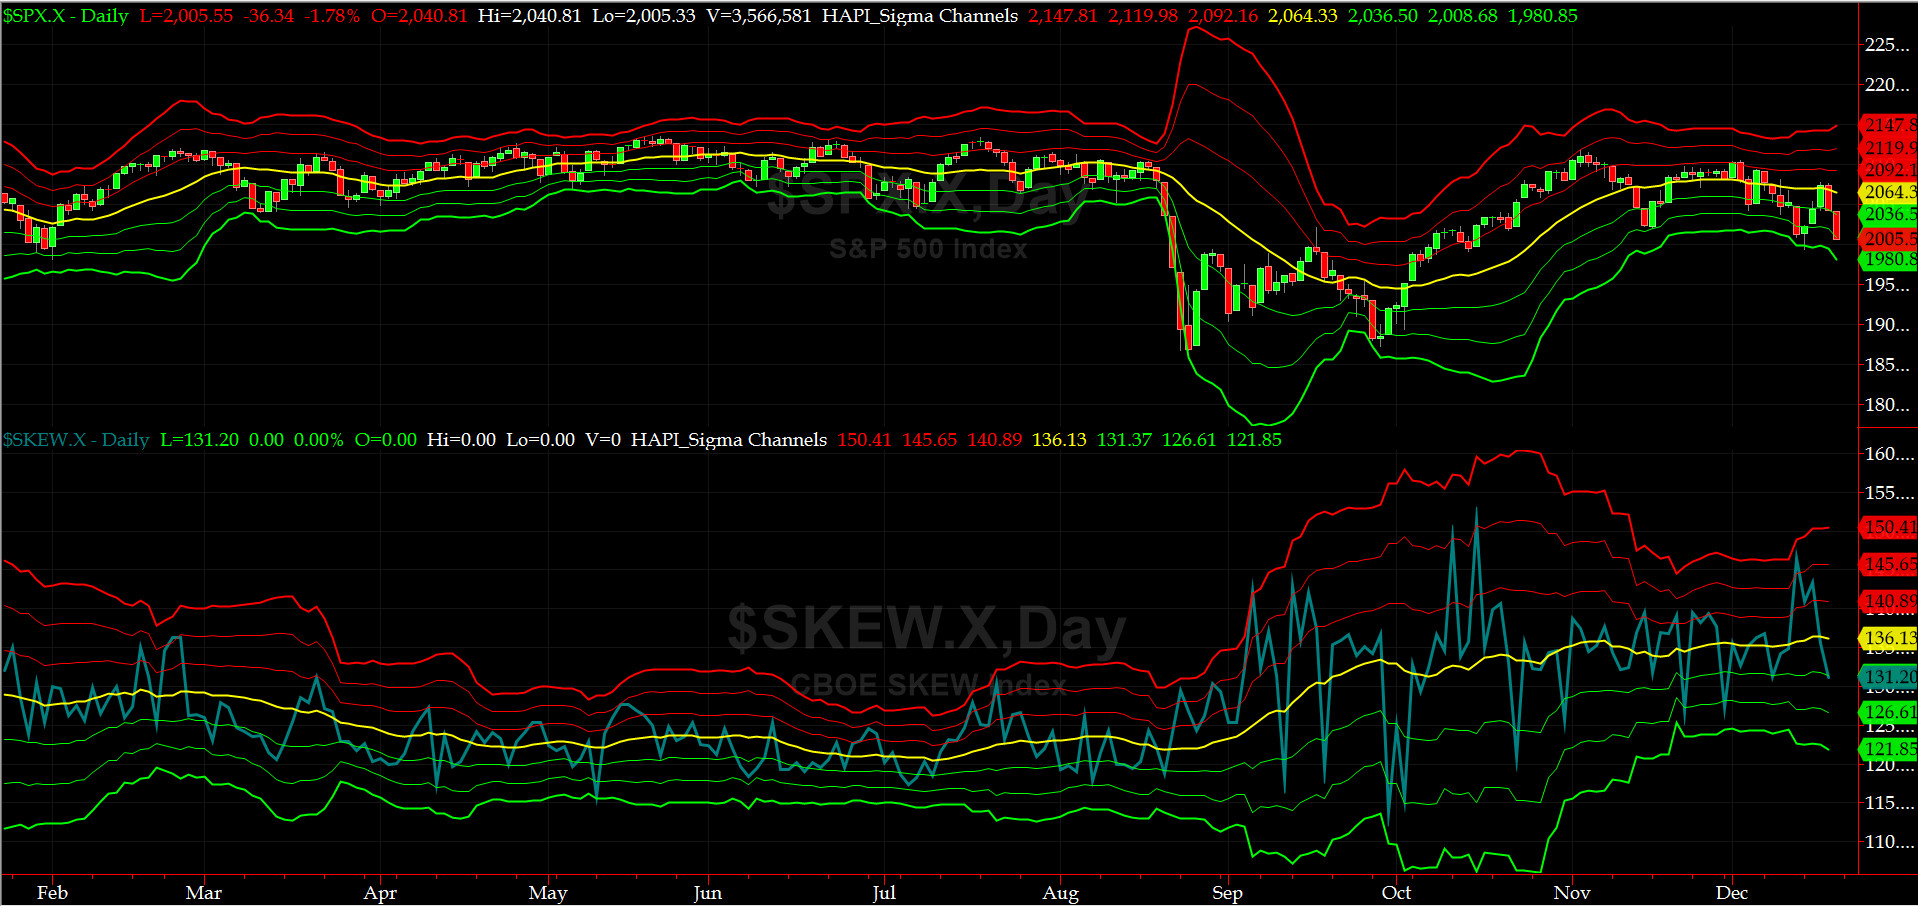
SPX SKEW (Tail Risk) Chart
After Thursday Close (SKEW was NOT published last Friday [by CBOE]), SPX SKEW (Tail Risk) plummeted to 131.2 (its -1 sigma). As predicted in the last issue, with final FOMC and OX for CY 2015, we observed very interesting readings in SPX SKEW. Needless to say, my co-pilot, @Capt_Tiko, was glued to the screens for each daily SPX SKEW settlement data.
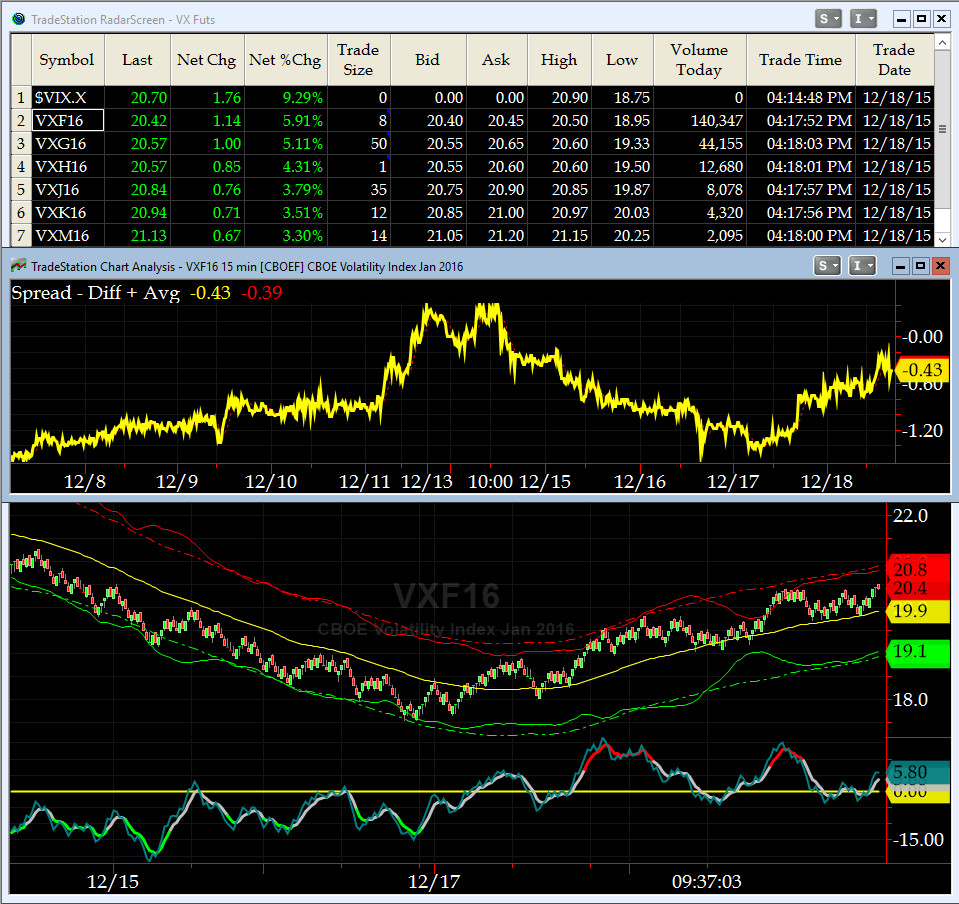
3-month VIX Futures Spread(VX) Chart
Our 3-month VIX Futures Spread (Long JAN16 Short APR16), closed at -0.43 on Friday (again, this indicator is saying the short-term low is very close).
HA_SP2 Chart
At 32, this prop indicator is near its OverSold zone (20 or lower).
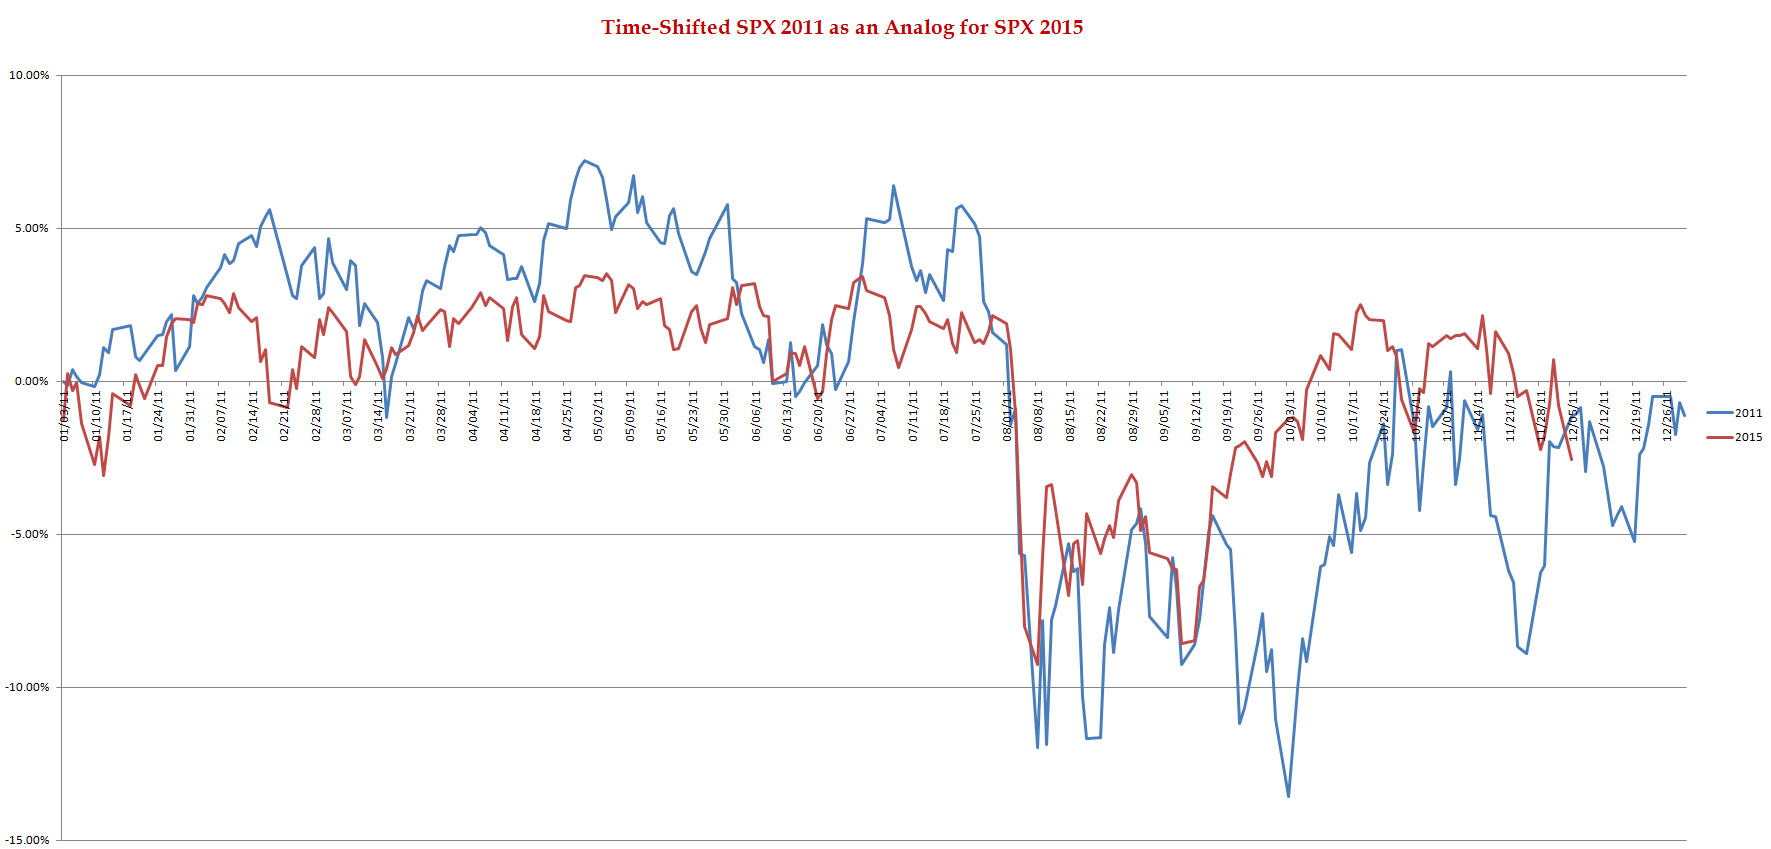
SPX 2011 Time-Shifted Analog for SPX 2015
The Time-Shifted 2011 Analog Chart, in its final waning days, shows that we might have another leg down after a bounce early this week. As we say in the NAVY, fasten your harnesses. Sailors, the ride into the New Year could get rather bumpy.
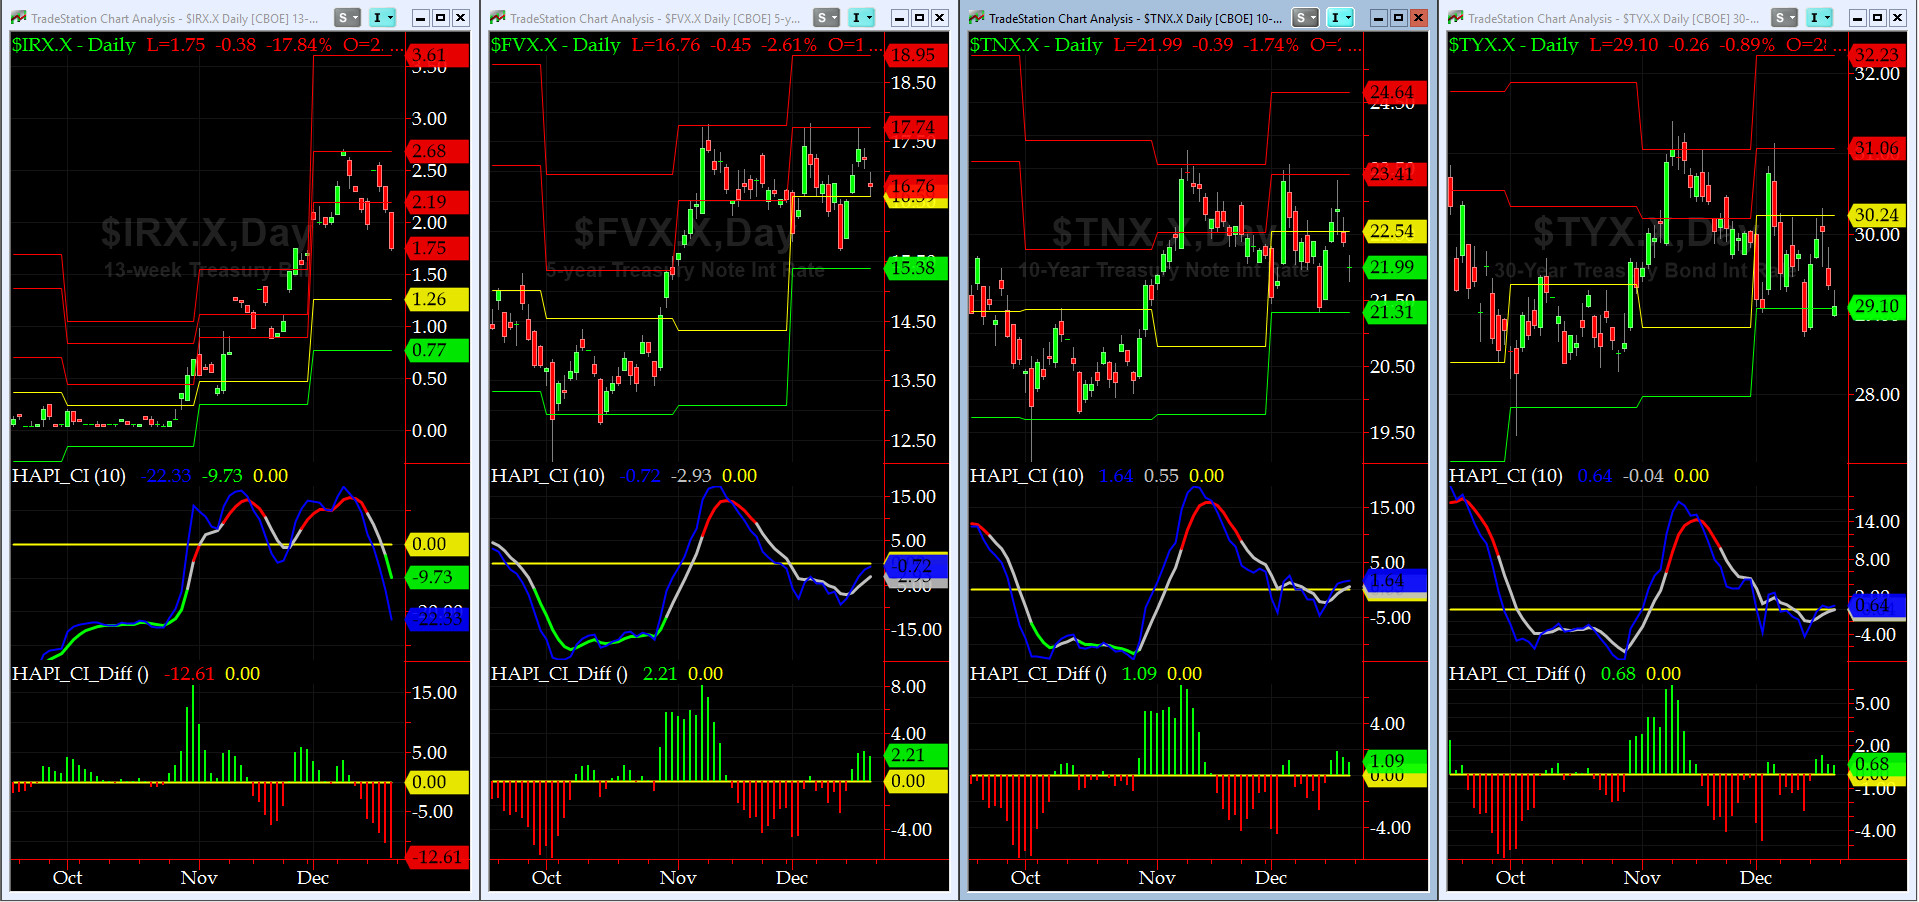
US Treasury T-Notes & T-Bonds Yields Chart
This past week, the 91-day Discount Rate dropped while the rest of Yield Curve rose.
Good luck this week,
Fari Hamzei
|
|
|
|
|
|
Customer Care:
|
|
|
|
|
|
|
|
|
|


