
|
 |
 |
 |
 |
 |
 |
 |
 |
 Proactive Market Timing Proactive Market Timing
|
|
|
Most Recent PMT vs SPX Performance Chart

|
|
|
|
Wednesday, January 13, 2016, 2230ET
Market Commentary
After a careful review of tonight's settlement data & a number of our prop indicators, combined with a few short chats with key traders in Chicago & Manhattan, we have concluded that we are uber oversold to change our bias now. Therefore, we are staying the course at least till Monday night (US Markets are closed for MLK Birthday.)
Fari Hamzei
|
|
|
|
|
|
Wednesday, January 13, 2016, 1500ET
Sharing some Updated Internals from our HFT OTF Chatroom
Fari_Hamzei [13:43:24 CT]: DJ TRAN DT is below -18% we have not seen it this bad since Oct 2011 // remember that is when we had a FED intervention in the ES market
Fari_Hamzei [13:43:46 CT]: PPT could be going to DEFCON 2 now...... imho
Fari_Hamzei [13:45:54 CT]: NYSE McClellan Osc is -272 now // Down to Up Volume is 12.5 to 1 // HA_momo -8.9 // HA_SP2 is 16 and all three StochRSI are below 5 // "launch pad" mode is in progress
Fari Hamzei
|
|
|
|
|
|
Tuesday, January 12, 2016, 2300ET
China Data
China December Trade data came in solid tonight....
- Exports +2.3% vs cons -4.1%
- Imports -4.0% vs cons -7.9%
Trade balance came in at $382.05bn vs cons $338.8bn
That's helping futures tonight.
source: Credit-Suisse
We are STAYING LONG SPX & SPY for now....
Our SPX Profit Targets are, initially 1975, and then, 1990-2010,
While moving up our Money Management Stop to 1925.
Fari Hamzei
|
|
|
|
|
|
Monday, January 11, 2016, 1100ET
Companion Chart for Market Bias Review, Issue #126
|
|
|
|
|
|
Sunday Night, January 10, 2016, 2345ET
Market Bias Review, Issue #126
Most recent S&P-500 Cash Index (SPX): 1922.03 down -121.91 (down -5.96%) for the week ending on Friday, January 8th, 2016, which closed at its -3 sigma for two days in a row.
SPX ALL TIME INTRADAY HIGH = 2134.72 (reached on Wednesday, May 20th, 2015)
SPX ALL TIME CLOSING HIGH = 2130.82 (reached on Thursday, May 21st, 2015)
Current DAILY +2 Sigma SPX = 2107 with WEEKLY +2 Sigma = 2136
Current DAILY 0 Sigma (20 day MA) SPX = 2028 with WEEKLY 0 Sigma = 2017
Current DAILY -2 Sigma SPX = 1949 with WEEKLY -2 Sigma = 1899
50-Day MA SPX =2059 or -6.6% above SPX (max observed in last 5 yrs = +8.6%, min = -9.3% )
200-Day MA SPX = 2058 or -6.6% above SPX (max observed in last 5 yrs = 15.2%, min = -14%)
VIX = 27 which is just above its +2 sigma (remember it�s the VIX�s vol pattern (its sigma channels) that matters, and not the level of VIX itself (this is per Dr. Robert Whaley, a great mentor and the inventor of original VIX, now called VXO. VIX usually peaks around a test of its +4 sigma))
NYSE McClellan Oscillator = -194 (-150 is start of the O/S area; around -275 to -300 area or lower, we go into the �launch-pad� mode, over +150, we are in O/B area)
NYSE Breadth Thrust = 36.6 (40 is considered as oversold and 65 as overbought)
WEEKLY Timing Model = on a BUY Signal since Friday 11/27/15 CLOSE
DAILY Timing Model = on a SELL Signal since Tuesday 1/05/16 CLOSE
Max SPX 52wk-highs reading last week = 91 (over 120-140, the local maxima is in)
Max SPX 52wk-Lows reading last week = 4 (over 40-60, the local minima is in)
HA_SP1 = near its -3 Sigma
HA_Momo = -10.64 (reversals most likely occur above +10 or below -10)
HA_SP2 = 11.98 (Buy signal <= 20, Sell Signal >= 80)
3-mo. VX Futures Spread (long JAN short APR) = +3.2 (-3 to -2.5 SELL signal, 0 BUY Signal)
SPX SKEW (Tail Risk) = 139 which is near its +0.5 sigma (normal = 120-125, range 100-150)
Our current SPX Bias with Timer Digest: LONG SPX as of Thursday, January 7, 2016 Close at 1922.03
Our previous Bias: SHORT SPX (as of Thursday, December 24th, 2015 Close at 2060.99)
This WEEK�s Bias = Cautiously LONG SPX or SPY via Calls Spreads for next 2 weeks
Profit Target = 1980
Money Management Stop = 1900
BOTTOM LINE: The stock market is EXTREMELY oversold based on our short-term momentum and breadth indicators� Jan expiration week has an up bias and we should run up the wall of worry from here.
NOTE: All LEVELS mentioned here have been, are, and will be, based on the S&P-500 SPX Cash Index, and not the ES Futures. Tomorrow after the first hour is complete, we will post here a companion chart showing critical short-term WEEKLY levels to watch for possible �retest failures.�
Fari Hamzei
|
|
|
|
|
|
Sunday, January 10, 2016 0200ET
Market Timing Charts & Comments
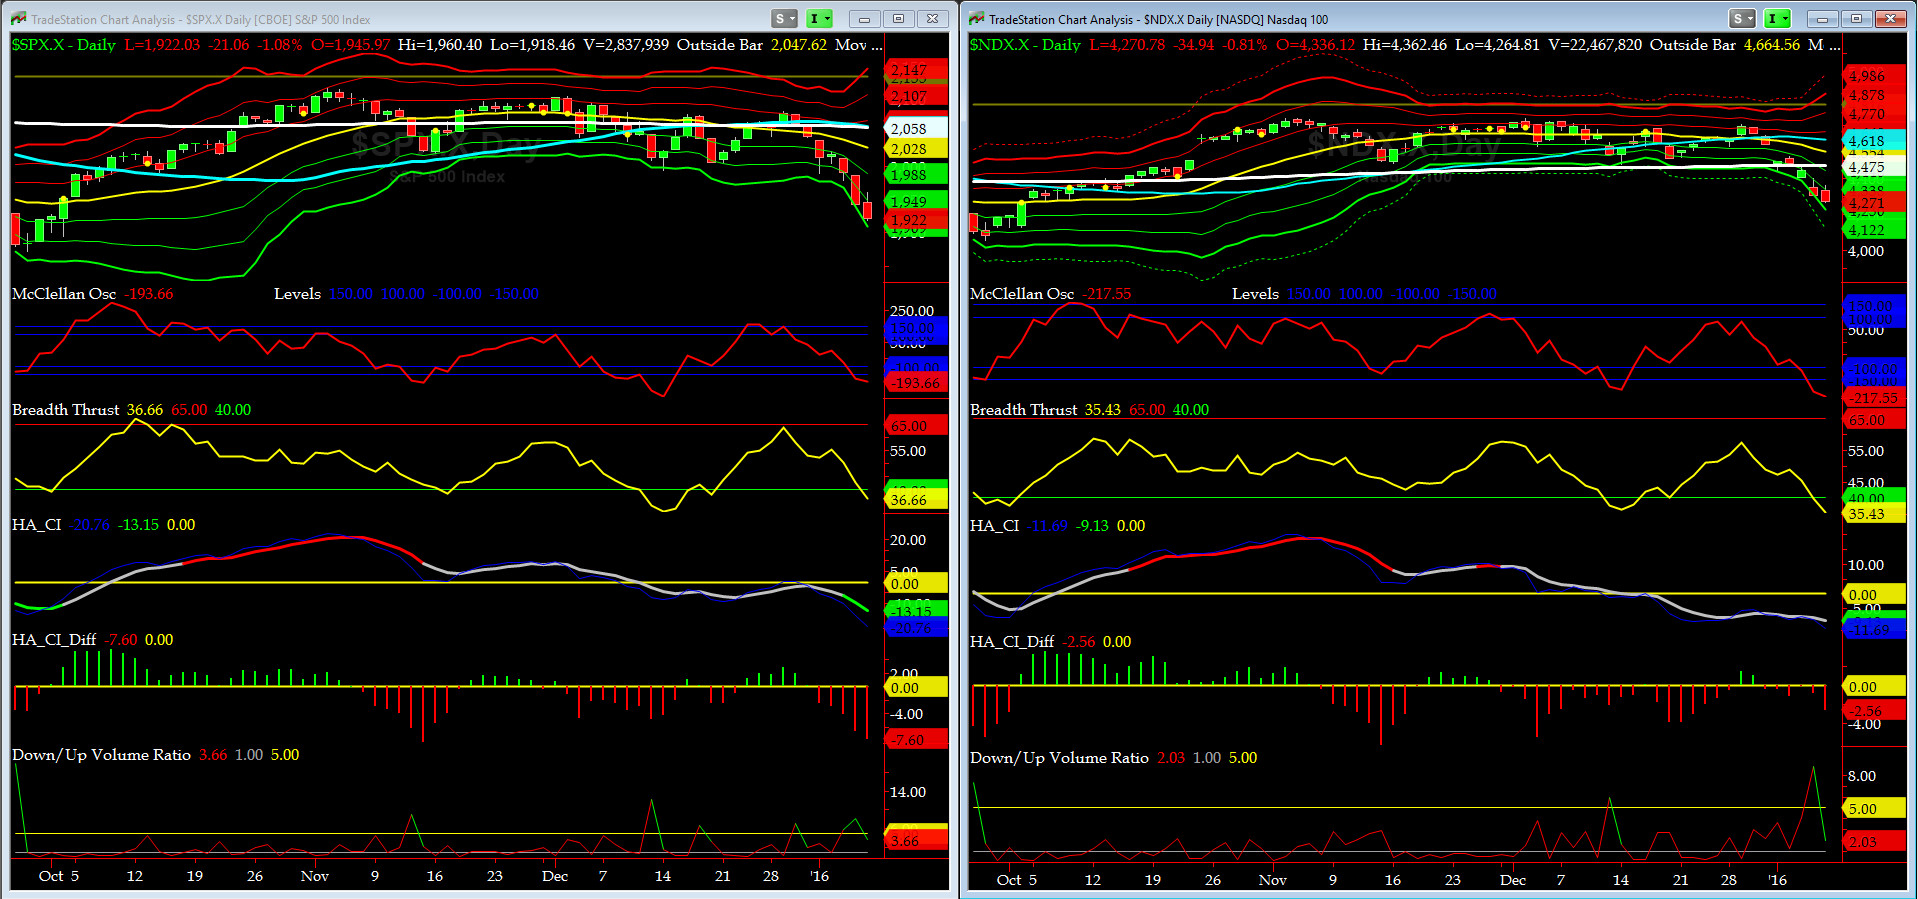
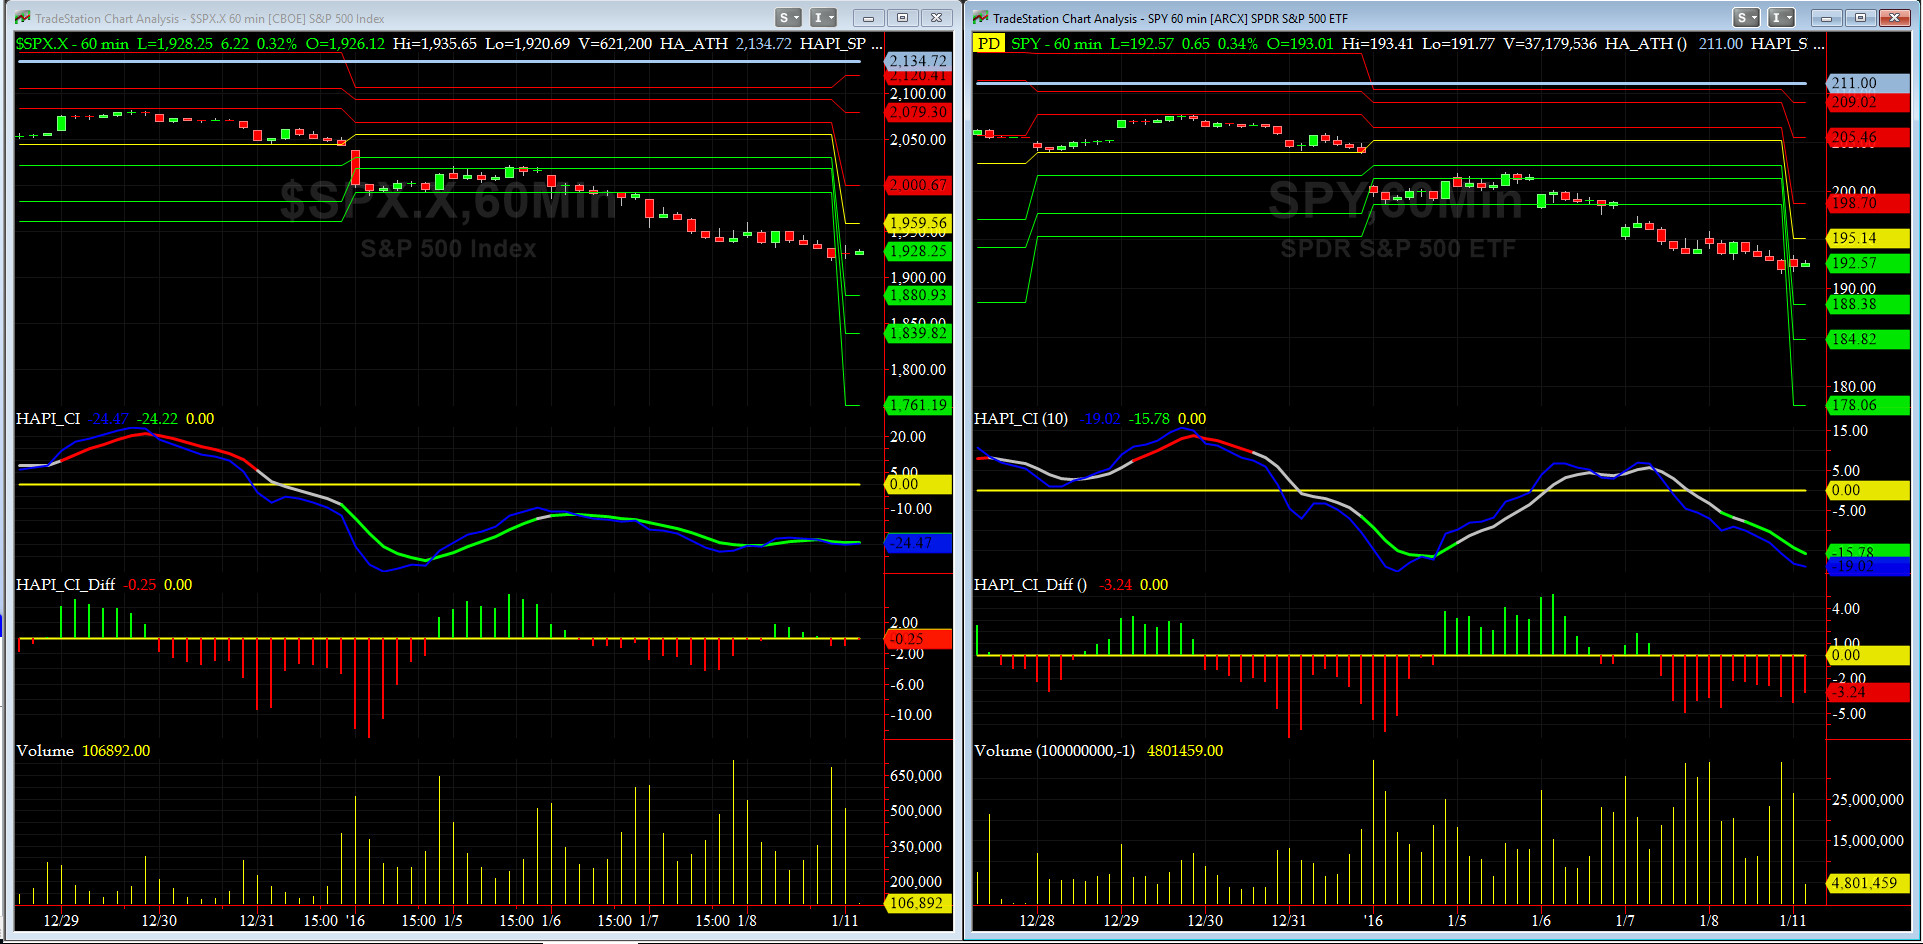
Timer Charts of S&P-500 Cash Index (SPX) + NASDAQ-100 Cash Index (NDX)
SPX had its worst week since Sept 2011 which back then led to a massive FED Intervention and a 4-week rally in October 2011. NDX has had no up days in 2016, down 9 out of last 10 days. McClellan Osc & Breadth Thrust are both in short-term oversold zones.
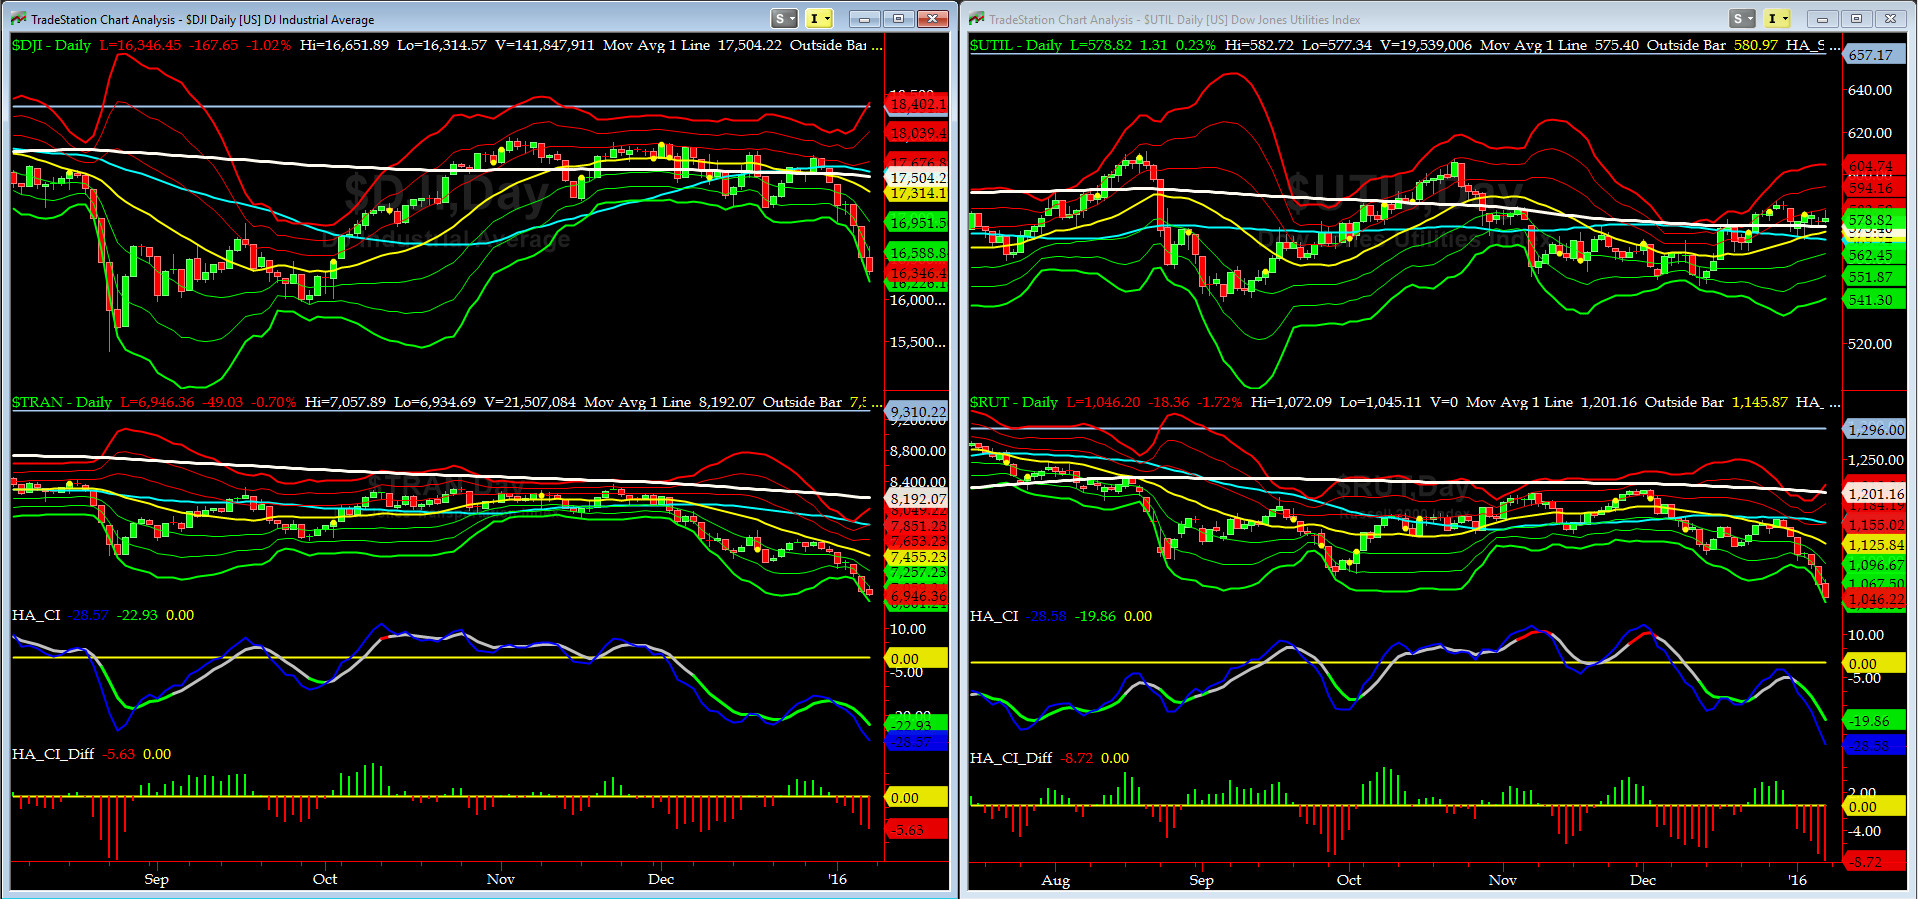
Canaries [in the Coal Mine] Chart for DJ TRAN & RUT Indices
As stated here ad nauseam, both DJ Transports (proxy for economic conditions 6 to 9 months hence) & Russell 2000 Small Caps (proxy for RISK ON/OFF) have been warning of us of a pending violence which we finally witnessed last week. Given their CI readings, ioho, the carnage should be over soon.
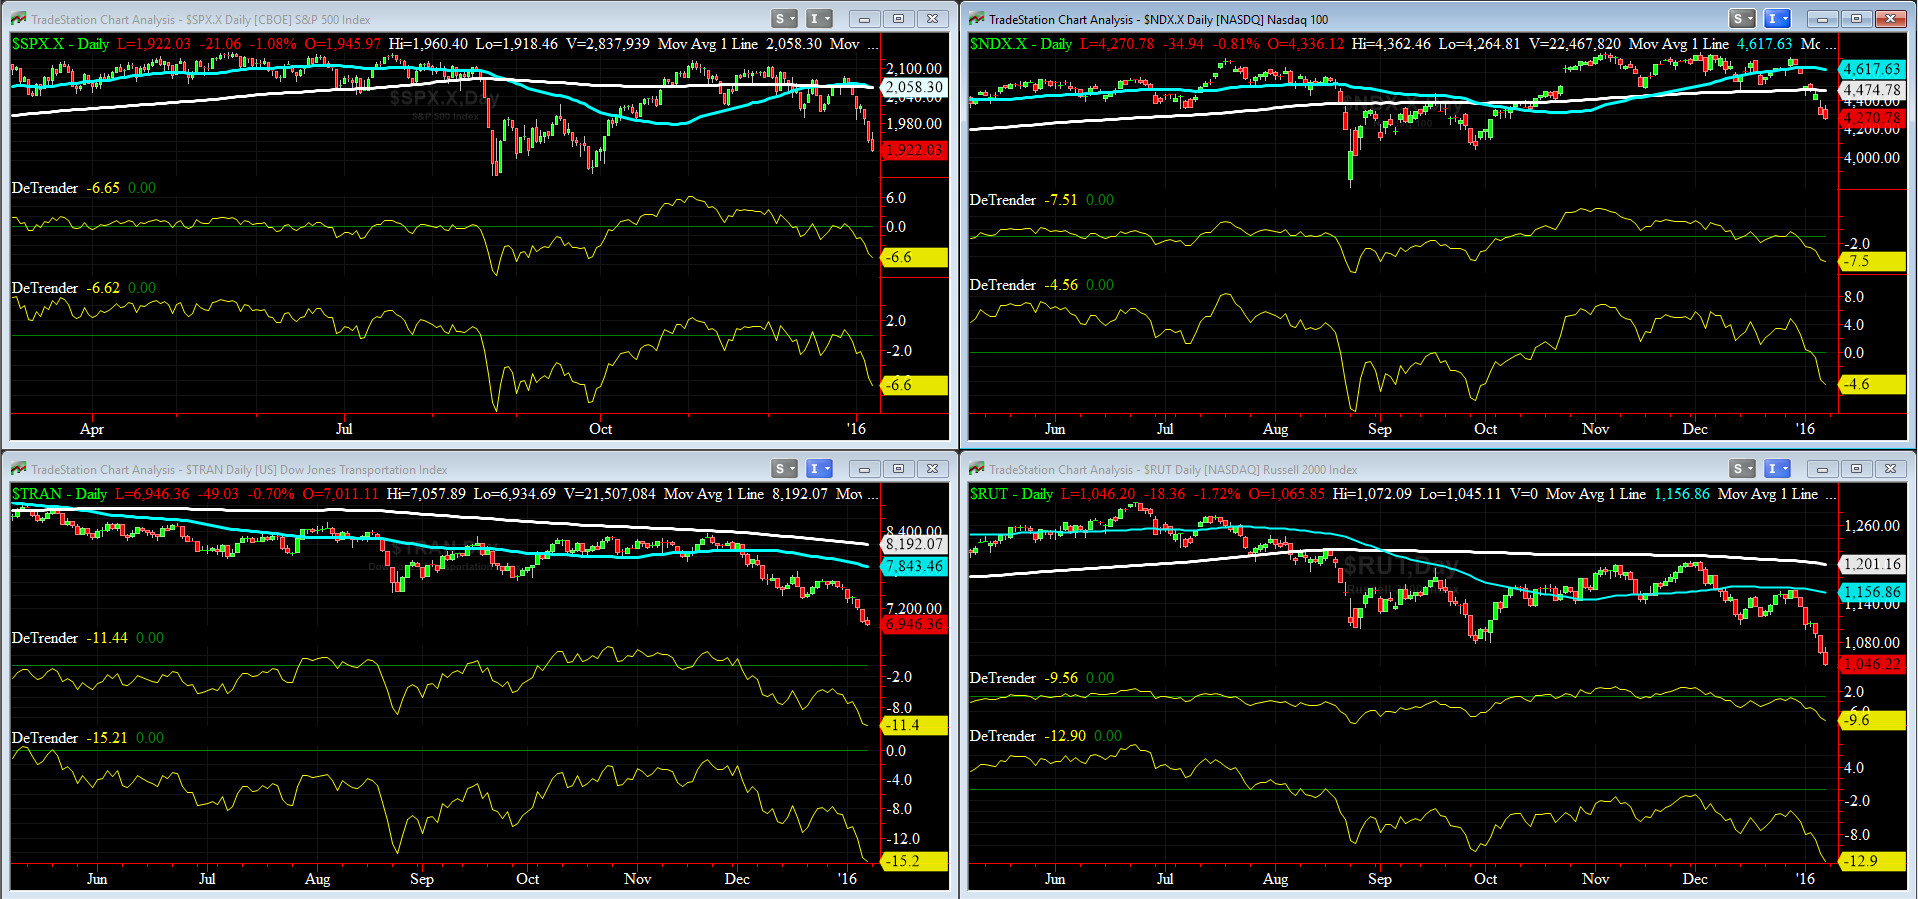
DeTrenders Charts for SPX, NDX, TRAN & RUT Indices
As of Friday Close, all our EIGHT 50DTs & 200DTs are negative with DJ TRAN DT being most negative.
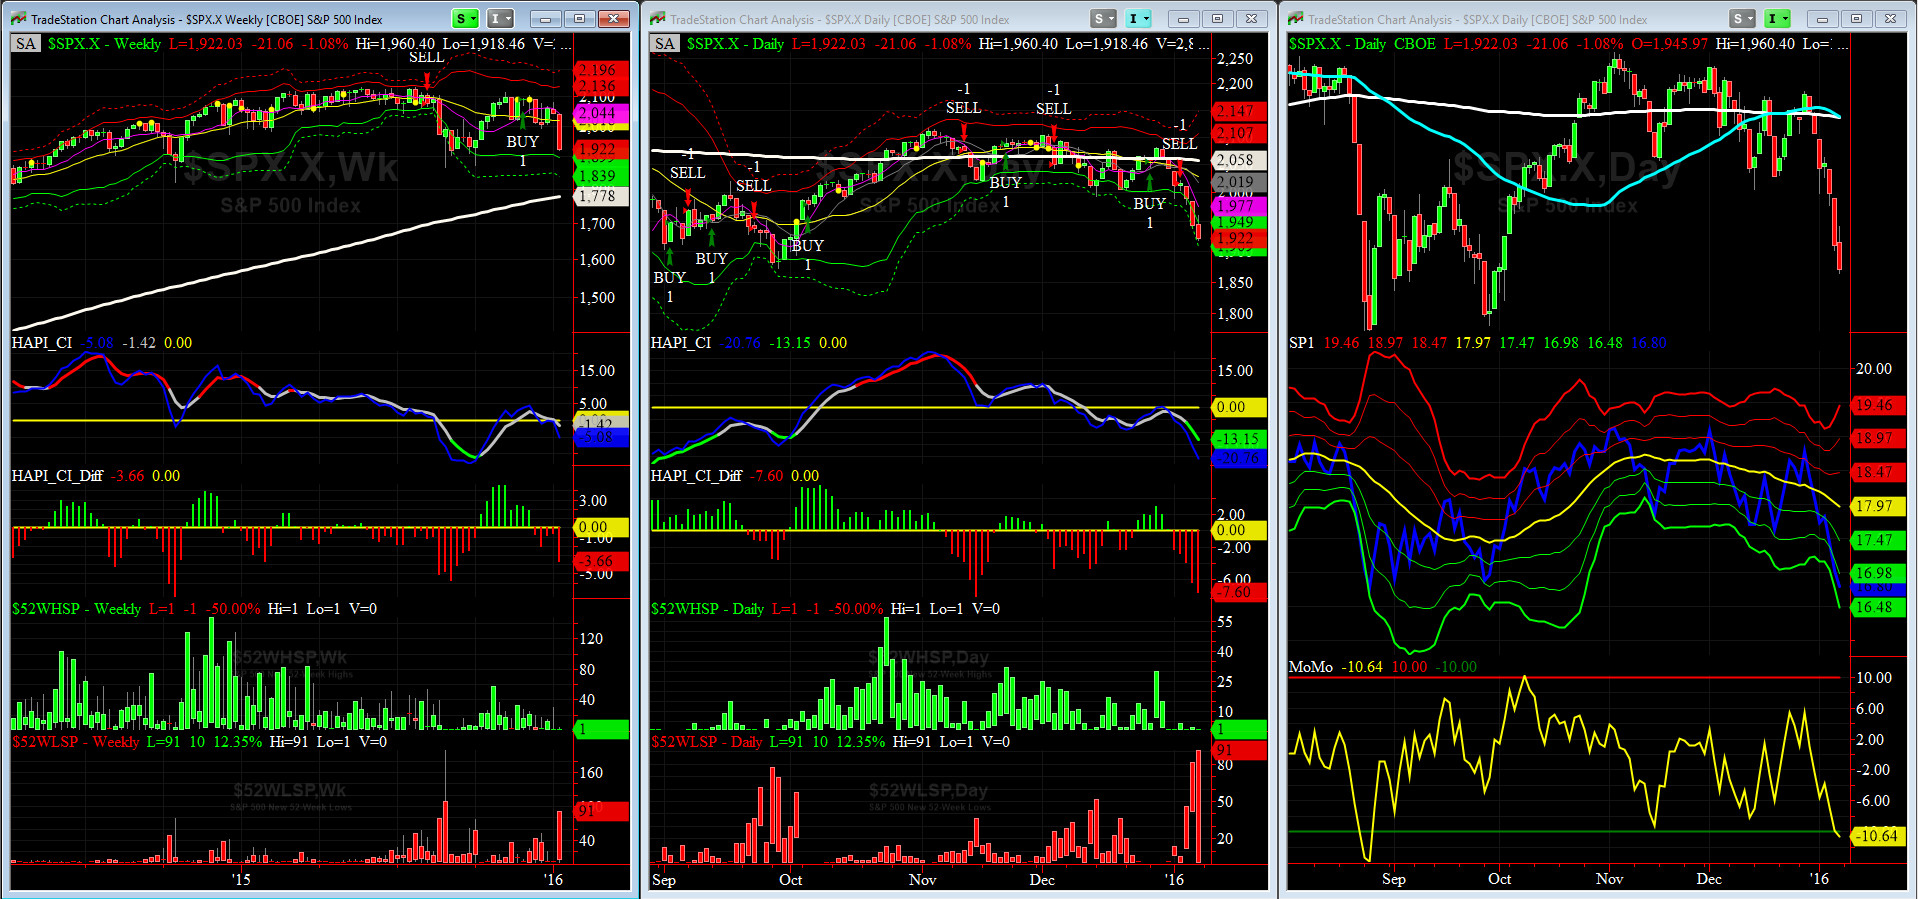
HA_SP1_momo Chart
Our WEEKLY Timing Model remains on a BUY while our DAILY Timing Model switched to SELL last Tuesday.
HA_SP1 is near its -3 sigma while HA_momo is now at -10.6. The new 52wk lows for SPX rose to 91 on Friday, (40 is generally accepted as the threshold for reversal).

Vol of the Vols Chart
Vols keep being somewhat tamed given the outsized delta move we have seen. That is a tad puzzling for us right now.

5-day TRIN & TRINQ Charts
so far we have witnessed a number of failed BUY signals by the 5-day TRIN (for NYSE), while TRINQ (for NASDAQ) is a tad above neutral with a 1.3 reading.
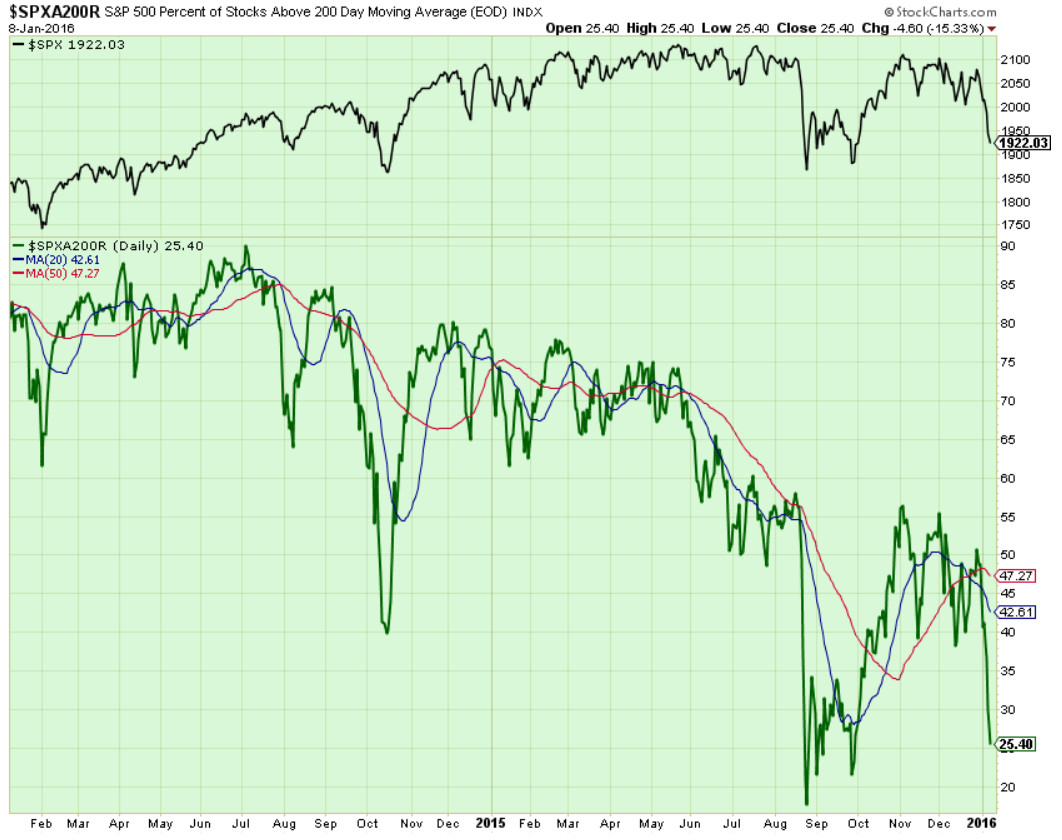
Components of SPX above their respective 200day MA Chart
During the hard sell-off this week, this scoring indicator went straight south and now it is at 25%. Given its distance from its 20 & 50 day MAs, it is a bit worrisome. We should expect a test of 20%, at minimum, before we head back up.

SPX SKEW (Tail Risk) Chart
On Friday, SPX SKEW (Tail Risk) further moved up a tad to ~139 (which is about its +0.5 sigma). This [relatively] low reading, given the price structure we are in, is also puzzling.
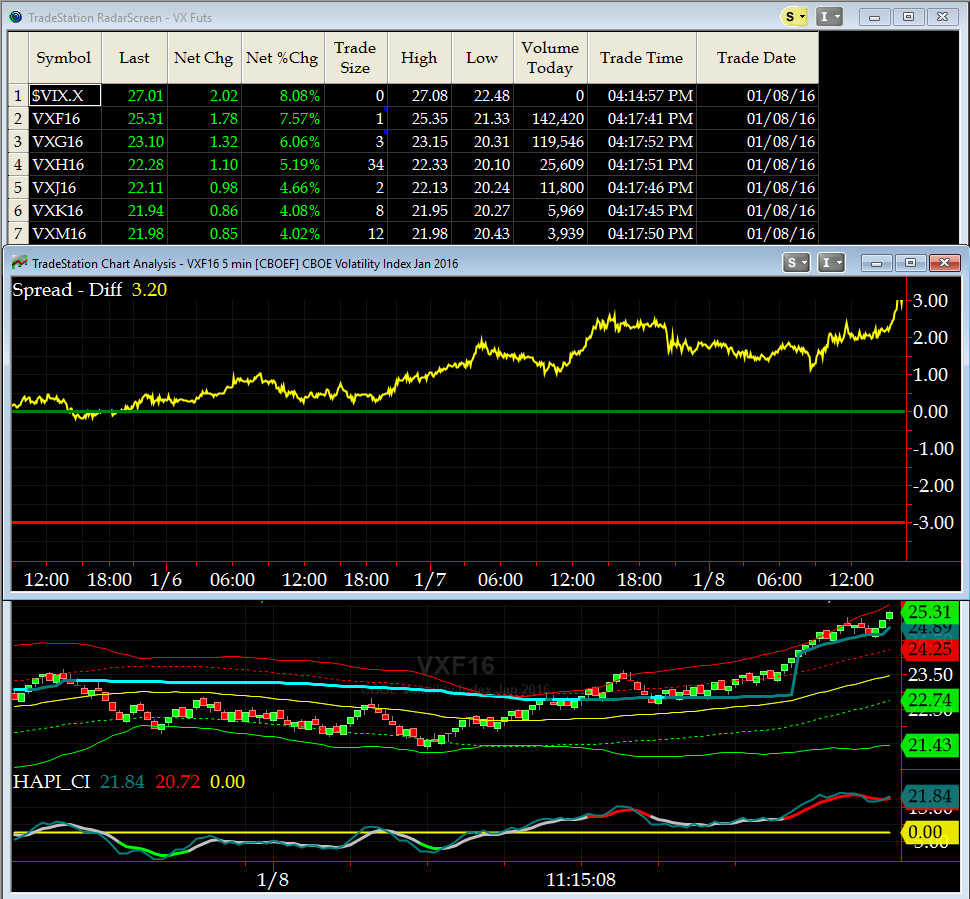
UPDATED 3-month VIX Futures Spread(VX) Chart
Our 3-month VIX Futures Spread (Long JAN16 & Short APR16), closed at over 3.0 on Friday. IOHO, the short-term bottom is in.

HA_SP2 Chart
At ~12, this prop indicator also says the low is in. Worth noting on this chart is that all 3 HAPI StockRSIs have converged to below 10 and that is another indication that the short-term low is in.
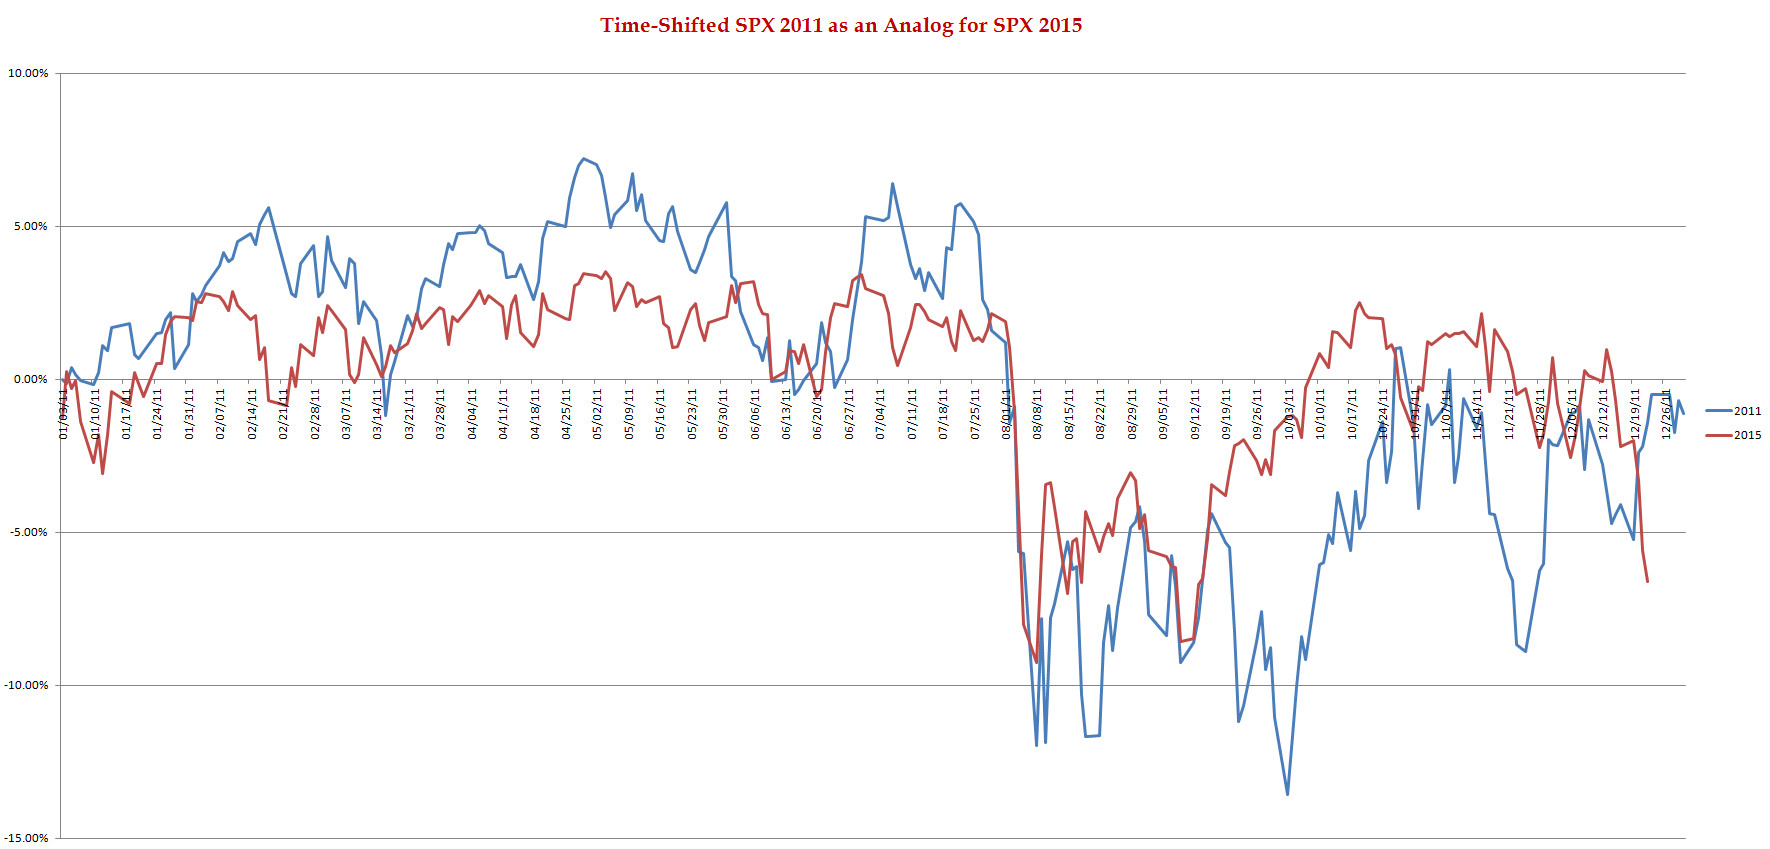
SPX 2011 Time-Shifted Analog for SPX 2015
As expected in the last couple of issues, our coveted Time-Shifted 2011 Analog Chart gave its final signal before it was archived; and yes, we saw a dip, all right. LOL. The search for the 2016 Analog(s) has started and continues into next week.
A note to all students of the markets: Having worked with Analog Charts for about 15 years now, one thing is empirically common among all analogs: They work till they stop working. Keep that in mind.
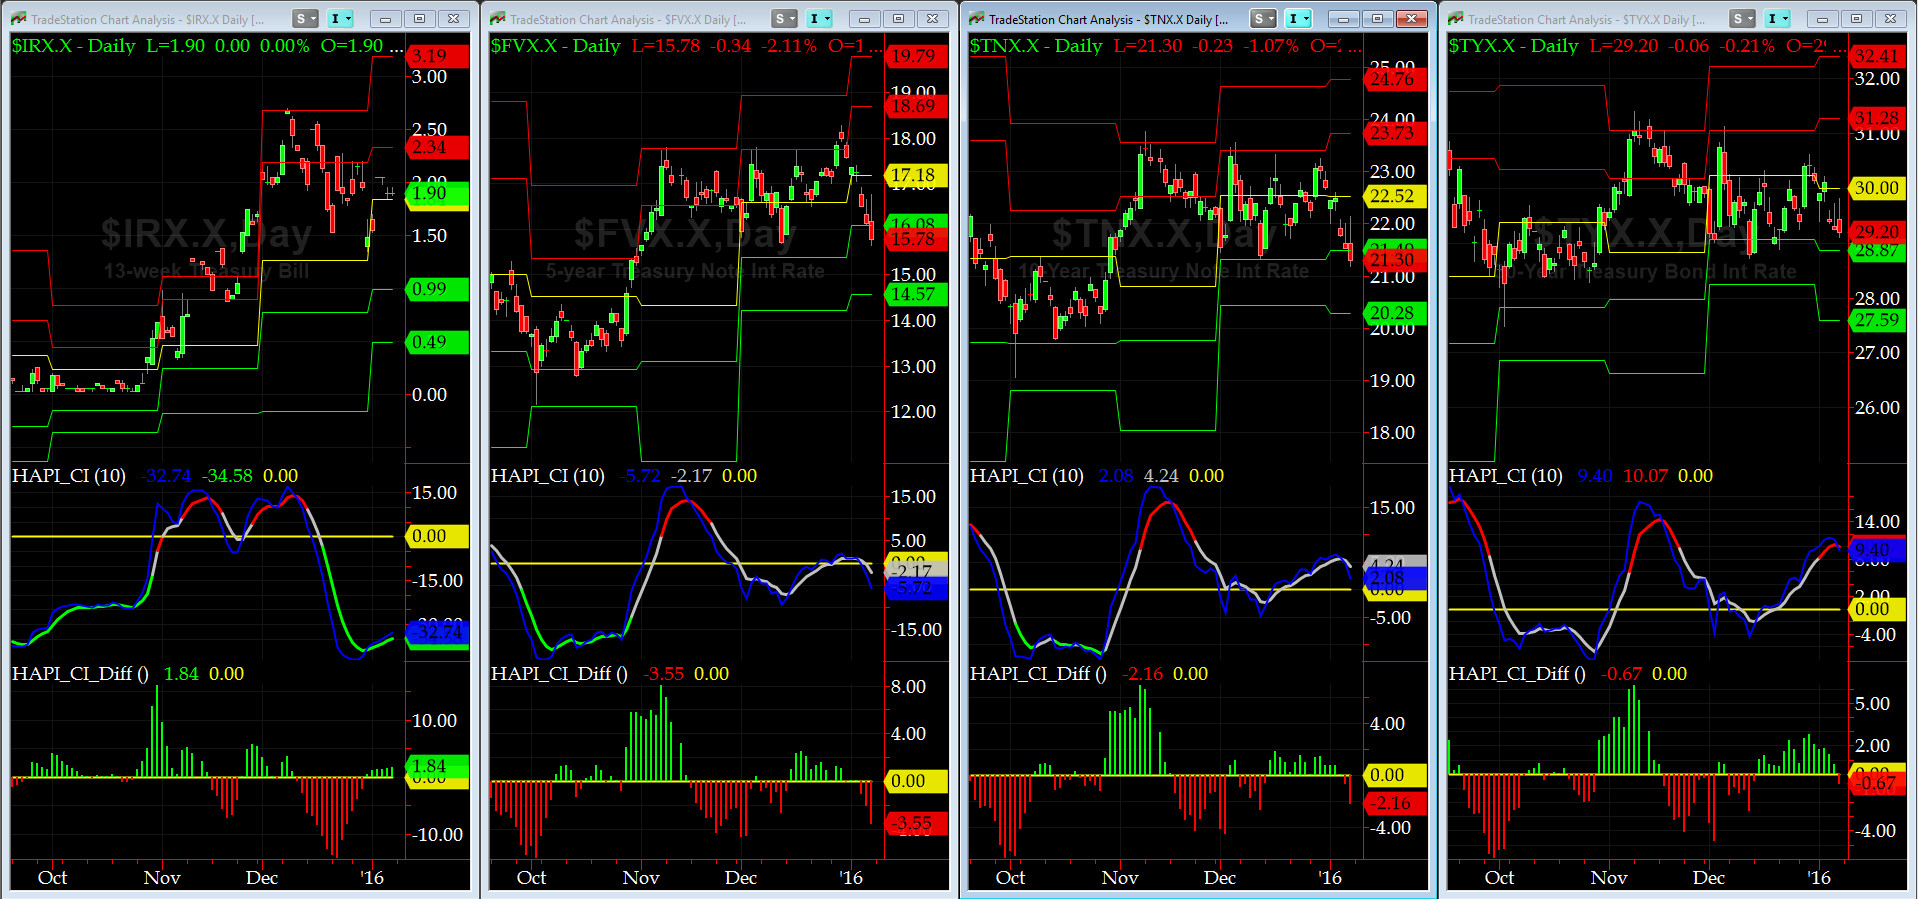
US Treasury T-Notes & T-Bonds Yields Chart
During this past week, the Treasury Complex Yields pulled back across the board, which is in line with flight-to-safety afforded by our strong dollar during recent turbulent times.
Good luck this week,
Fari Hamzei
|
|
|
|
|
|
Customer Care:
|
|
|
|
|
|
|
 |
 |
|
 |
|
 |
 |
 |
HA YouTube Channel ::: HA Blog ::: Testimonials ::: Tutorials & FAQs ::: Privacy Policy
|
Trading Derivatives (Options & Futures) contains substantial risk and is not for every investor. An investor could potentially lose all or more than his/her initial investment.
Only risk capital should be used for trading and only those with sufficient risk capital should consider trading derivatives. Past performance is not
necessarily indicative of future results. Testimonials appearing on this website may not be representative of other clients or customers
and are not a guarantee of future performance or success.
|
| (c) 1998-2025, Hamzei Analytics, LLC.® All Rights Reserved. |
|
|