|
Saturday, February 6, 2016 1930ET
Market Timing Charts, Analysis & Commentary for Issue #130
Timer Charts of S&P-500 Cash Index (SPX) + NASDAQ-100 Cash Index (NDX)
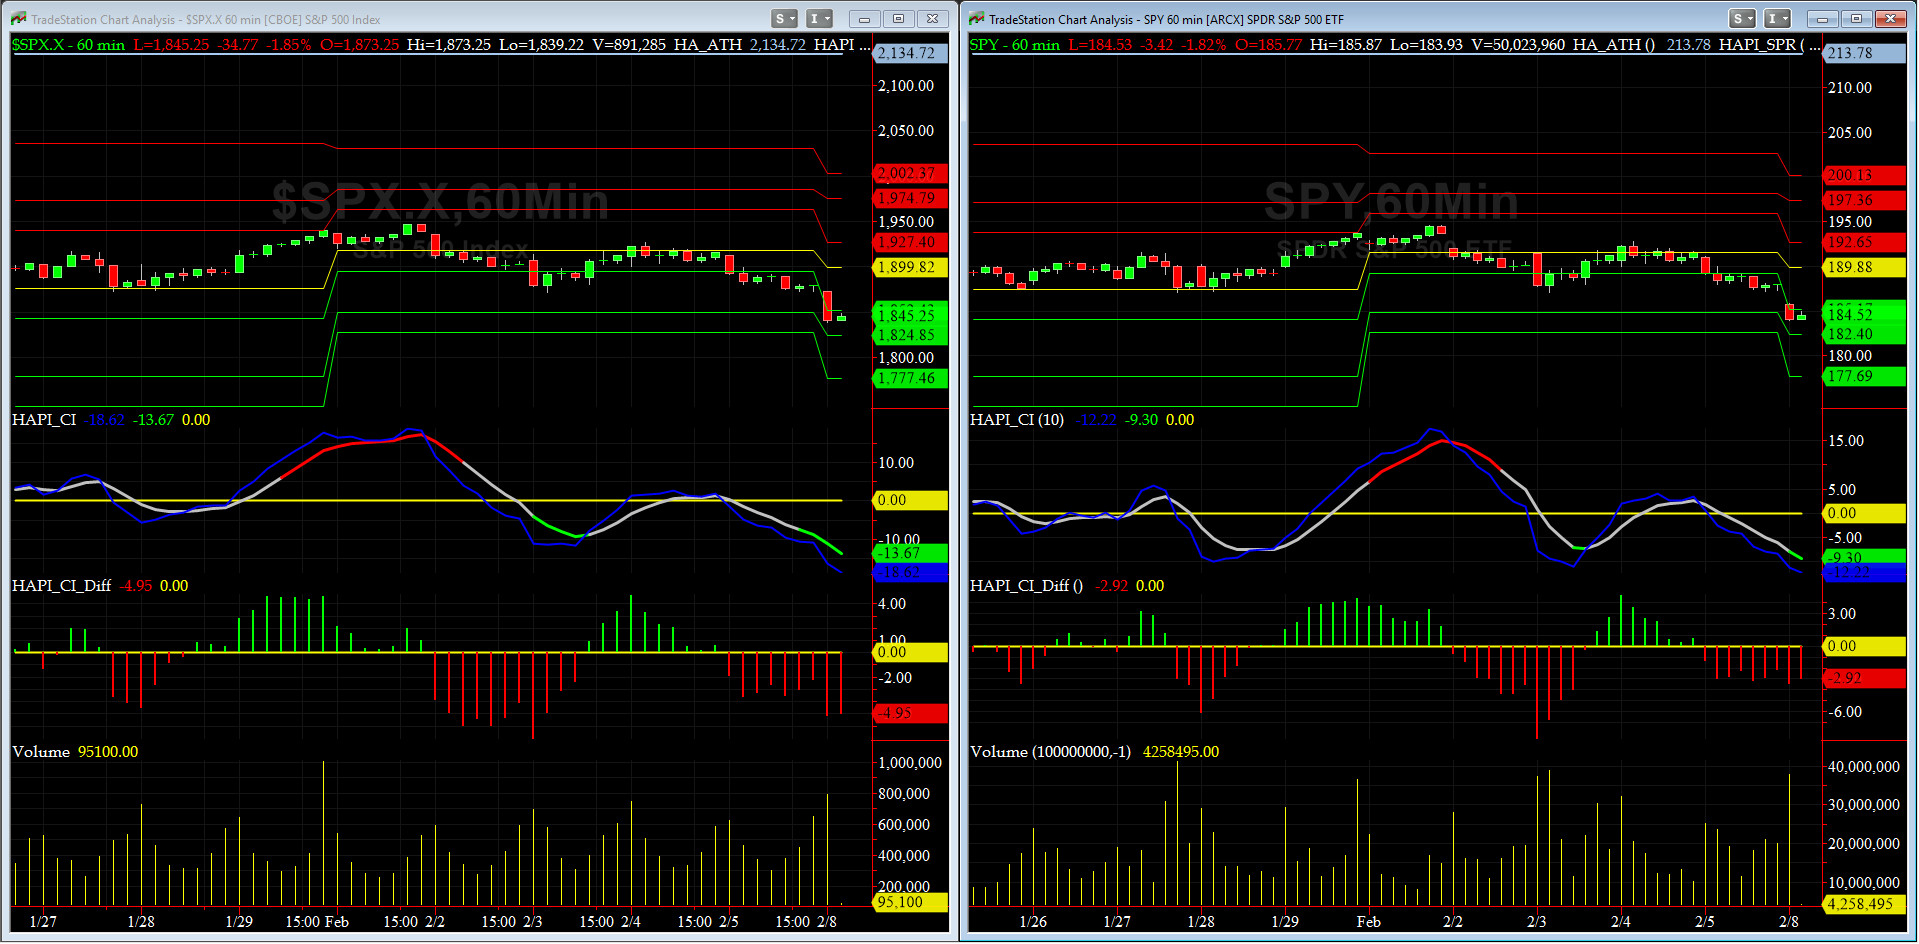
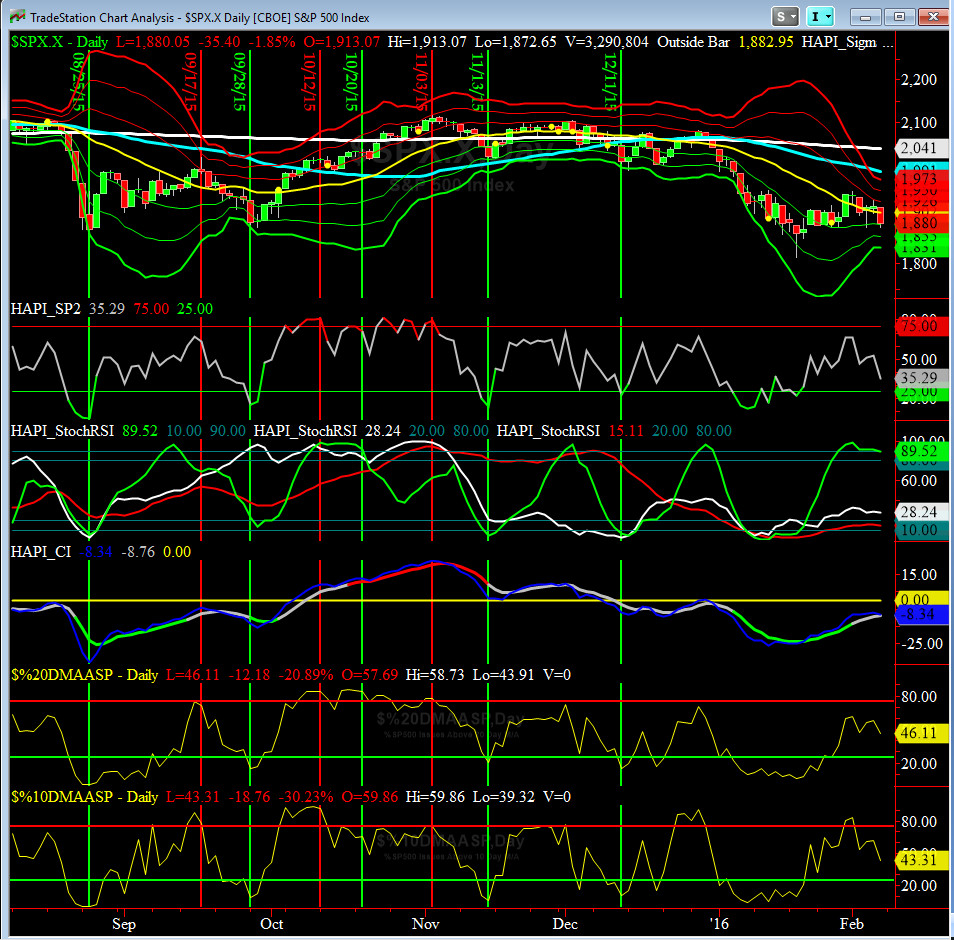
Most recent S&P-500 Cash Index (SPX): 1880.05 down -60.19 (down -3.1%) for the week ending on Friday, February 5th, 2016, which closed at its -1 sigma.
SPX ALL TIME INTRADAY HIGH = 2134.72 (reached on Wednesday, May 20th, 2015)
SPX ALL TIME CLOSING HIGH = 2130.82 (reached on Thursday, May 21st, 2015)
Current DAILY +2 Sigma SPX = 1950 with WEEKLY +2 Sigma = 2153
Current DAILY 0 Sigma (20 day MA) SPX = 1902 with WEEKLY 0 Sigma = 2007
Current DAILY -2 Sigma SPX = 1855 with WEEKLY -2 Sigma = 1860
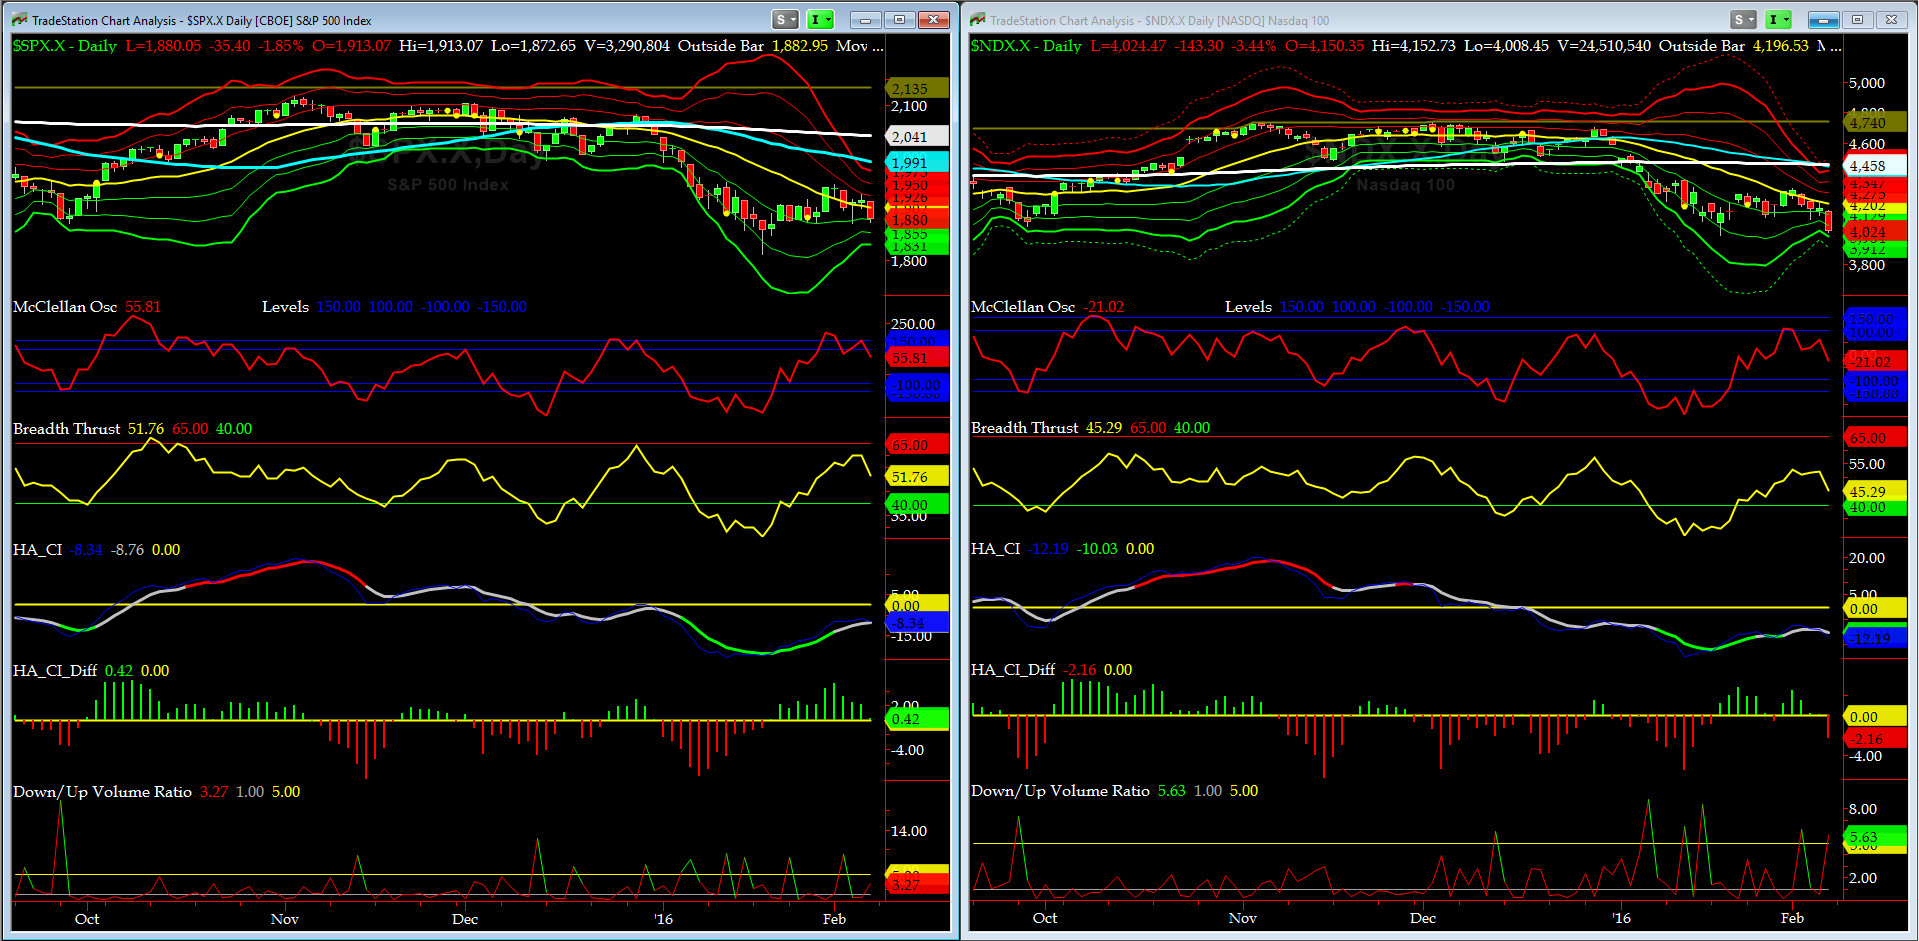
NYSE McClellan Oscillator = +56 (-150 is start of the O/S area; around -275 to -300 area or lower, we go into the �launch-pad� mode, over +150, we are in O/B area)
NYSE Breadth Thrust = 51.5 (40 is considered as oversold and 65 as overbought)
Worth noting is Down to Up Volume Ratio in NAZZ far outpaced NYSE on Friday.
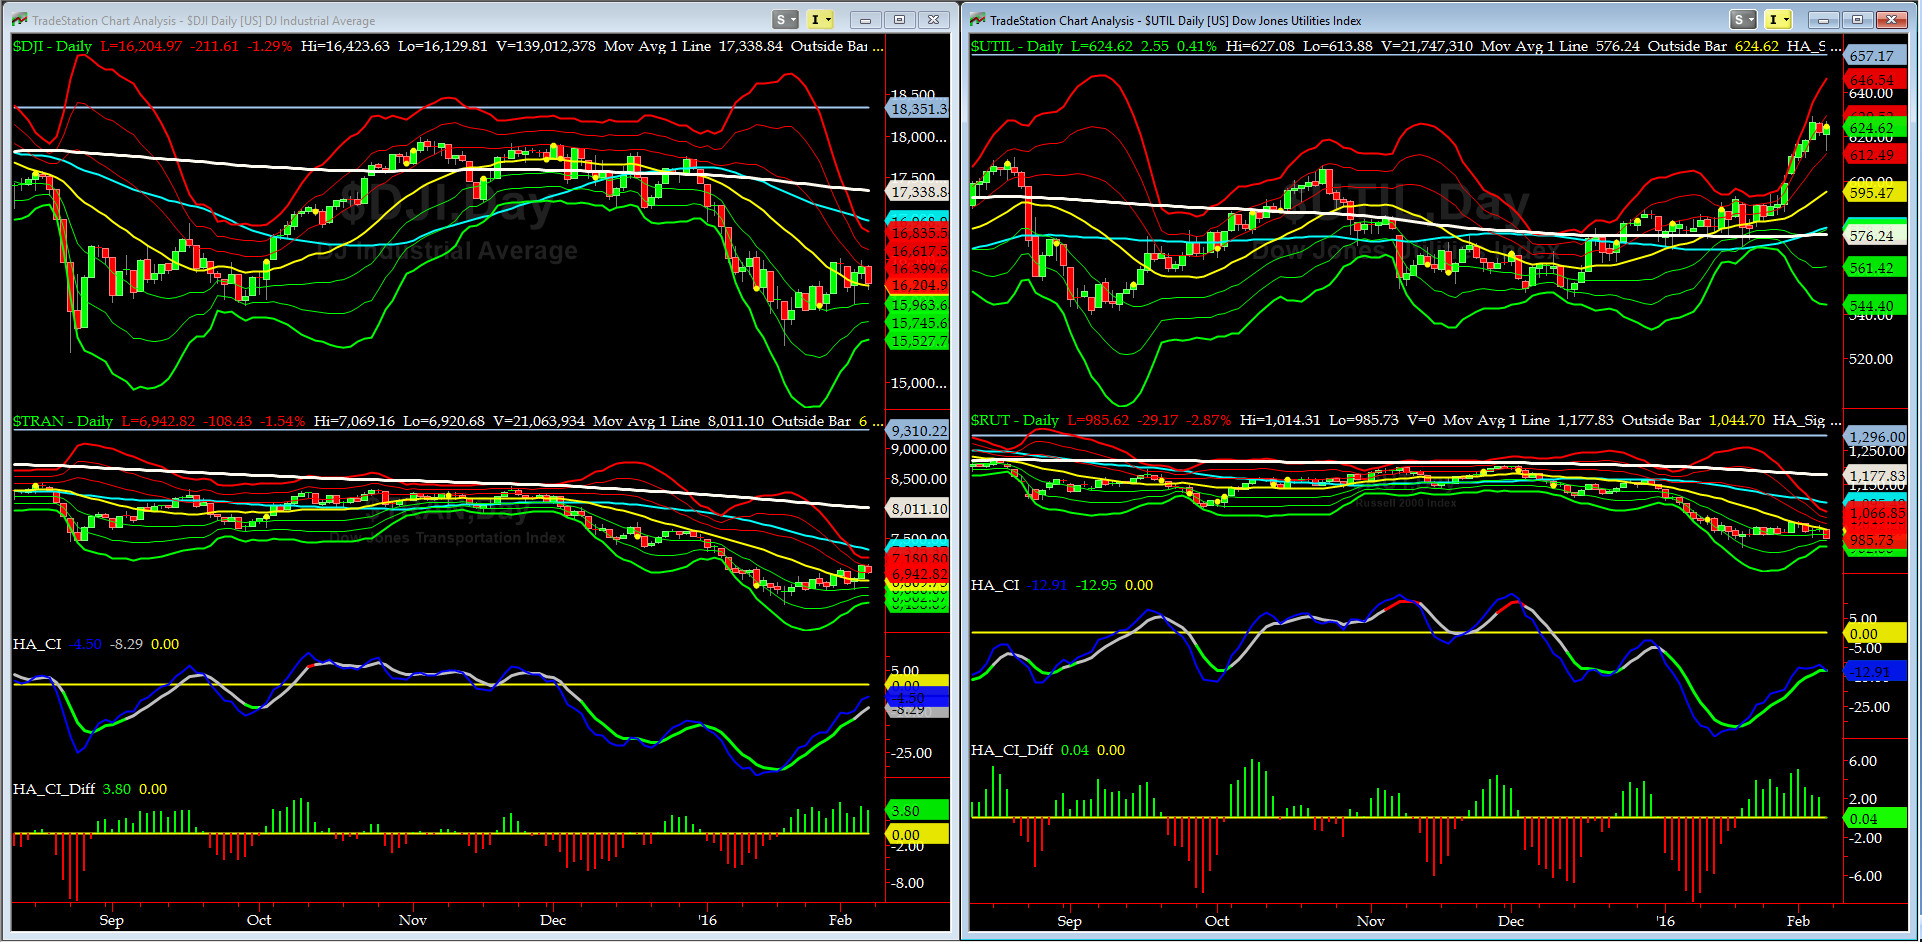
Canaries [in the Coal Mine] Chart for DJ TRAN & RUT Indices
200-Day MA DJ TRAN = 8011 or -13.3% above DJ TRAN (max observed in last 5 yrs = 20.2%, min = -20.3%)
200-Day MA RUT = 1178 or -16.3% above RUT (max observed in last 5 yrs = 21.3%, min = -22.6%)
DJ Transports (proxy for economic conditions 6 to 9 months hence) is in a channel breakout.
Russell 2000 Small Caps (proxy for RISK ON/OFF) sold off pretty hard on Friday, much to the dismay of RISK-ON weakhand players!!
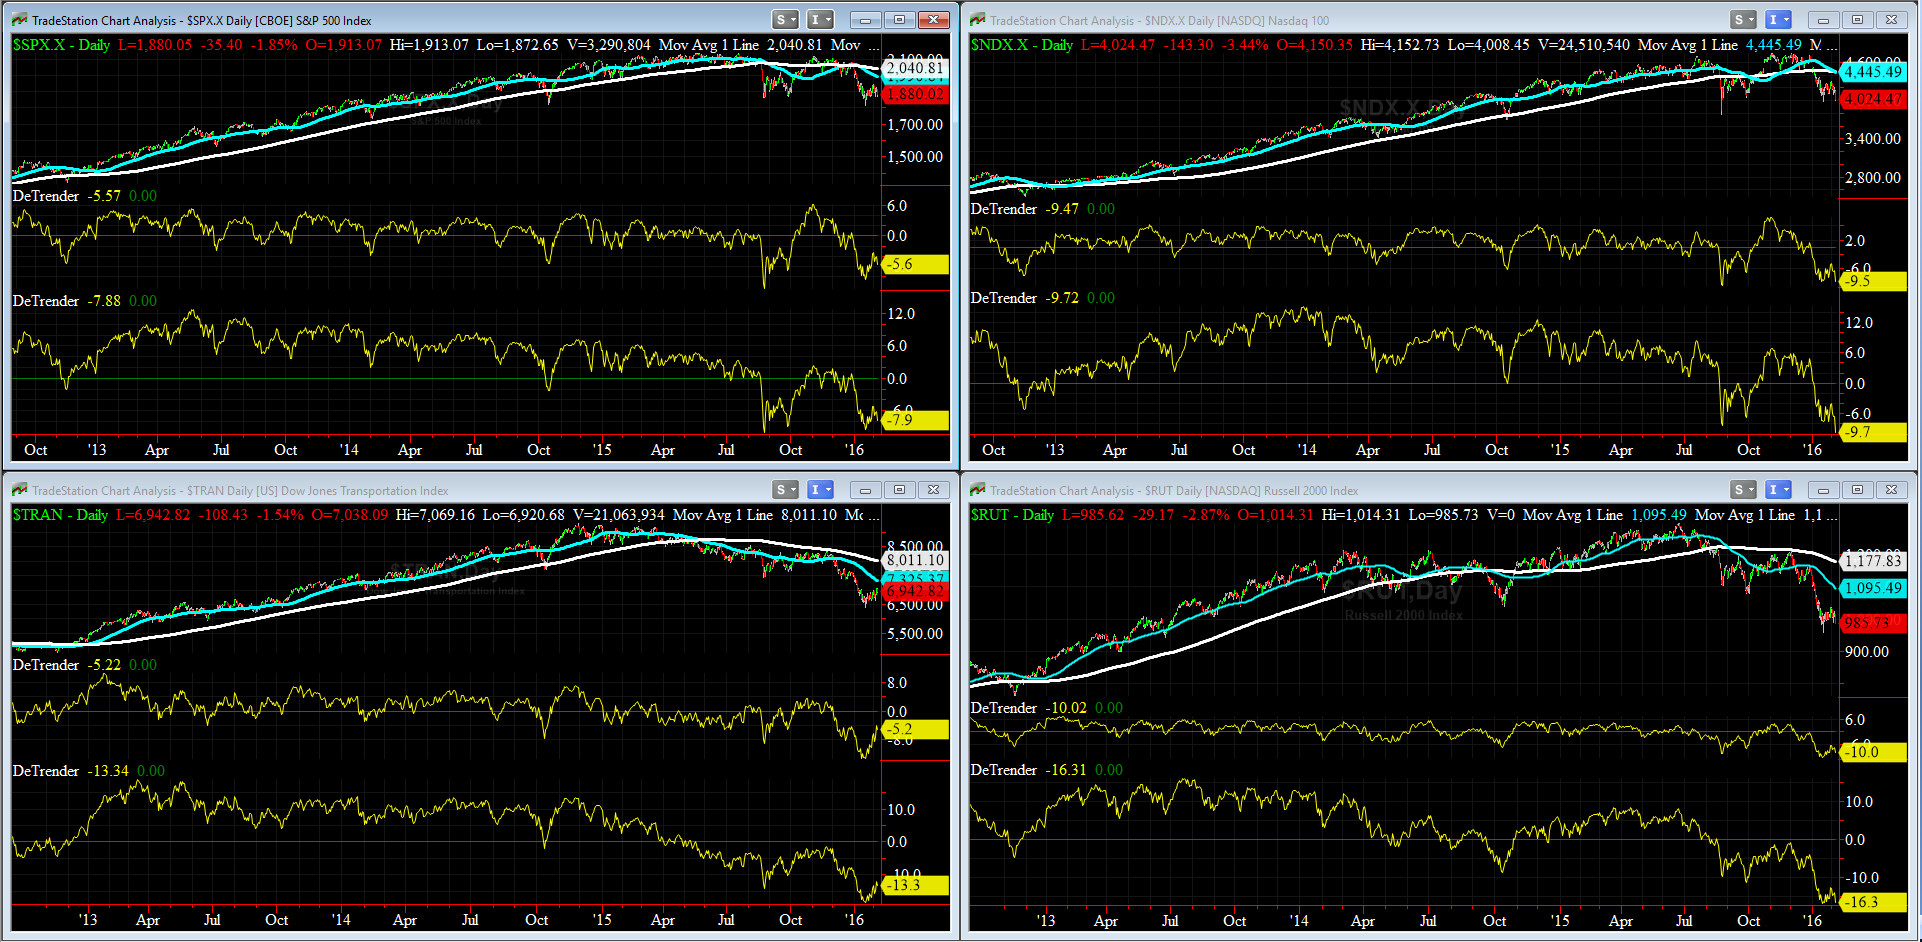
DeTrenders Charts for SPX, NDX, TRAN & RUT Indices
50-Day MA SPX =2008 or -3.4% above SPX (max observed in last 5 yrs = +8.6%, min = -9.3% )
200-Day MA SPX = 2046 or -5.1% above SPX (max observed in last 5 yrs = 15.2%, min = -14%)
All of our Eight DeTrenders are still negative but now they are all reversed up.
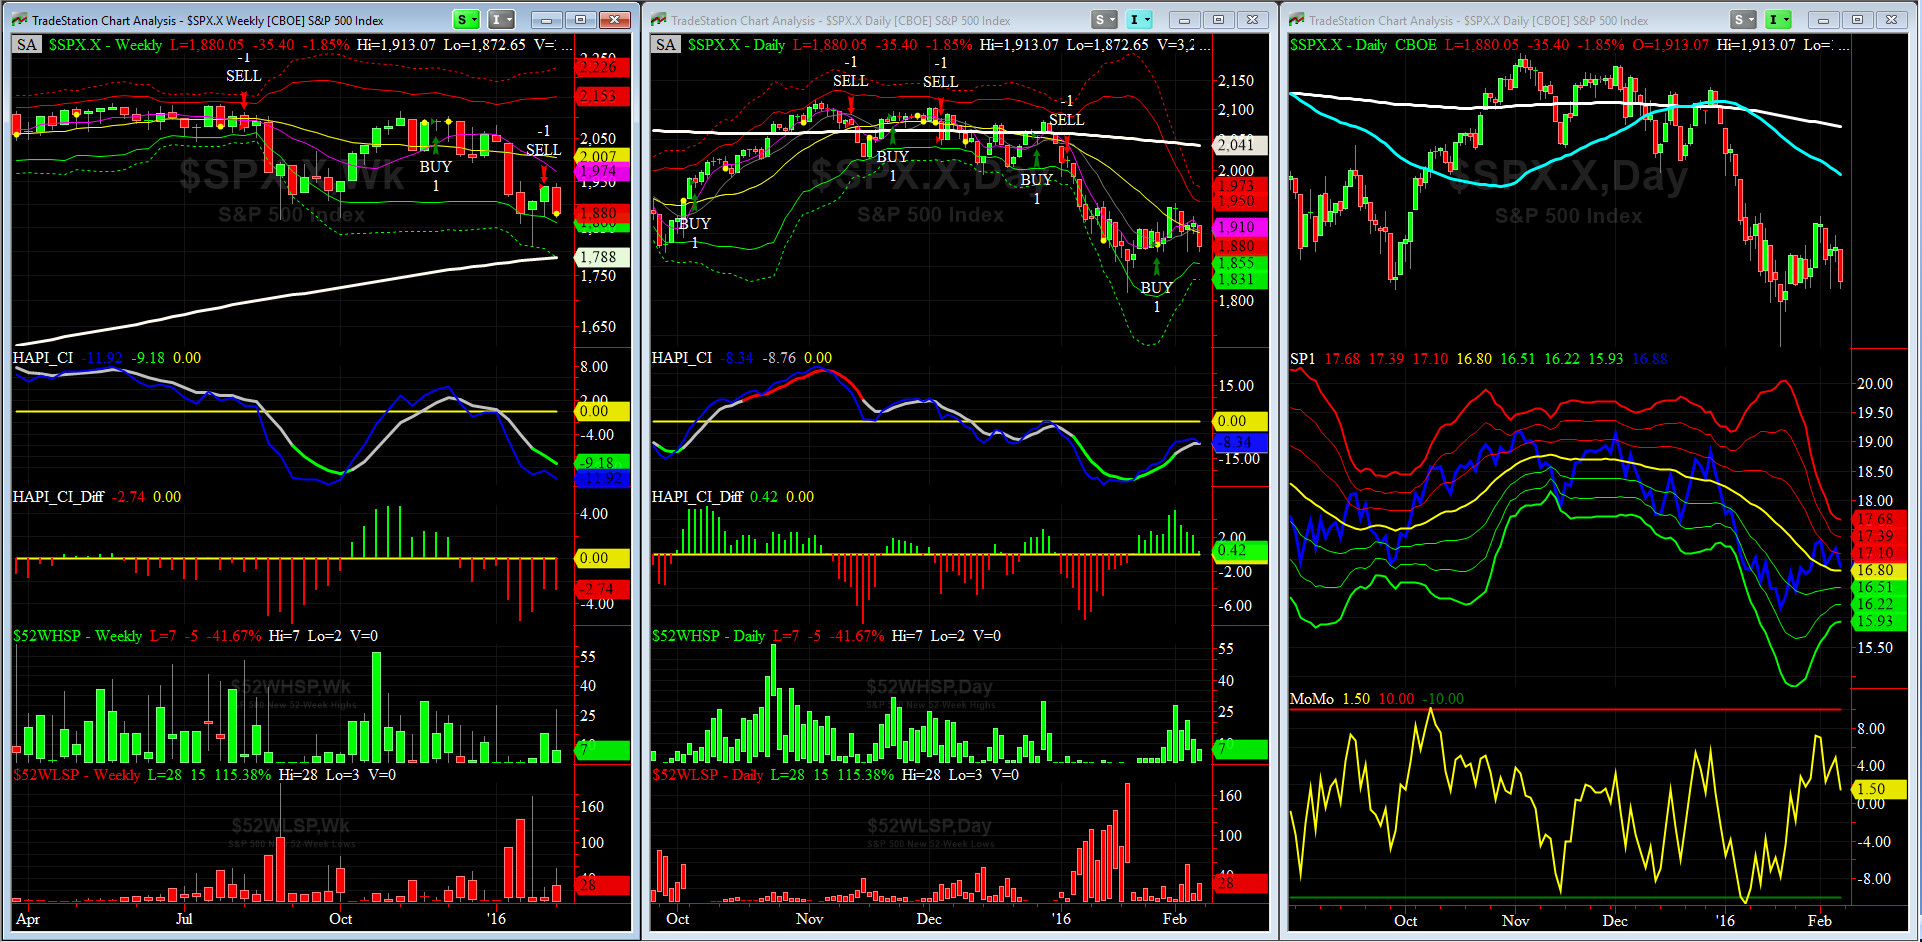
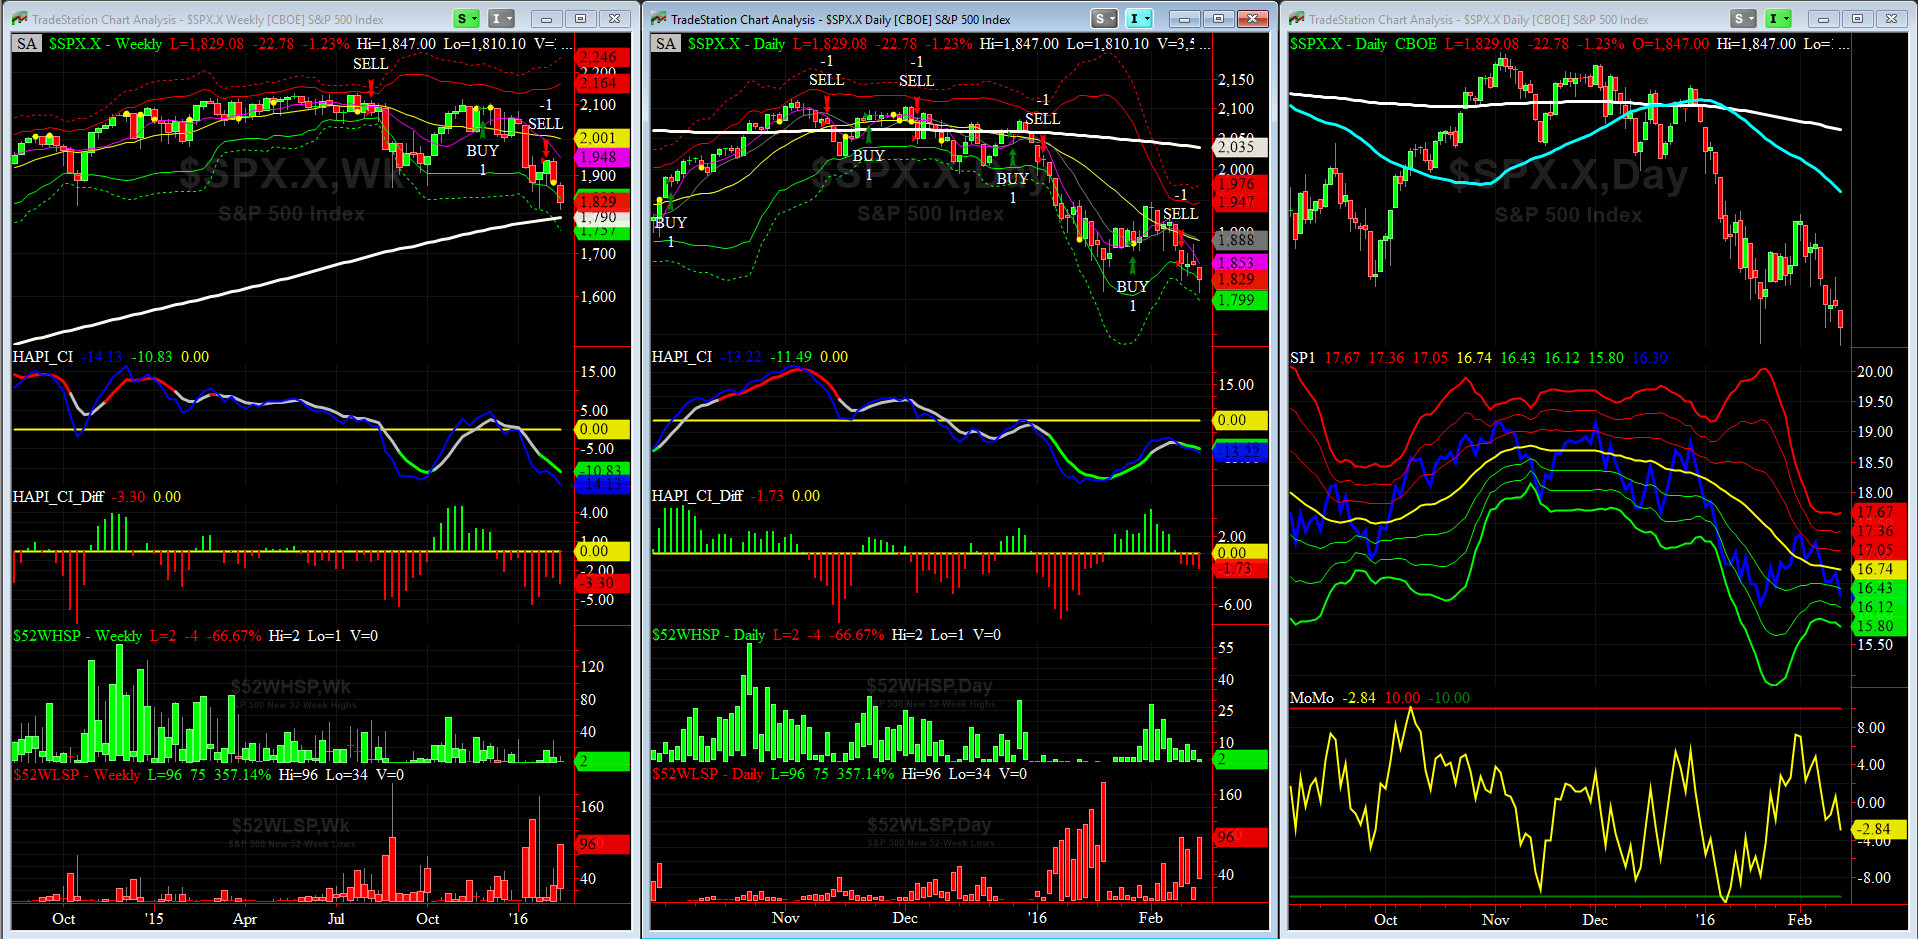
HA_SP1_momo Chart
WEEKLY Timing Model = on a SELL Signal since Friday 1/29/16 CLOSE
DAILY Timing Model = on a BUY Signal since Tuesday 1/27/16 CLOSE
Max SPX 52wk-highs reading last week = 28 (over 120-140, the local maxima is in)
Max SPX 52wk-Lows reading last week = 56 (over 40-60, the local minima is in)
HA_SP1 = at its zero Sigma
HA_Momo = +1.50 (reversals most likely occur above +10 or below -10)
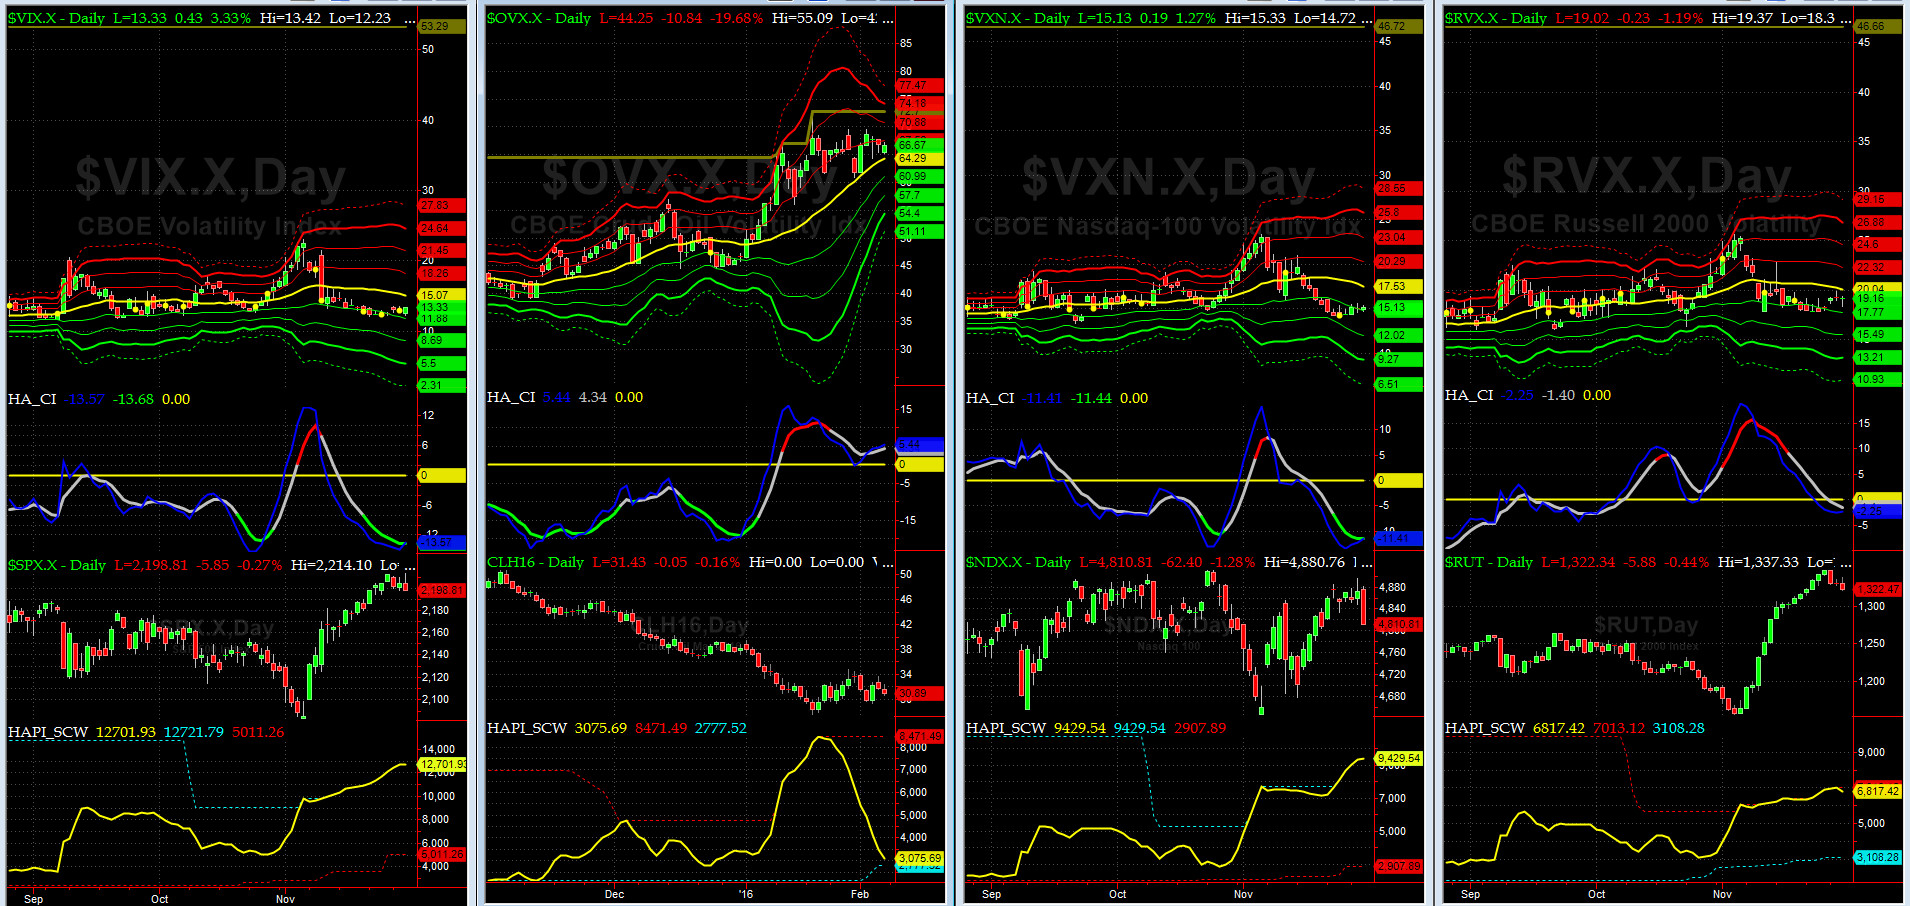
Vol of the Vols Chart
VIX = 24.4 which is just below its zero sigma (remember it�s the VIX�s vol pattern (its sigma channels) that matters, and not the level of VIX itself (this is per Dr. Robert Whaley, a great mentor and the inventor of original VIX, now called VXO. VIX usually peaks around a test of its +4 sigma).
As stated here last week, this shockwave is over, at least for now, till the next shoe drops.
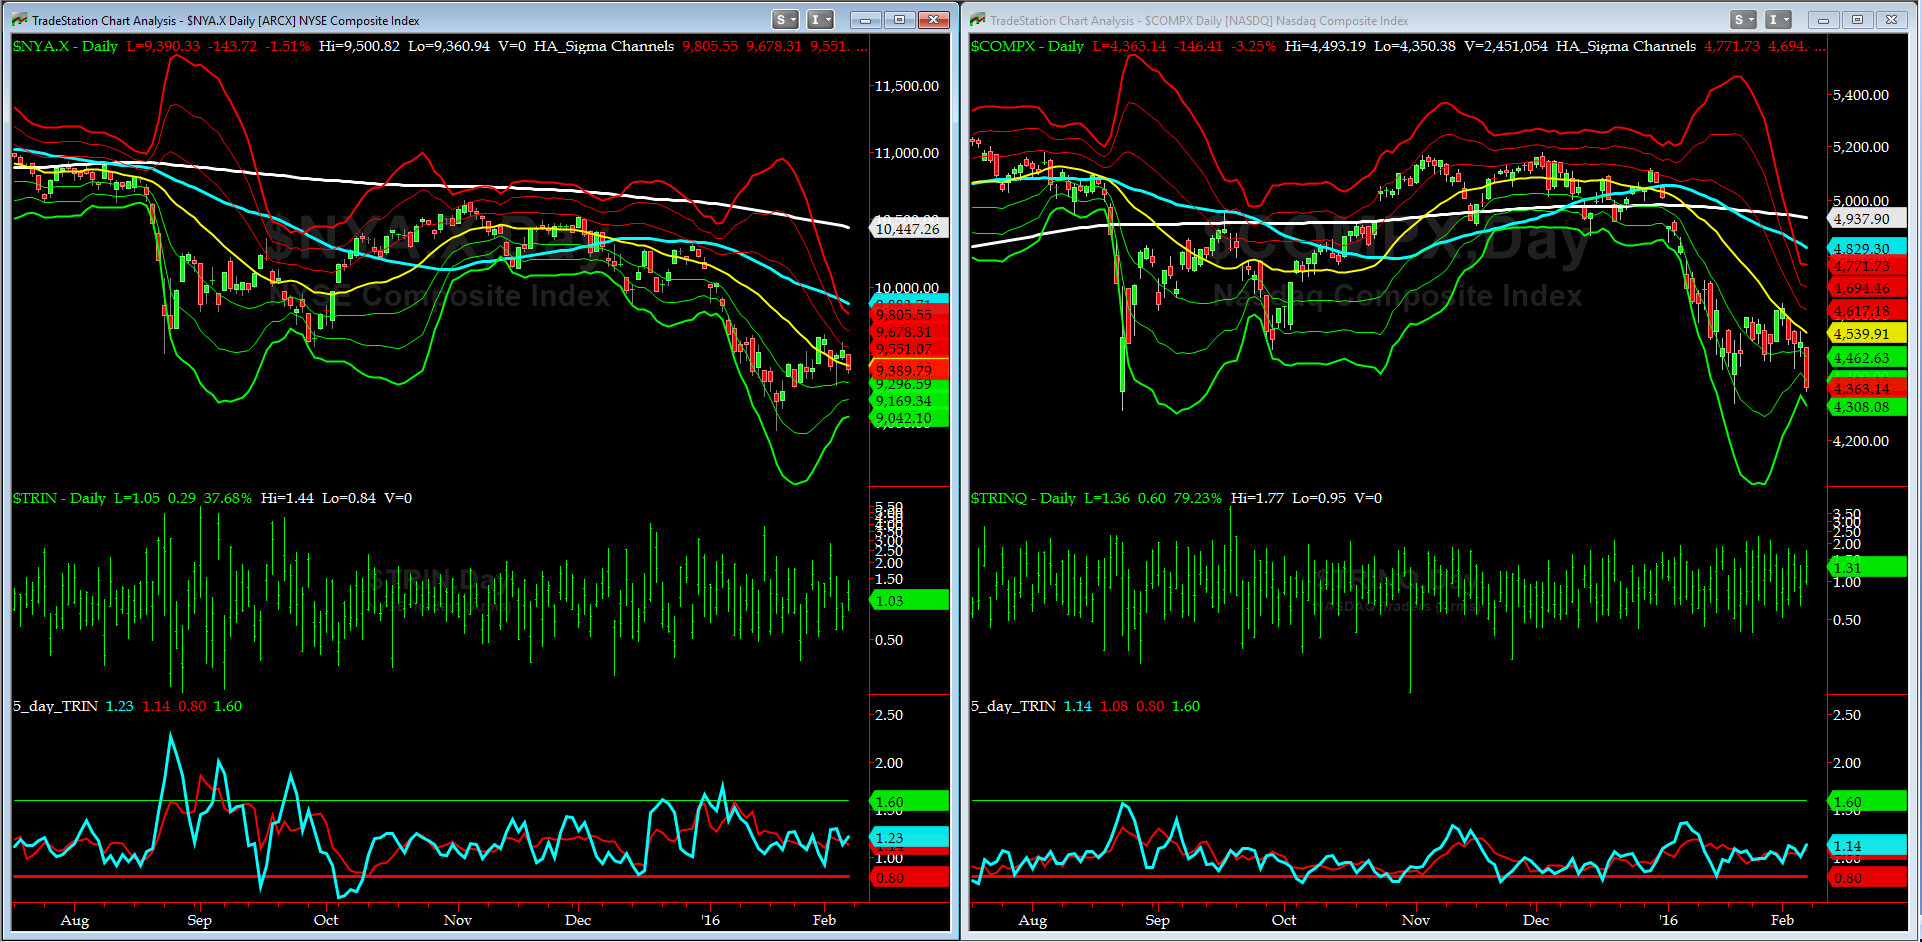
5-day TRIN & TRINQ Charts
Both 5-day TRIN (for NYSE) and 5-day TRINQ (for NASDAQ) closed, again, very neutral.
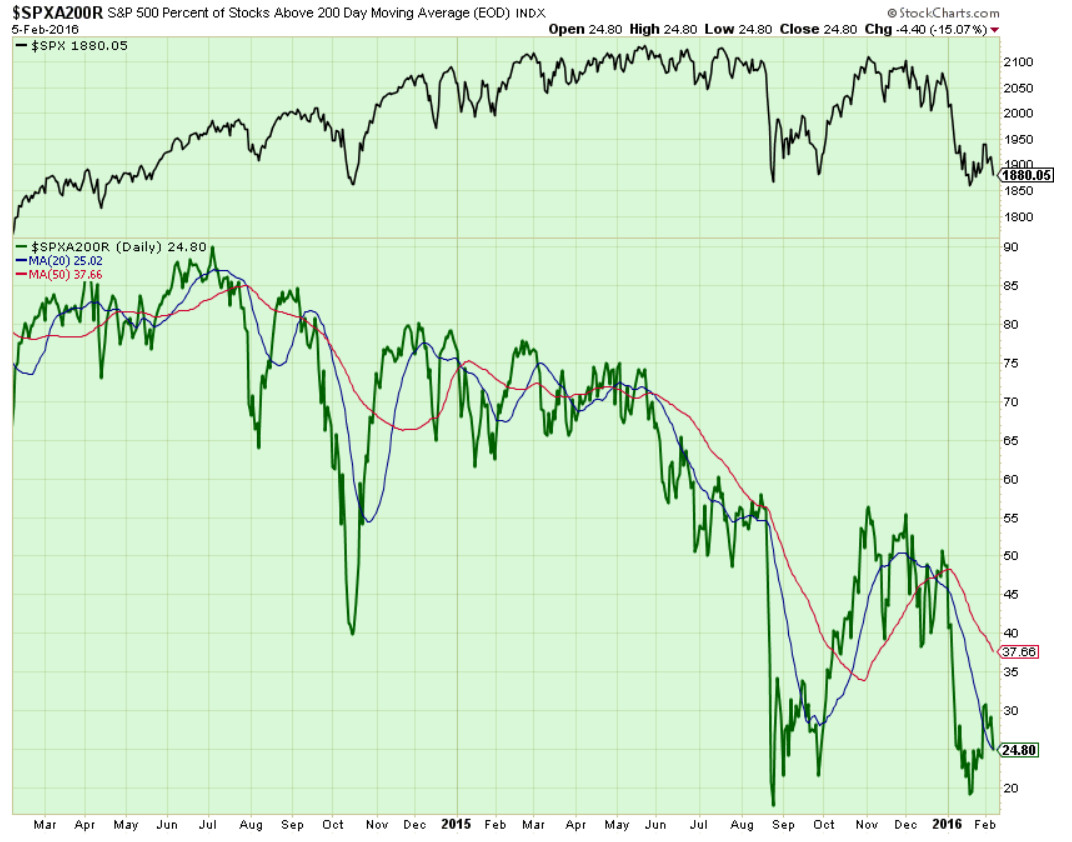
Components of SPX above their respective 200day MA Chart
We did not get passed 30% level and ended up shooting down to 25%. This reading could be a tell this week. We shall keep an eye on it every day after the close.
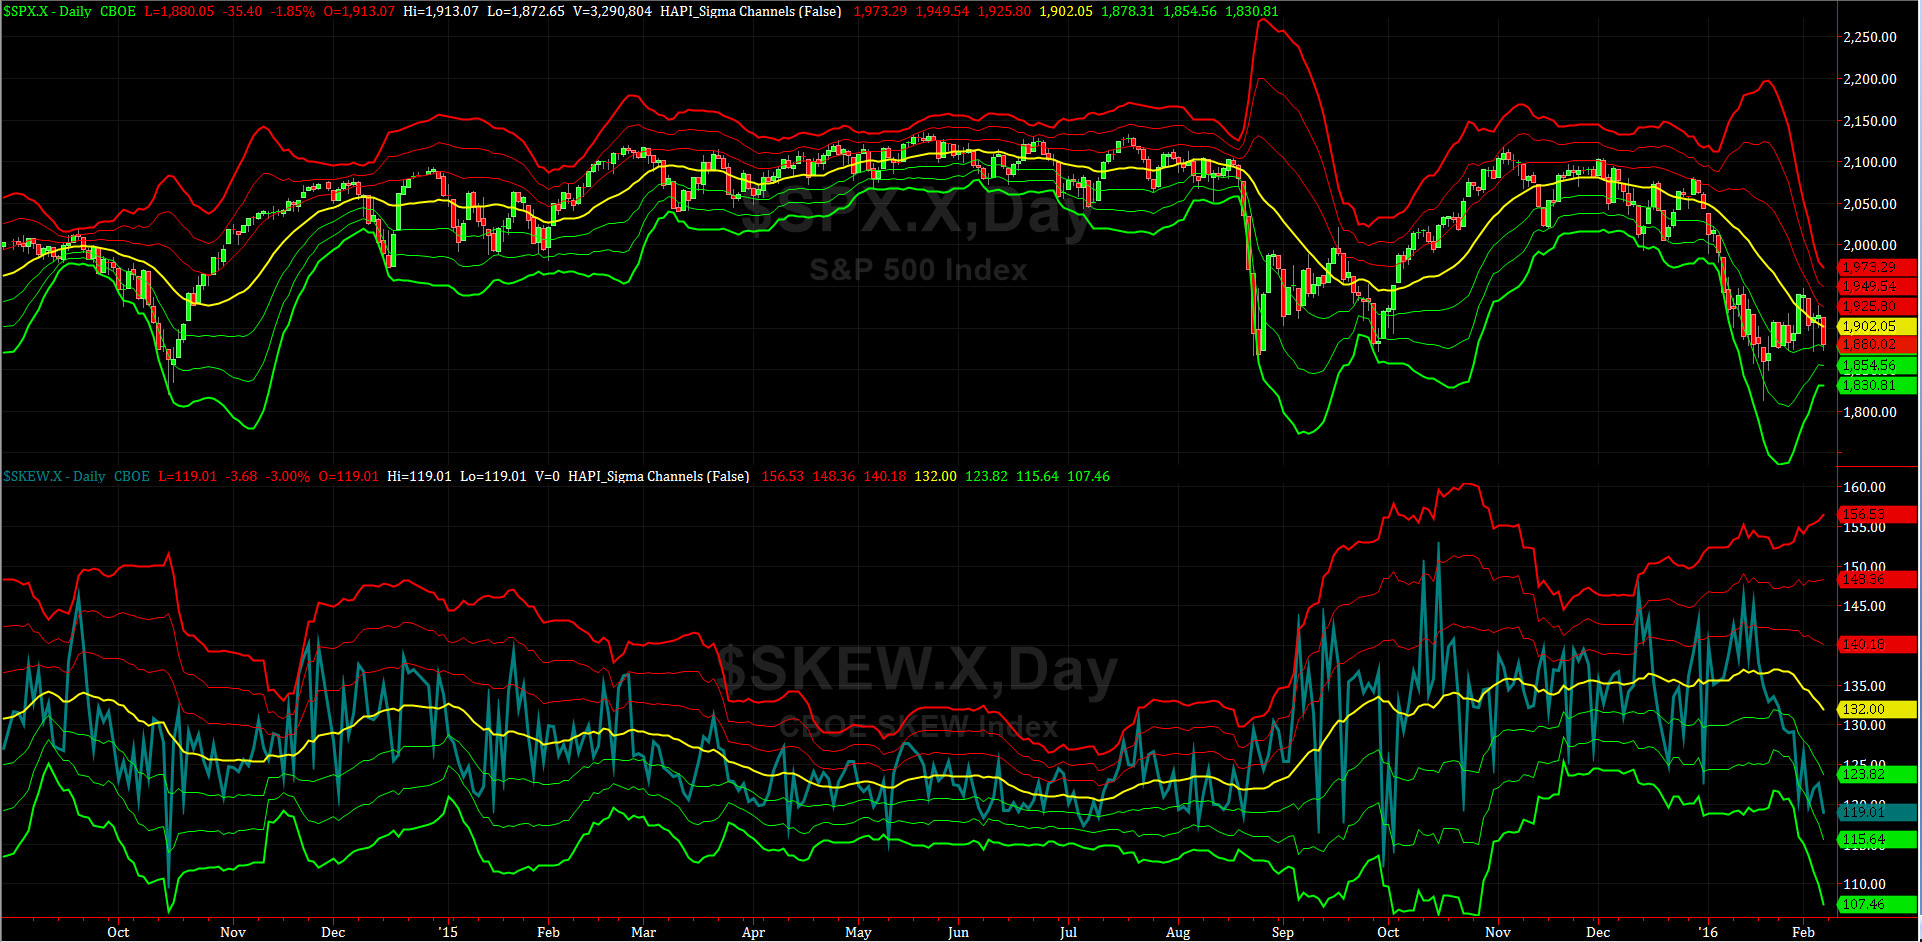
SPX SKEW (Tail Risk) Chart
SPX SKEW (Tail Risk) = 119 and about its -1.5 sigma (normal = 120-125, range 100-150)
All Quiet on the MidWestern Front? It should not be, given the recent price action.
This is a very interesting reading. We think SPX tail options are mispriced here, but then again what do we know. After all, a PDI is no Admiral, LOL.
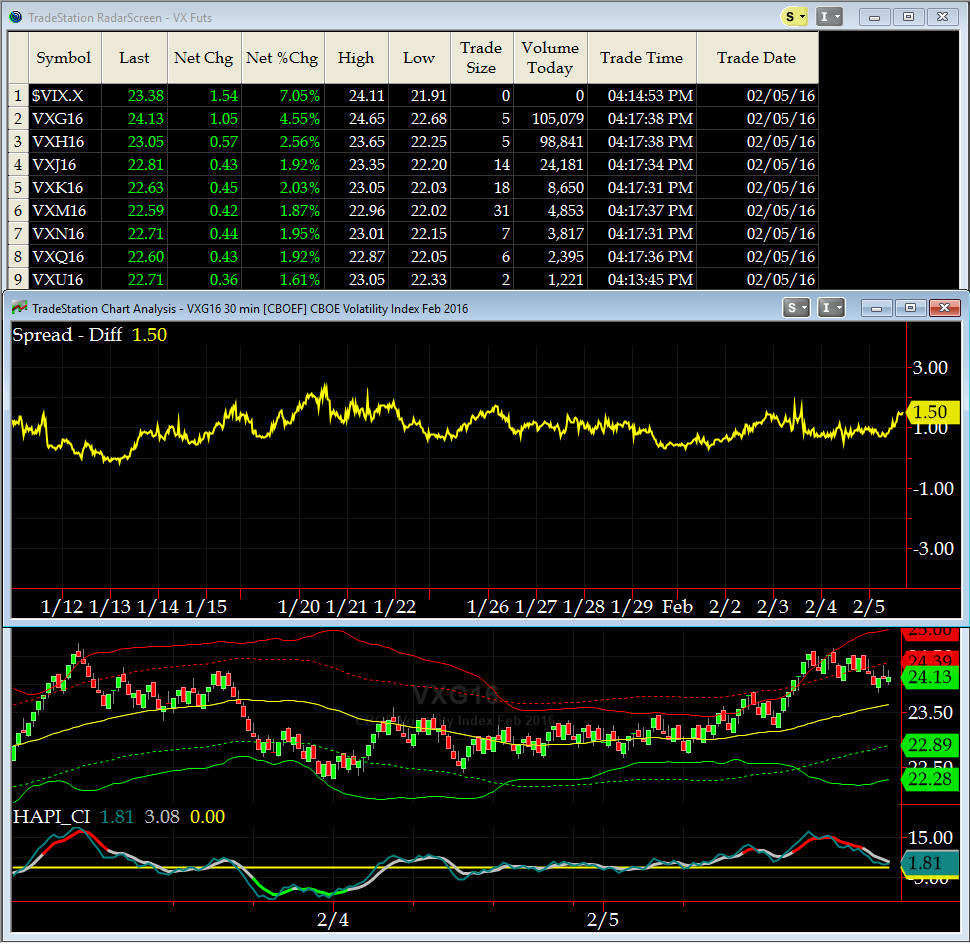
3-month VIX Futures Spread(VX) Chart
Our 3-month VIX Futures Spread (LONG FEB16 SHORT MAY16), closed Friday at +1.38. That's neutral for now.
HA_SP2 Chart
HA_SP2 = 35.3 (Buy signal <= 25, Sell Signal >= 75)
At ~35, this prop indicator is near neutral.
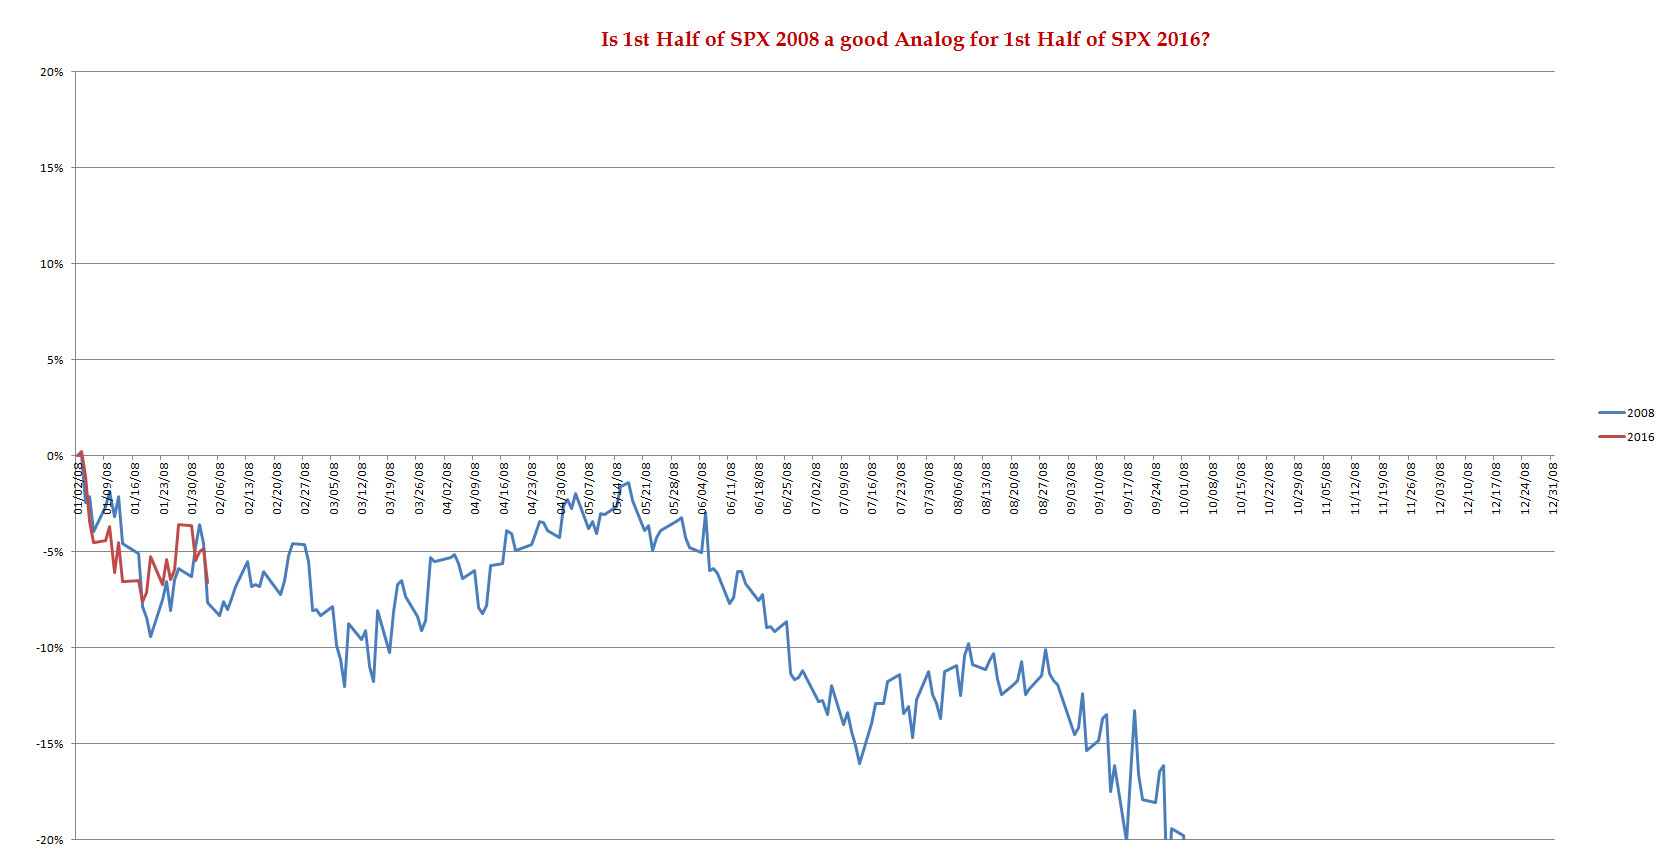
SPX 2008 Analog for SPX 2016
My co-pilot, @Capt_Tiko, continues to anxiously track the 2008 price action. He tells us that 2016 is a lot like 2008 at least for first quarter or even may be firt half. Only time will tell. We think we should also watch 2011 & 2012 Analogs.
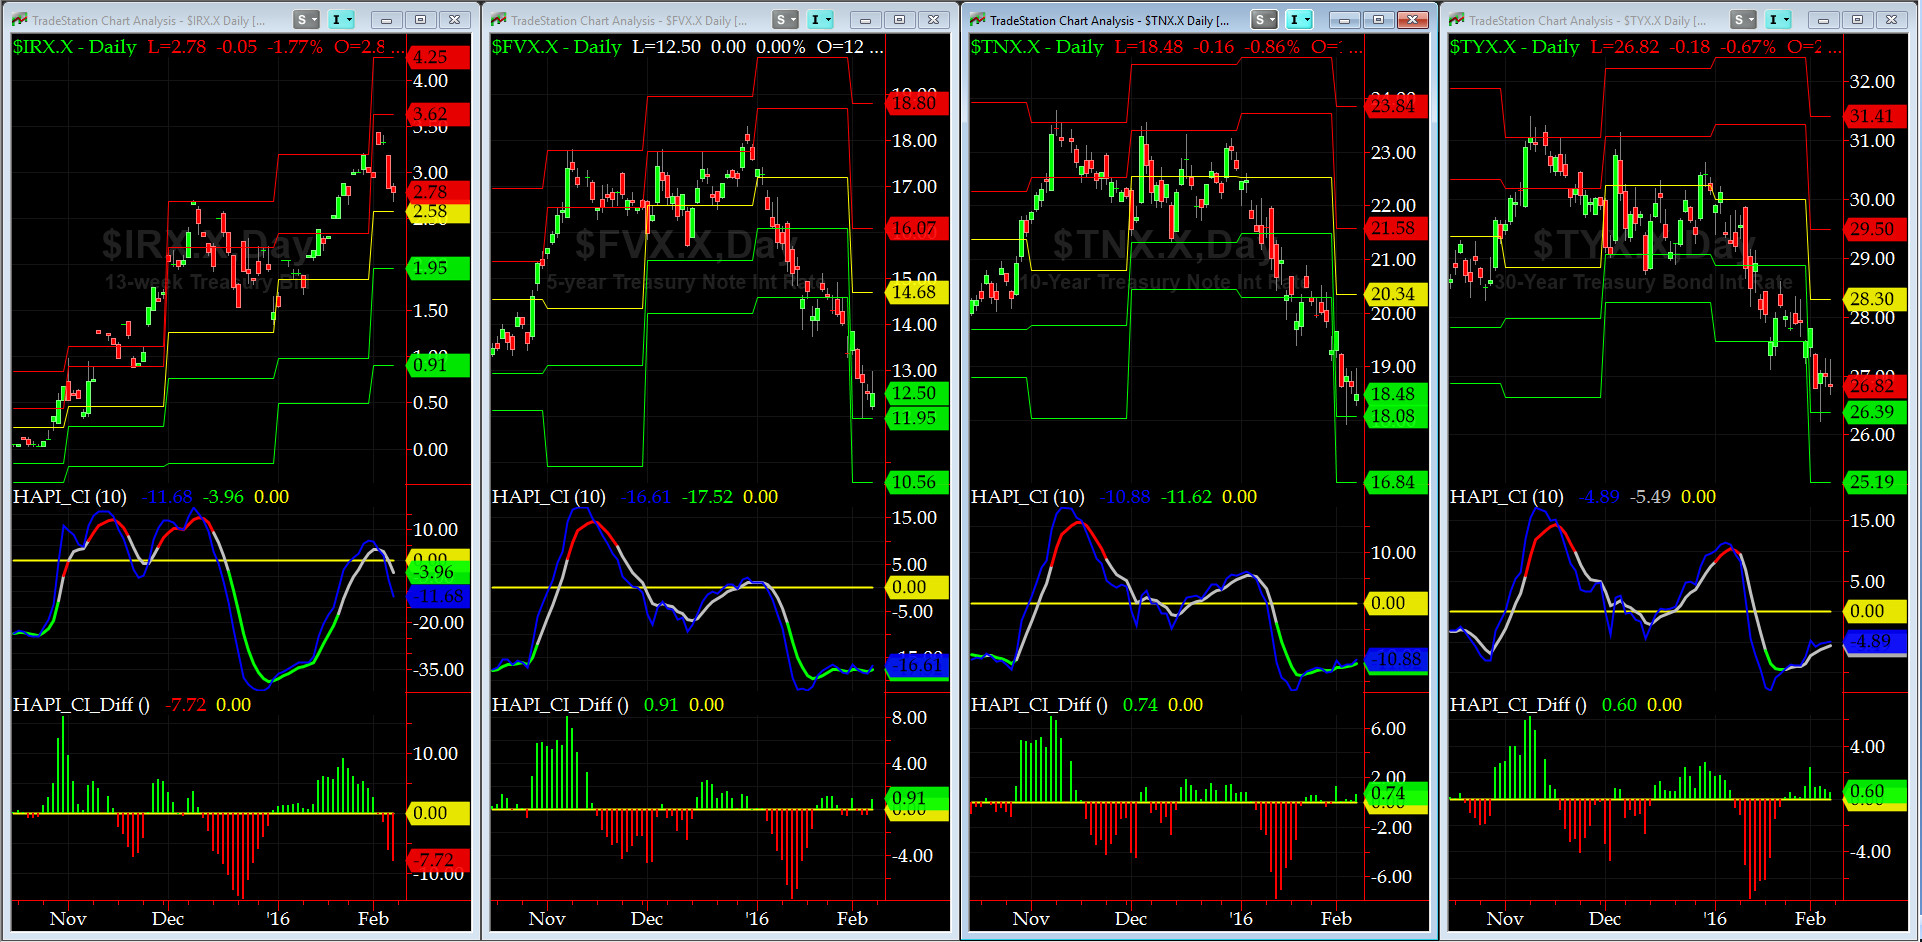
US Treasury T-Notes & T-Bonds Yields Chart
Treasury Complex Yields continued to ease down for most part of last week. This is NOT what Auntie Janet was looking for.
GO DENVER GO.....
Fari Hamzei
|


 Proactive Market Timing