|
Saturday, February 20, 2016 1400ET
Market Timing Charts, Analysis & Commentary for Issue #132
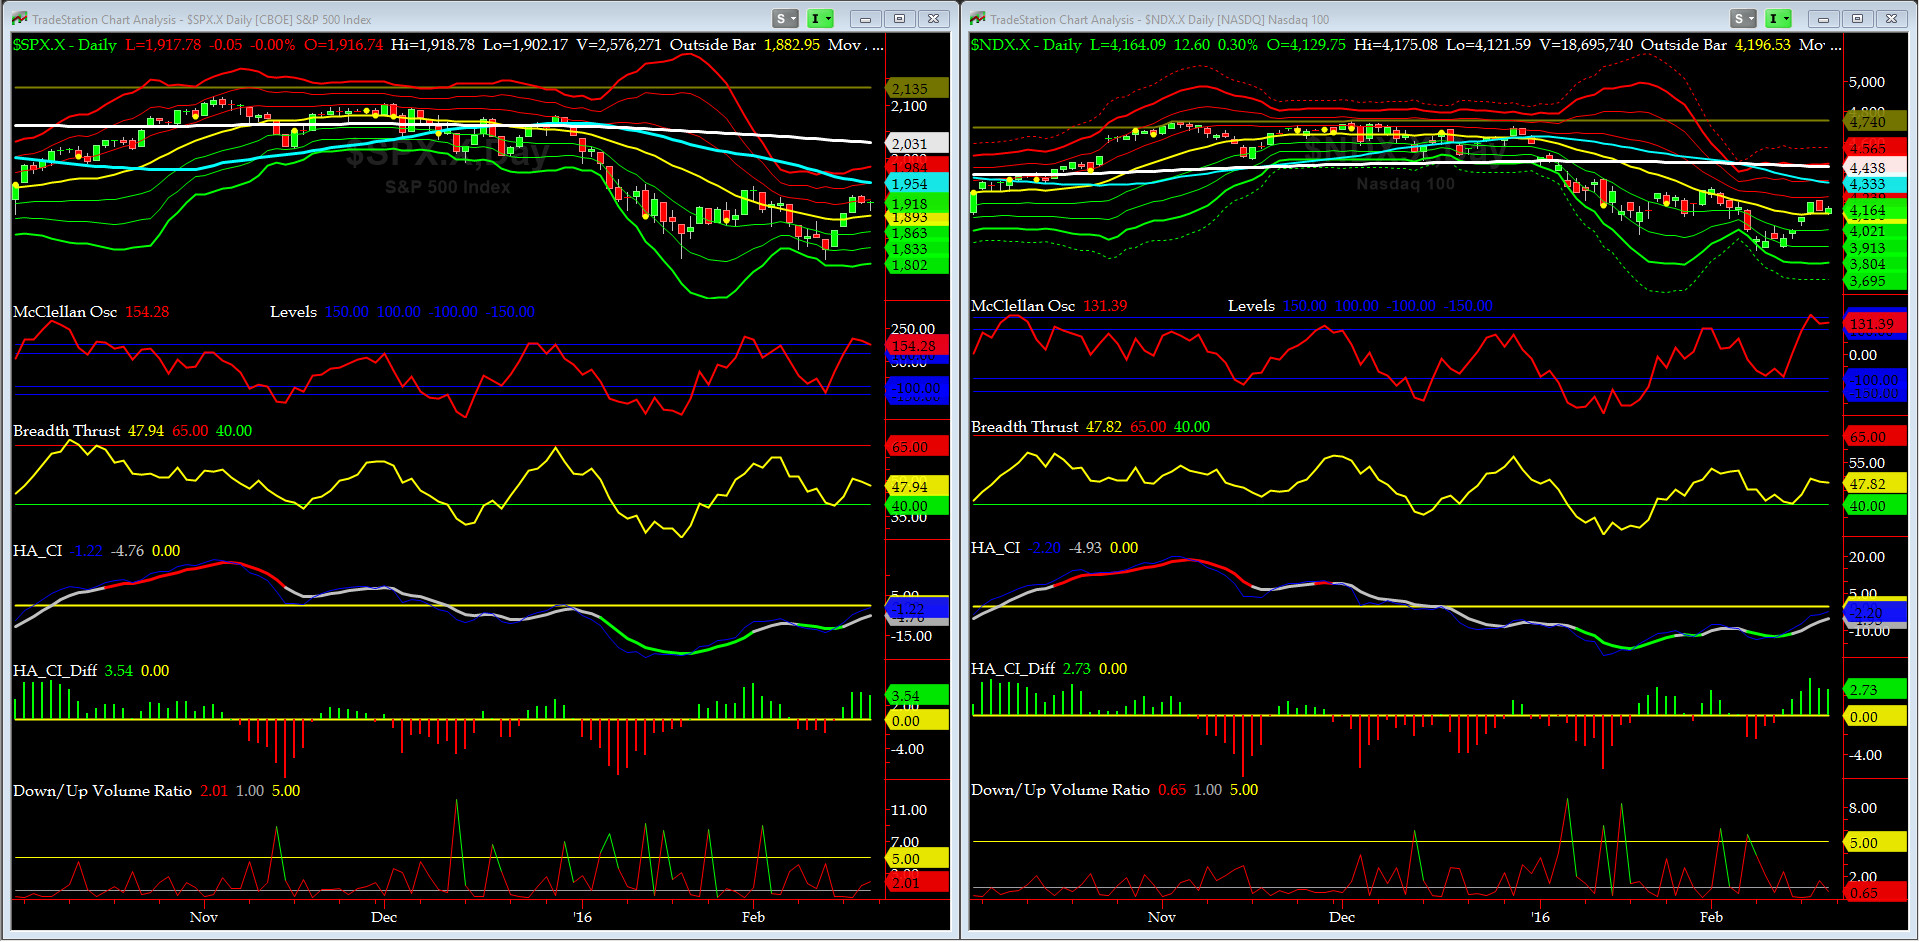
Timer Charts of S&P-500 Cash Index (SPX) + NASDAQ-100 Cash Index (NDX)
Most recent S&P-500 Cash Index (SPX): 1917.78 up +53.00 (up +2.84%) for the week ending on Friday, February 19th, 2016, which closed near its +1 sigma.
SPX ALL TIME INTRADAY HIGH = 2134.72 (reached on Wednesday, May 20th, 2015)
SPX ALL TIME CLOSING HIGH = 2130.82 (reached on Thursday, May 21st, 2015)
Current DAILY +2 Sigma SPX = 1954 with WEEKLY +2 Sigma = 2160
Current DAILY 0 Sigma (20 day MA) SPX = 1893 with WEEKLY 0 Sigma = 2002
Current DAILY -2 Sigma SPX = 1833 with WEEKLY -2 Sigma = 1843
NYSE McClellan Oscillator = +154 (-150 is start of the O/S area; around -275 to -300 area or lower, we go into the �launch-pad� mode, over +150, we are in O/B area)
NYSE Breadth Thrust = 47.94 (40 is considered as oversold and 65 as overbought)
Friday OX price action gave us a hammer. That's constructive for Da Bulls.
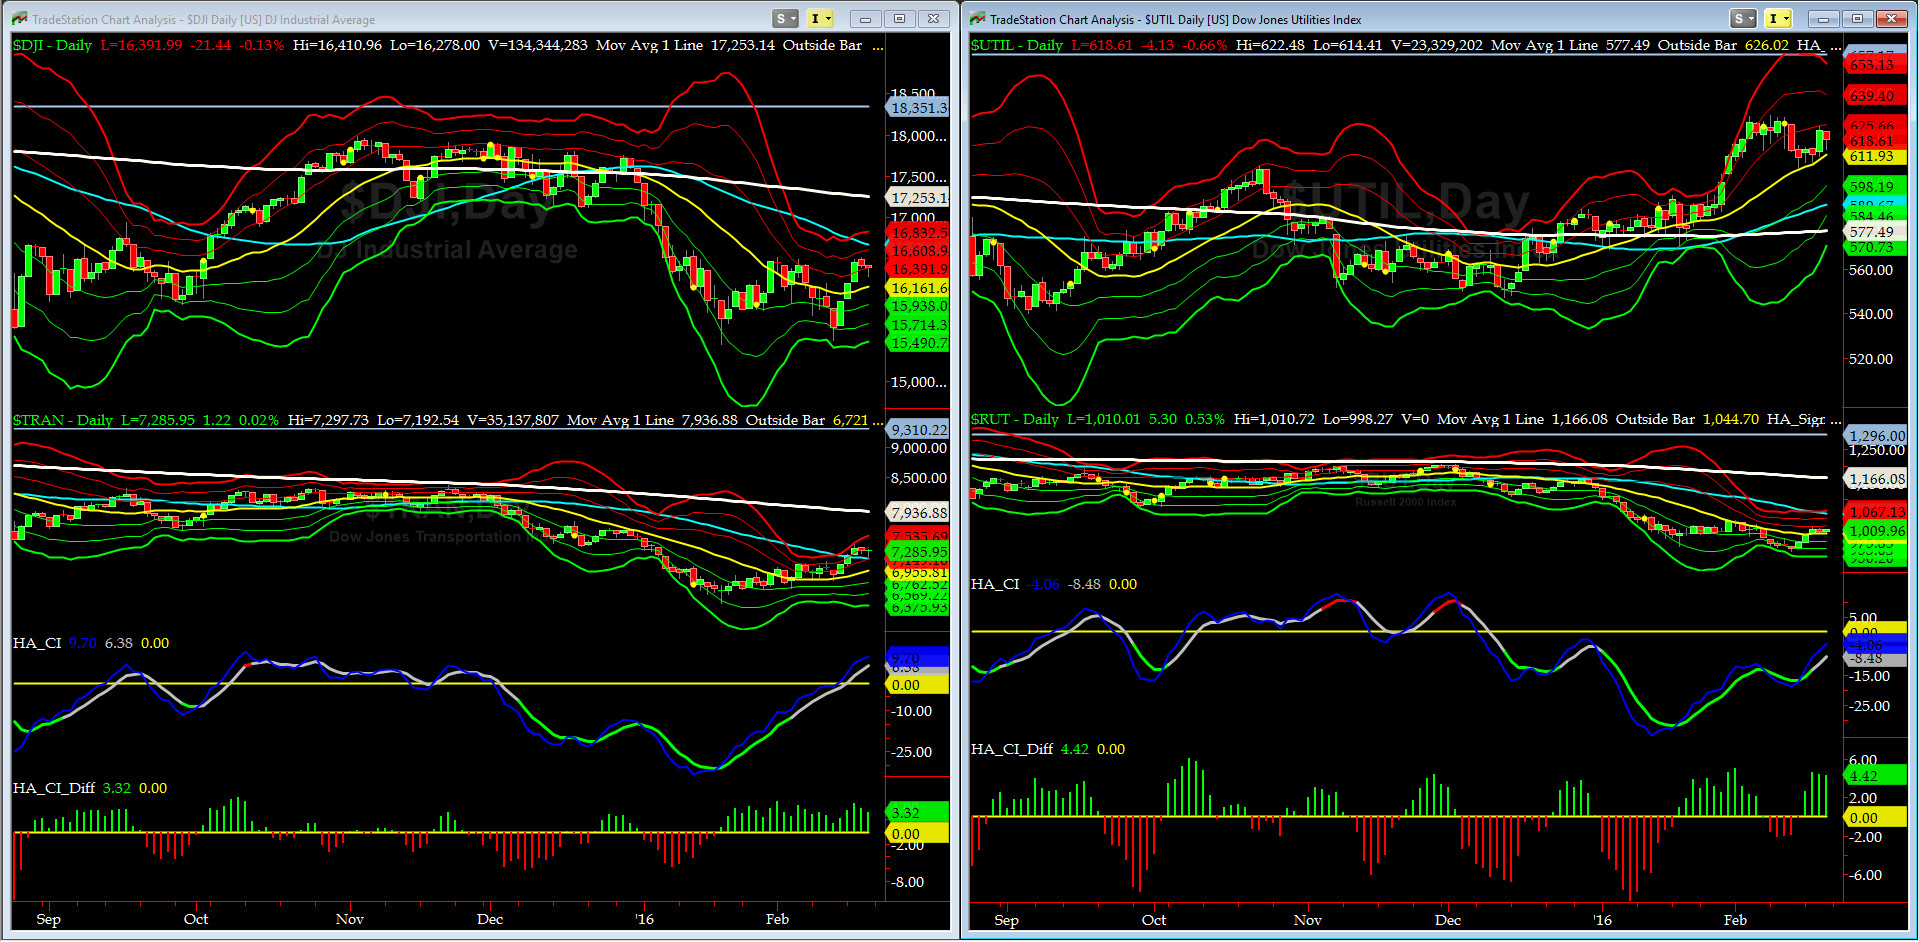
Canaries [in the Coal Mine] Chart for DJ TRAN & RUT Indices
200-Day MA DJ TRAN = 7937 or -8.2% above DJ TRAN (max observed in last 5 yrs = 20.2%, min = -20.3%)
200-Day MA RUT = 1166 or -13.4% above RUT (max observed in last 5 yrs = 21.3%, min = -22.6%)
DJ Transports (proxy for economic conditions 6 to 9 months hence) retested its zero sigma and climbing in the +1 to +2 sigma channel.
Russell 2000 Small Caps (proxy for RISK ON/OFF) is about to have a channel breakout. RISK is still OFF, ioho.
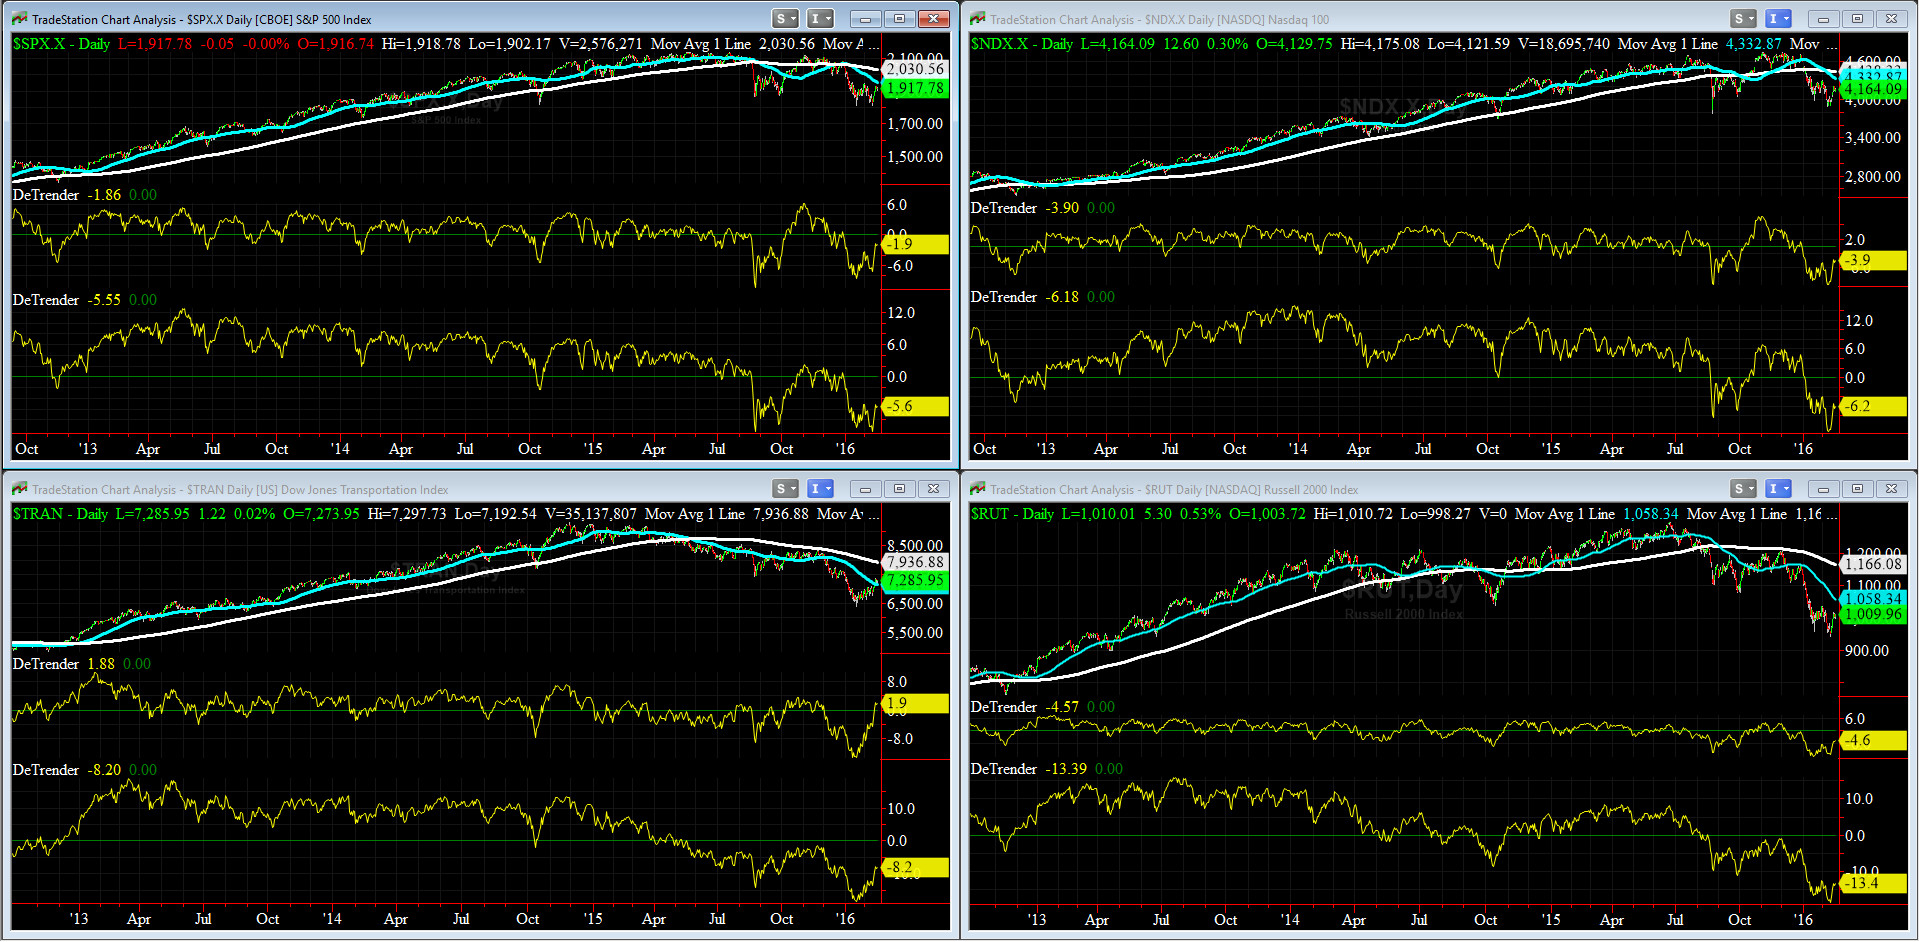
DeTrenders Charts for SPX, NDX, TRAN & RUT Indices
50-Day MA SPX =1954 or -1.9% above SPX (max observed in last 5 yrs = +8.6%, min = -9.3% )
200-Day MA SPX = 2030 or -5.6% above SPX (max observed in last 5 yrs = 15.2%, min = -14%)
Seven of our Eight DeTrenders are negative but all have improved since Jan lows.
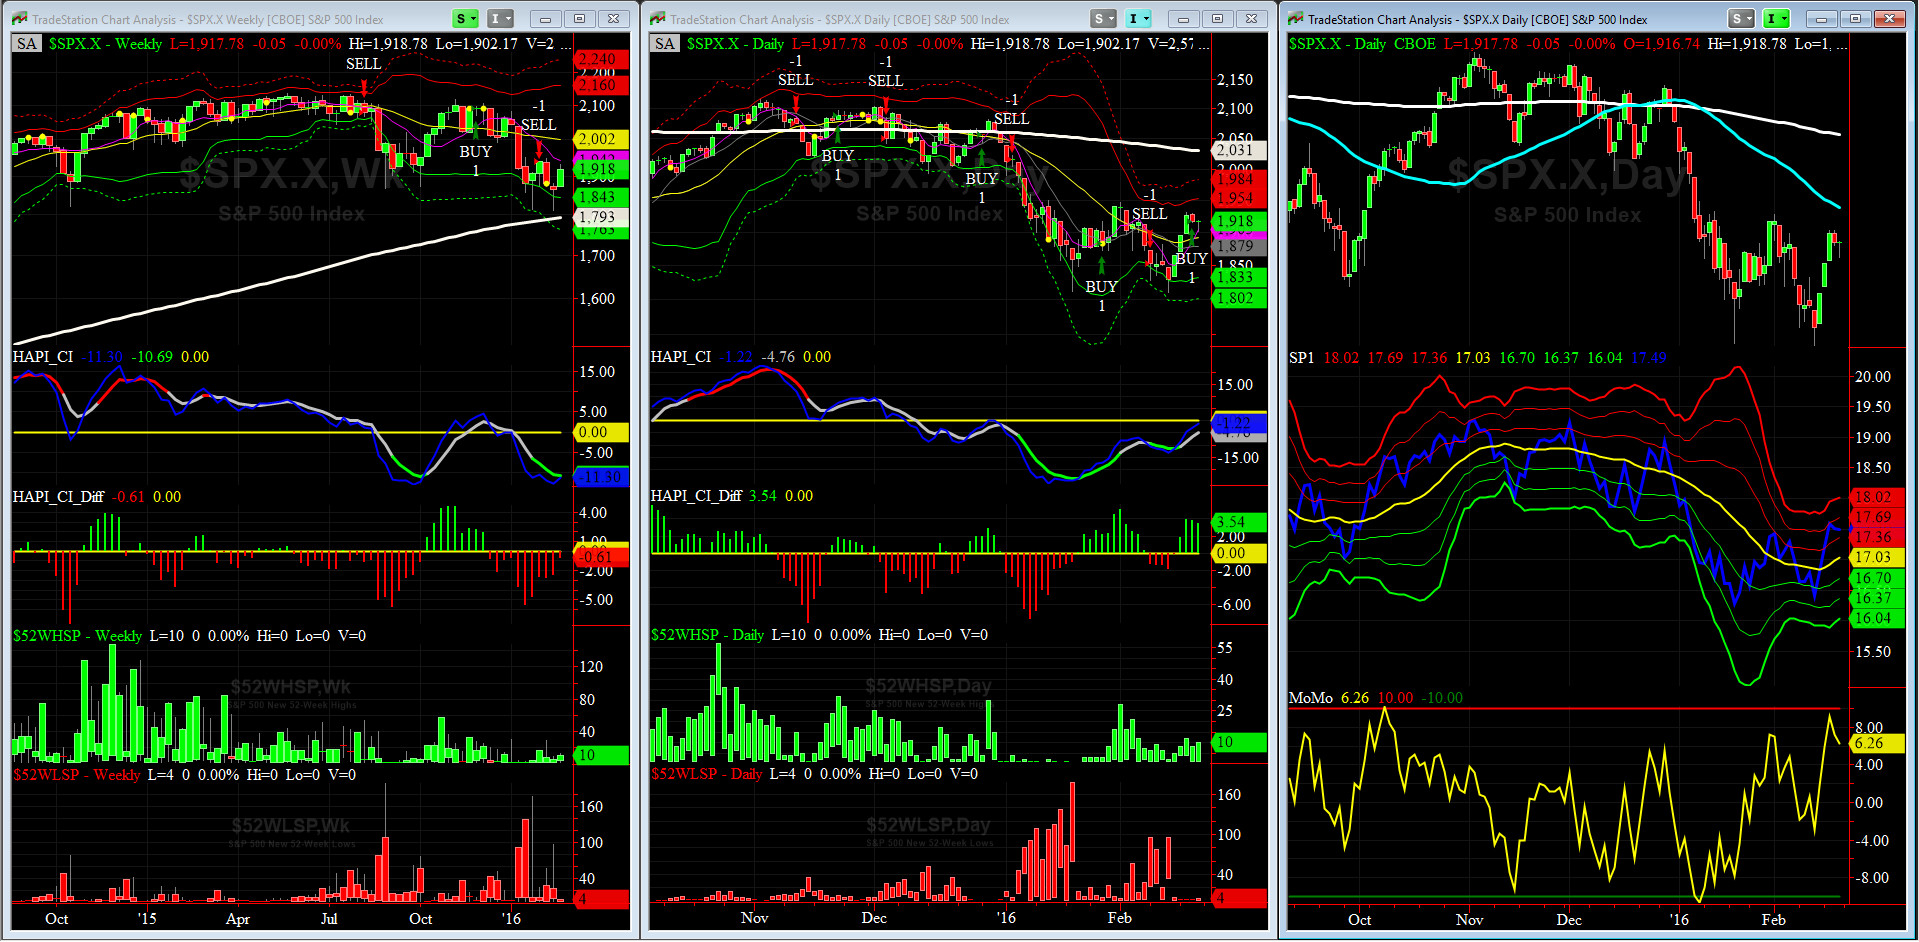
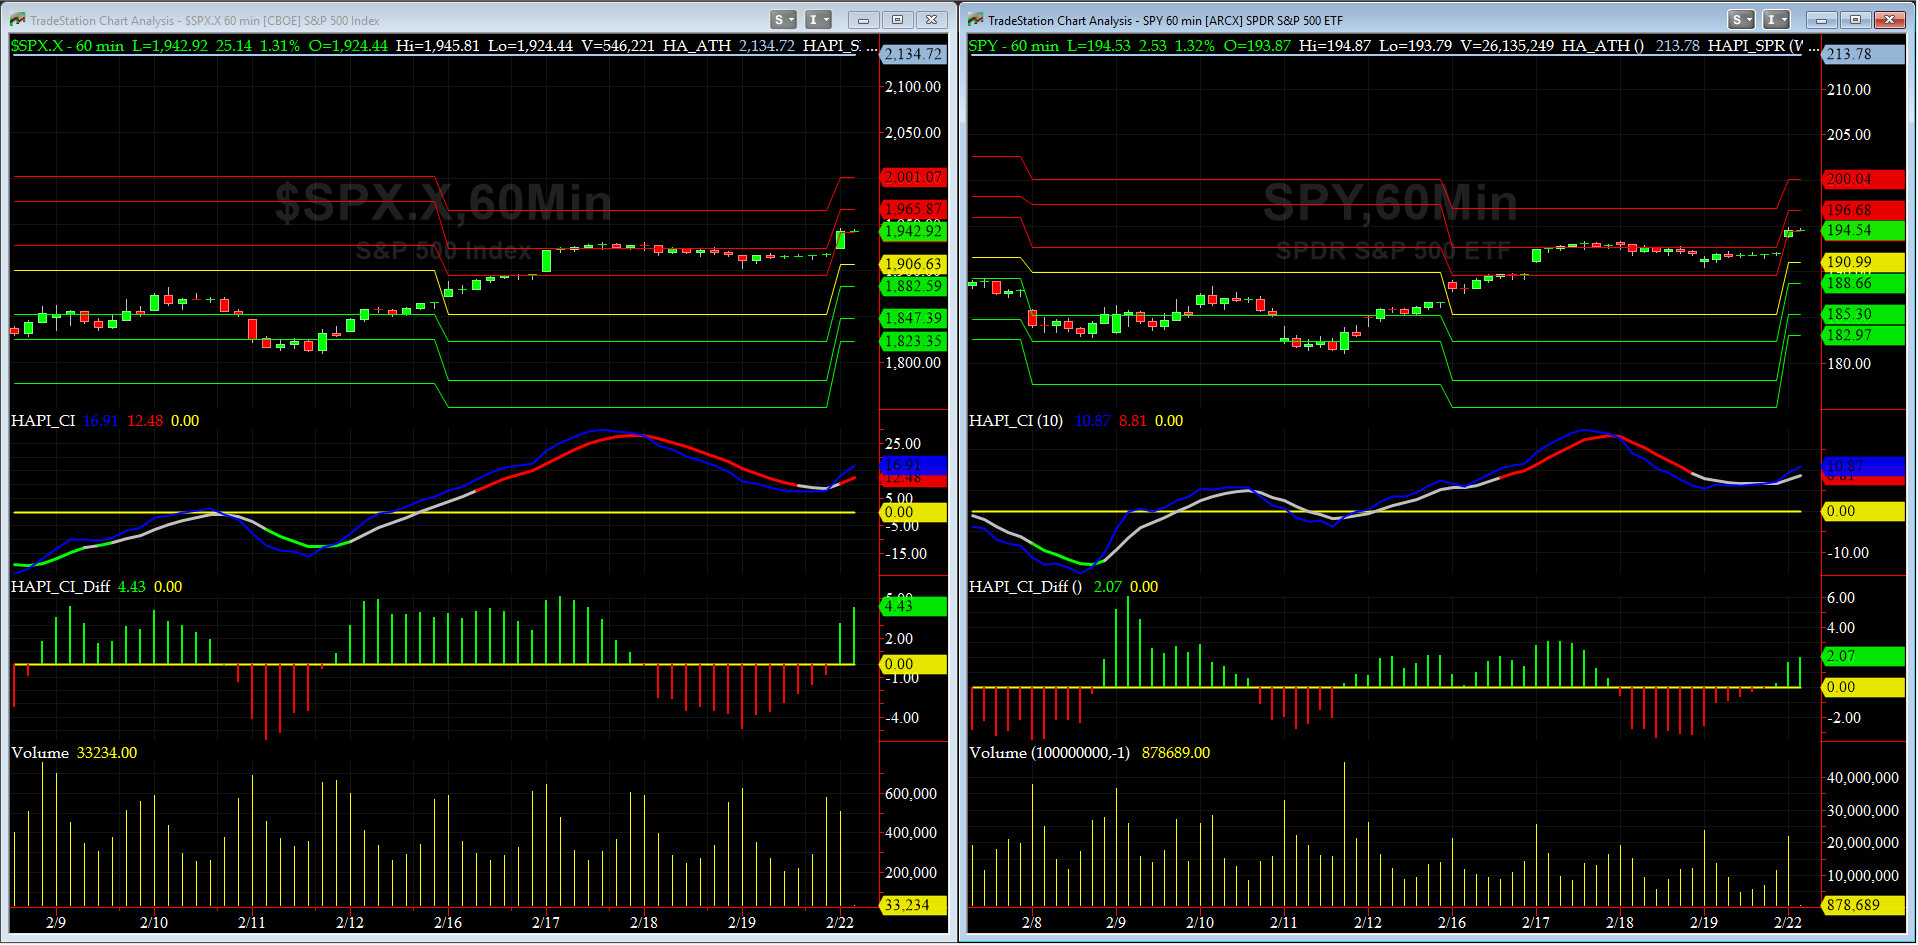
HA_SP1_momo Chart
WEEKLY Timing Model = on a SELL Signal since Friday 1/29/16 CLOSE
DAILY Timing Model = on a BUY Signal since Thursday 2/18/16 CLOSE
Max SPX 52wk-highs reading last week = 12 (over 120-140, the local maxima is in)
Max SPX 52wk-Lows reading last week = 4 (over 40-60, the local minima is in)
HA_SP1 = almost at its +1.5 Sigma
HA_Momo = +6.3 (reversals most likely occur above +10 or below -10)

Vol of the Vols Chart
VIX = 20.5 which is just below its -1 sigma (remember it�s the VIX�s vol pattern (its sigma channels) that matters, and not the level of VIX itself (this is per Dr. Robert Whaley, a great mentor and the inventor of original VIX, now called VXO. VIX usually peaks around a test of its +4 sigma).
As stated here in the last 3 weeks, this shockwave is over till the next shoe drops.
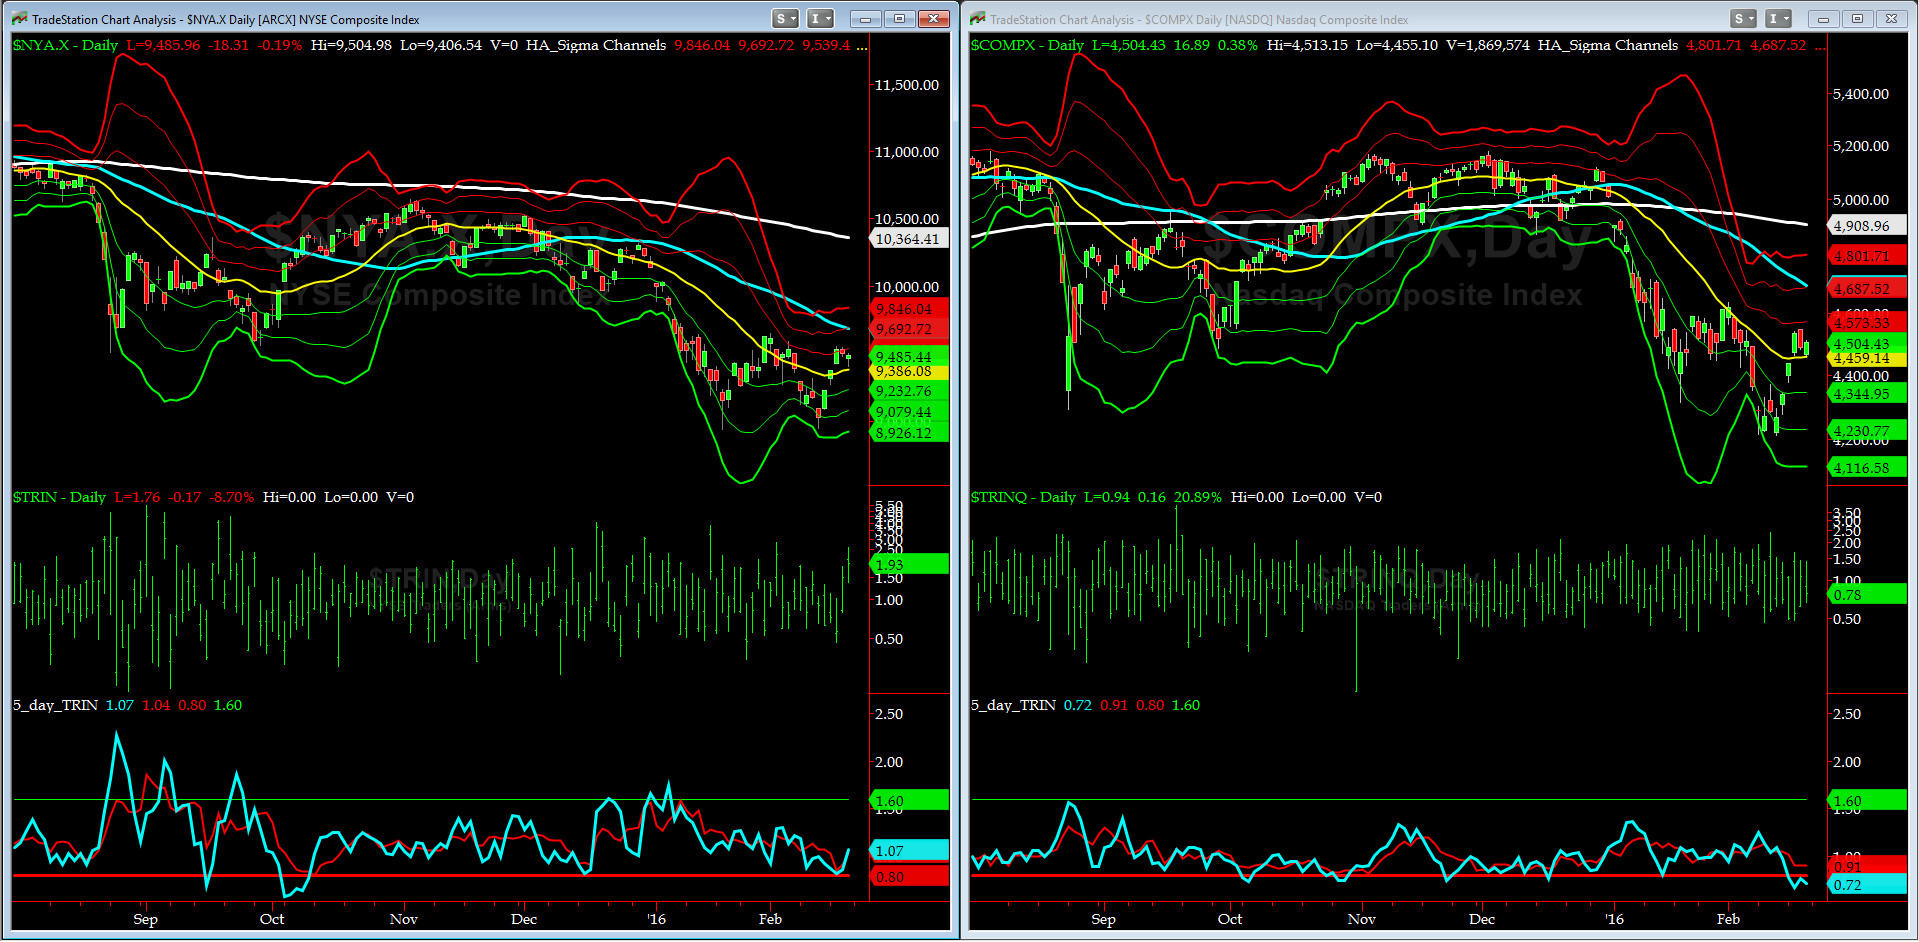
5-day TRIN & TRINQ Charts
Both 5-day TRIN (for NYSE) and 5-day TRINQ (for NASDAQ) Indicators are in SELL signal mode here.
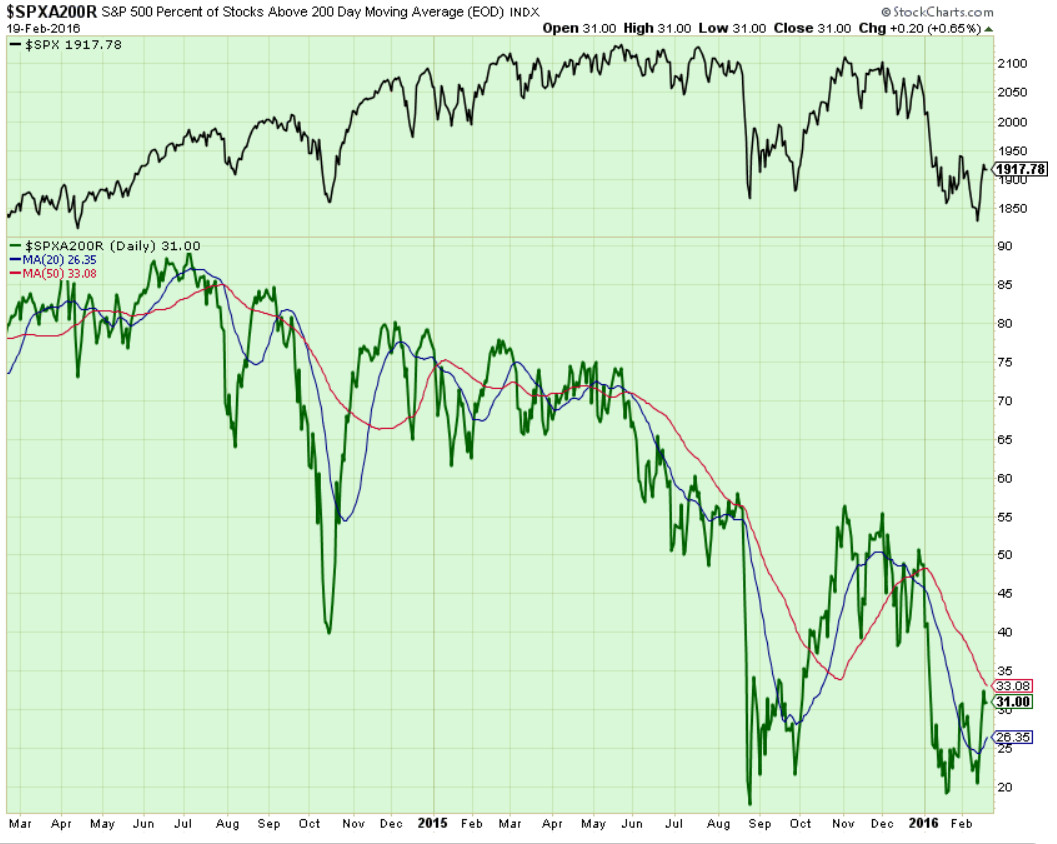
Components of SPX above their respective 200day MA Chart
We closed the week at 31% for this scoring indicator, and still struggling to get over its 50-day MA, which is at 33% now (red line).
Notice the Divergence with SPX.
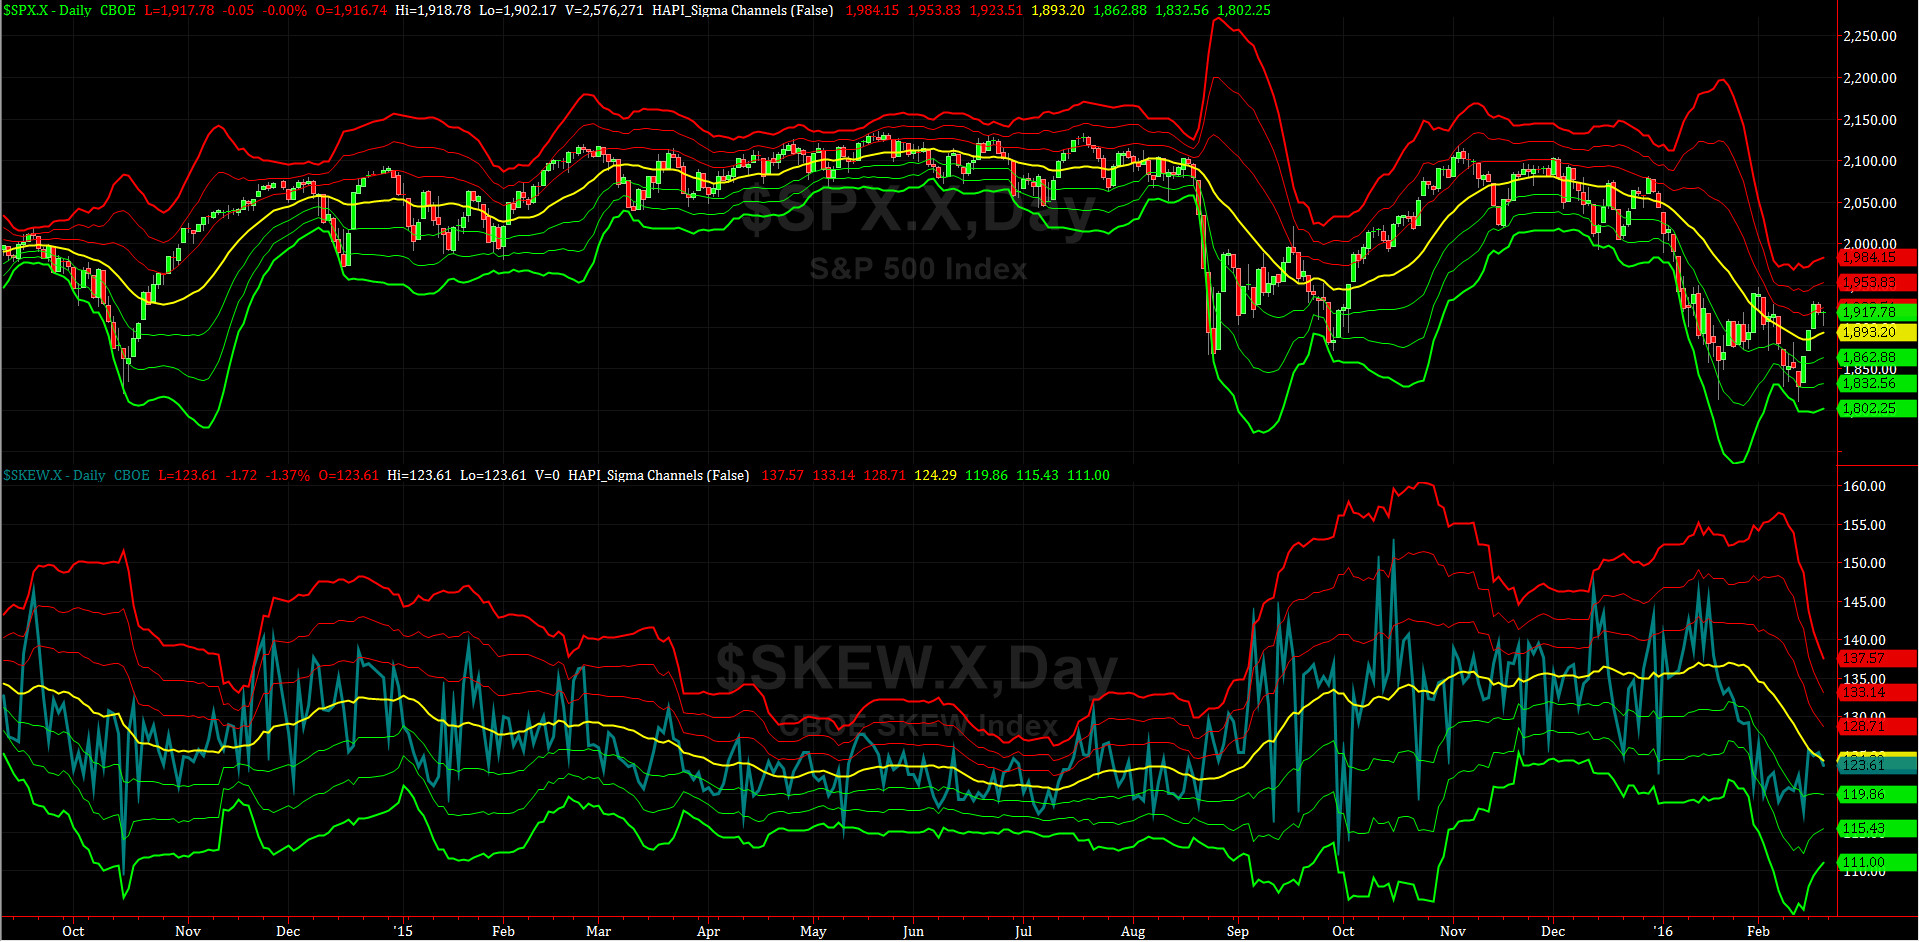
SPX SKEW (Tail Risk) Chart
SPX SKEW (Tail Risk) = 123 and about its zero sigma (normal = 120-125, range 100-150)
All Quiet on the MidWestern Front? And, is Smart Money giving the all clear signal for a rise to 200-day MA (2020 to 2030 zone)? who knows, but we must pay attention to SKEW this week.

3-month VIX Futures Spread(VX) Chart
Our 3-month VIX Futures Spread (LONG MAR16 SHORT JUN16), closed Friday at -0.50. This says low is behind us for now.
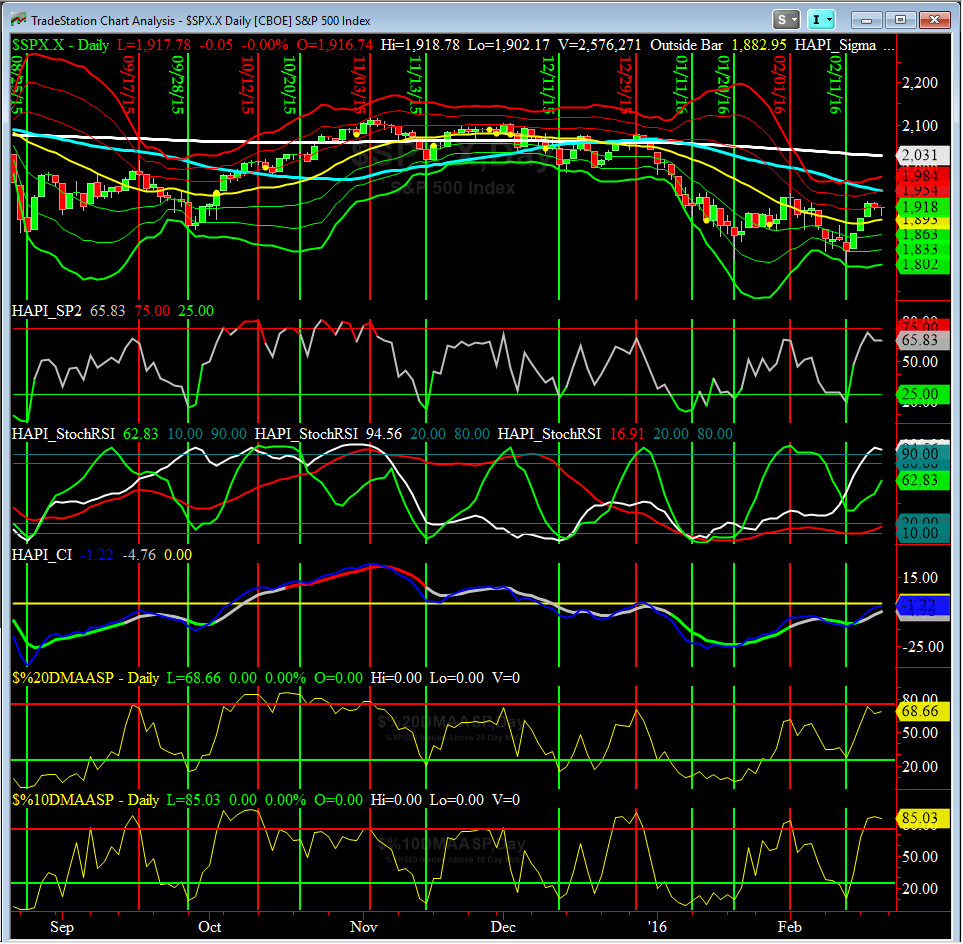
HA_SP2 Chart
HA_SP2 = 65.8 (Buy signal <= 25, Sell Signal >= 75)
At ~66, this prop indicator is near overbought.
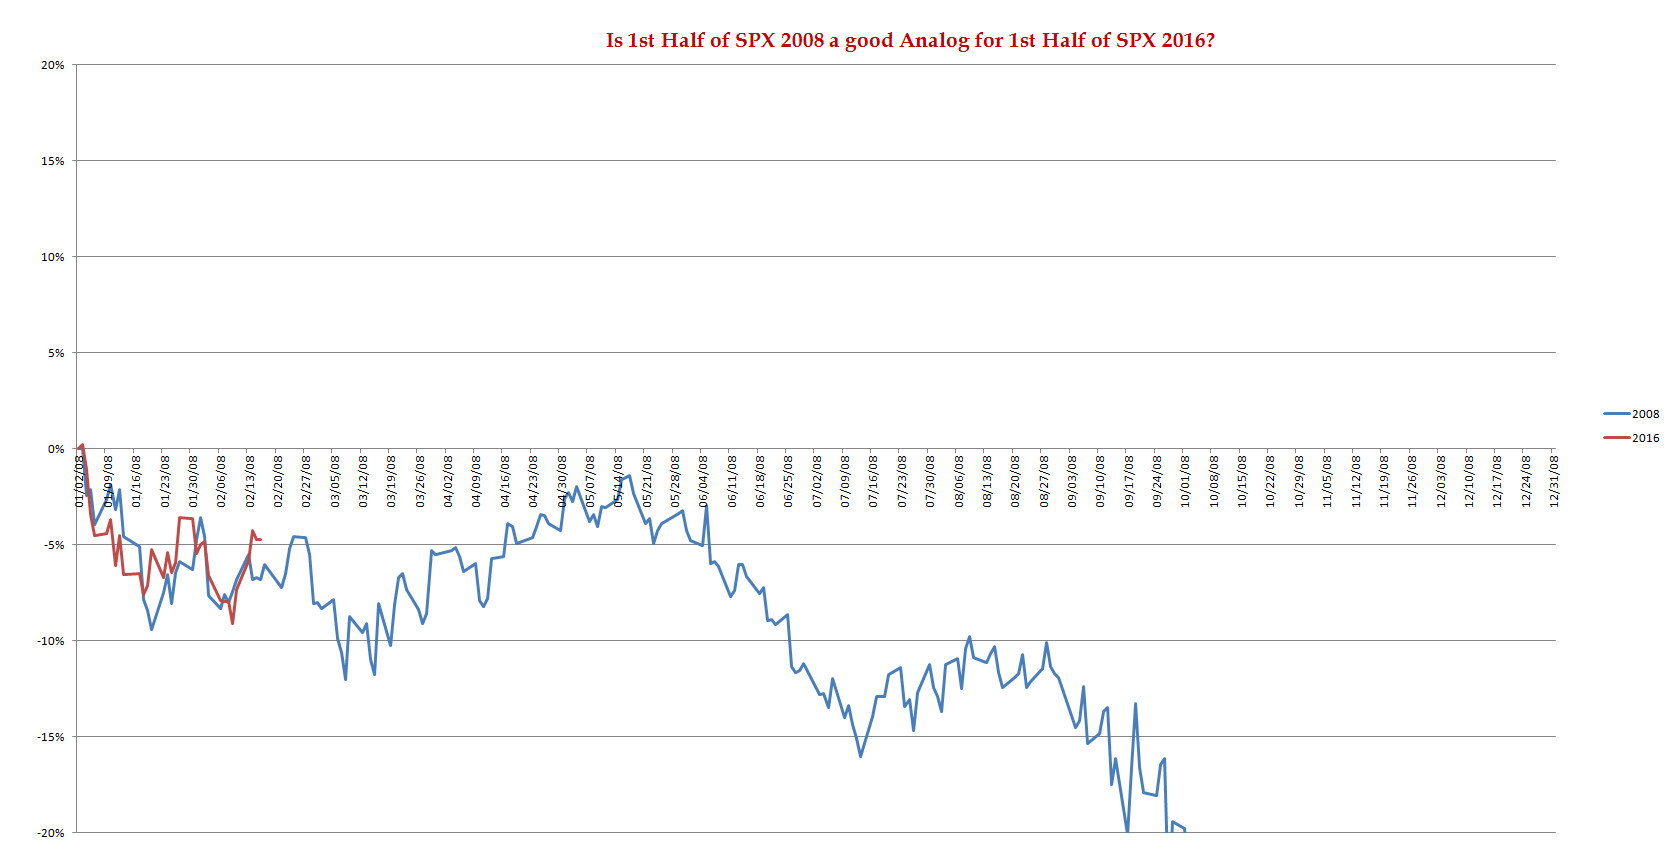
SPX 2008 Analog for SPX 2016
SPX 2016 tracking the SPX 2008 price action so far, says @Capt_Tiko, who is a lot smarter that we are. Oh well, we may have to start having whatever he is having: Alboacroe Tuna + Foumanat Tea.
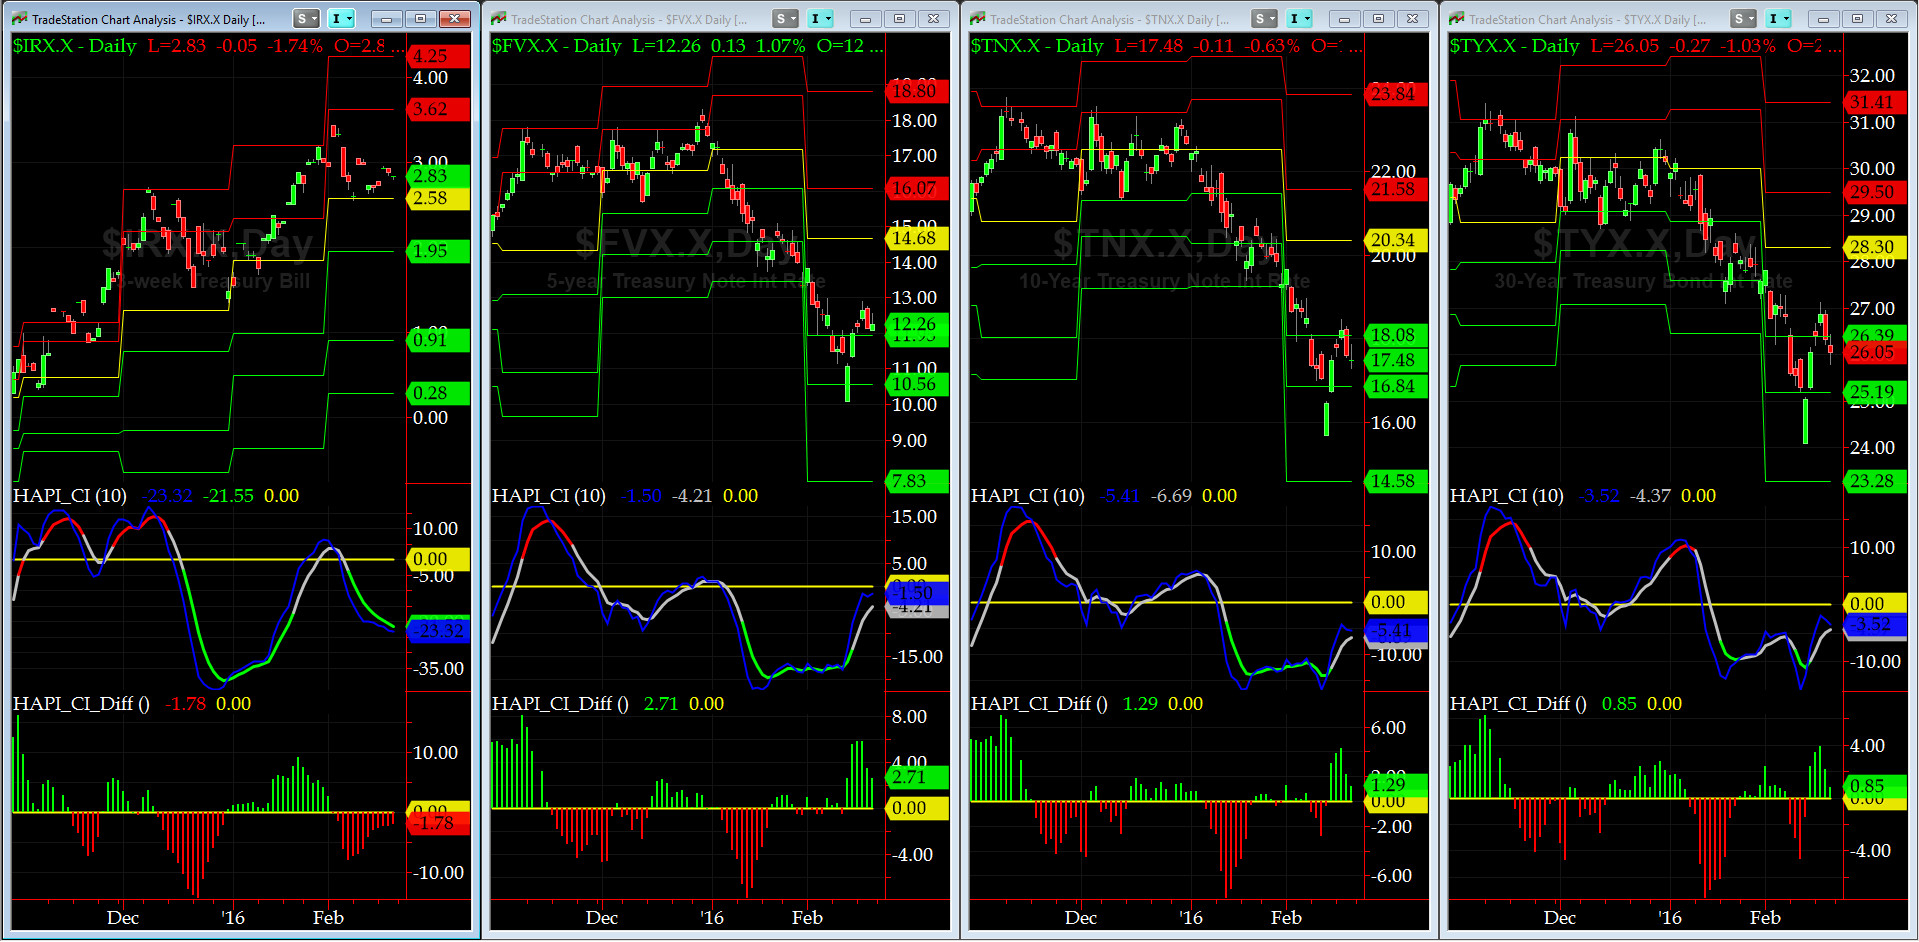
US Treasury T-Notes & T-Bonds Yields Chart
Treasury Complex Yields rose sharply on Thursday and Friday.
Fari Hamzei
|


 Proactive Market Timing