|
Sunday, February 28, 2016 2045ET
Market Timing Charts, Analysis & Commentary for Issue #133
Timer Charts of S&P-500 Cash Index (SPX) + NASDAQ-100 Cash Index (NDX)
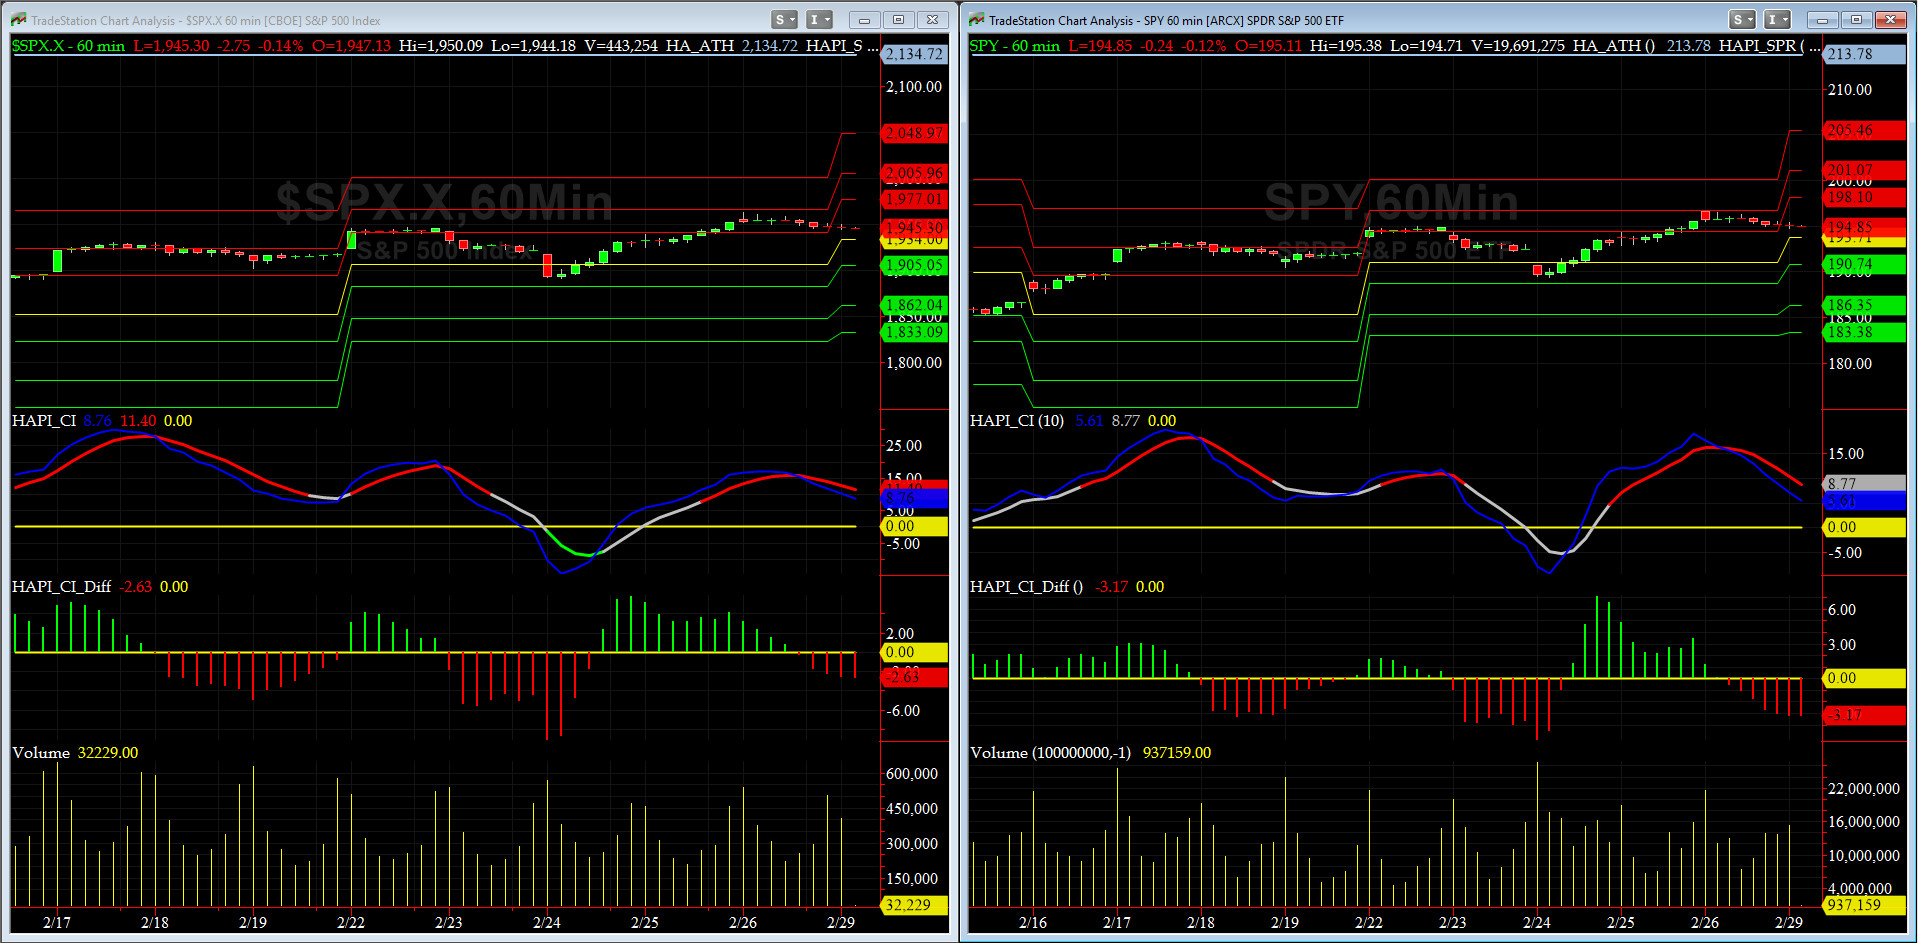
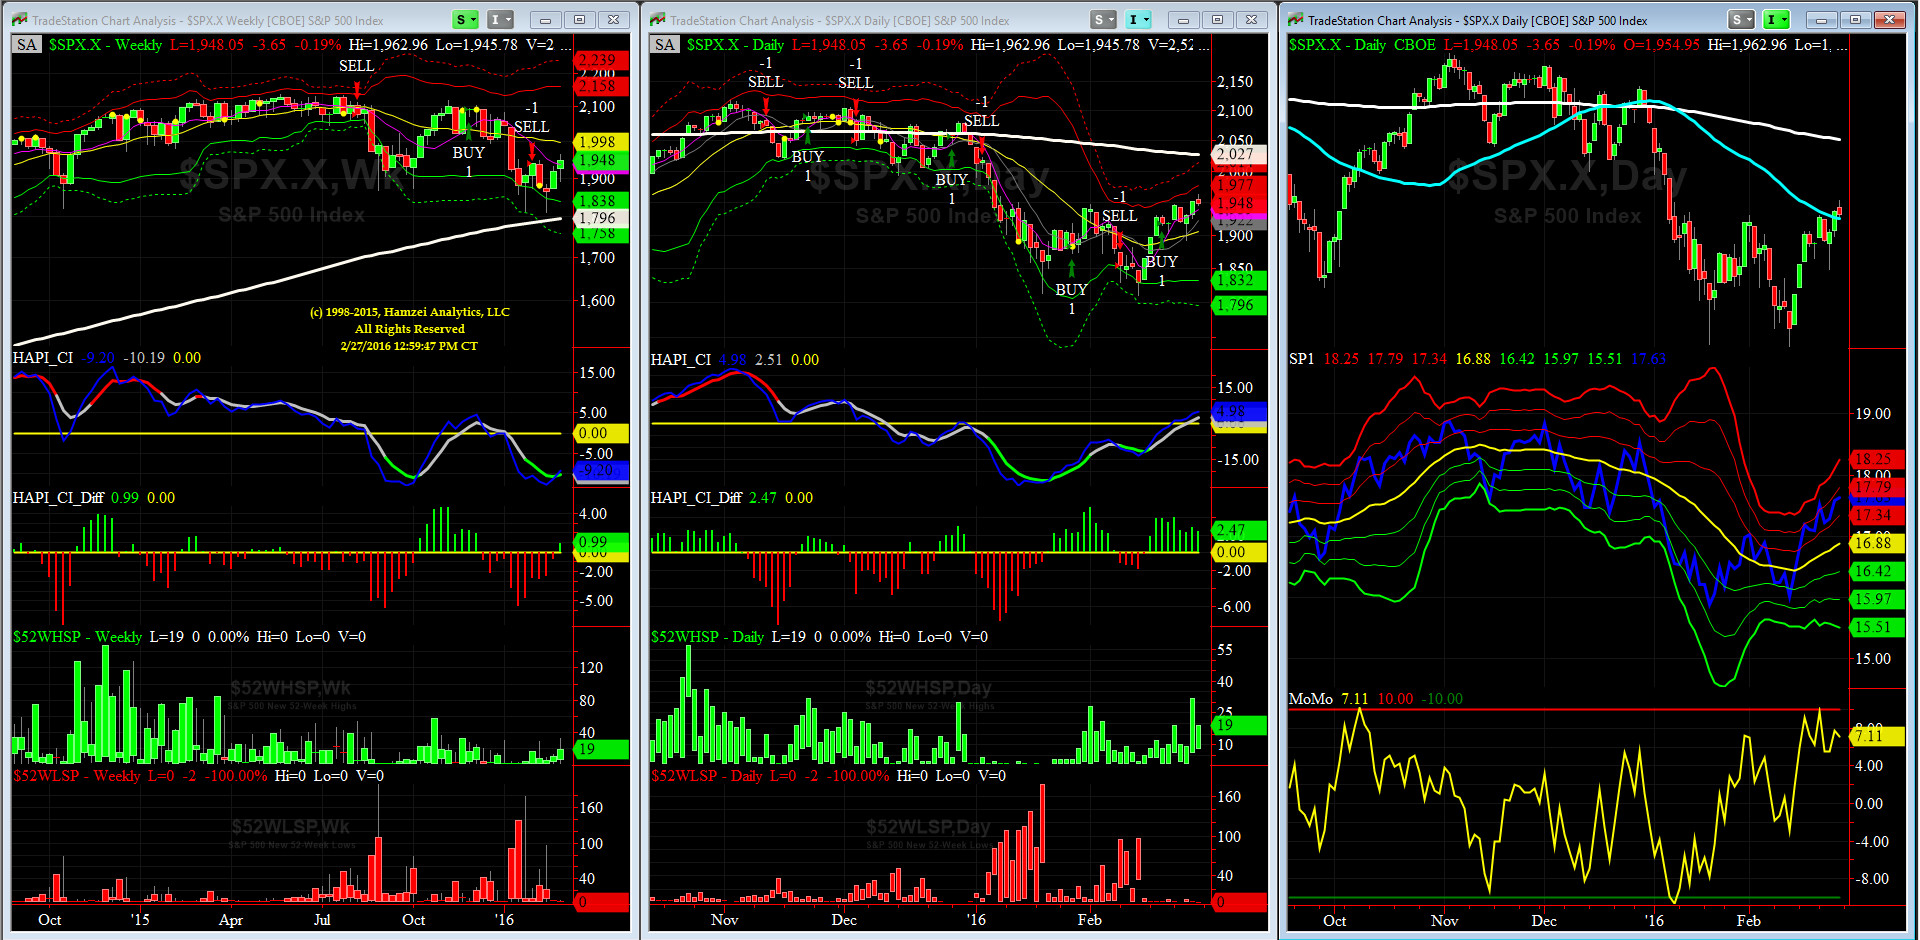
Most recent S&P-500 Cash Index (SPX): 1947.05 up +30.27 (up +1.58%) for the week ending on Friday, February 26th, 2016, which closed above its +1 sigma.
SPX ALL TIME INTRADAY HIGH = 2134.72 (reached on Wednesday, May 20th, 2015)
SPX ALL TIME CLOSING HIGH = 2130.82 (reached on Thursday, May 21st, 2015)
Current DAILY +2 Sigma SPX = 1977 with WEEKLY +2 Sigma = 2160
Current DAILY 0 Sigma (20 day MA) SPX = 1905 with WEEKLY 0 Sigma = 1998
Current DAILY -2 Sigma SPX = 1832 with WEEKLY -2 Sigma = 1838
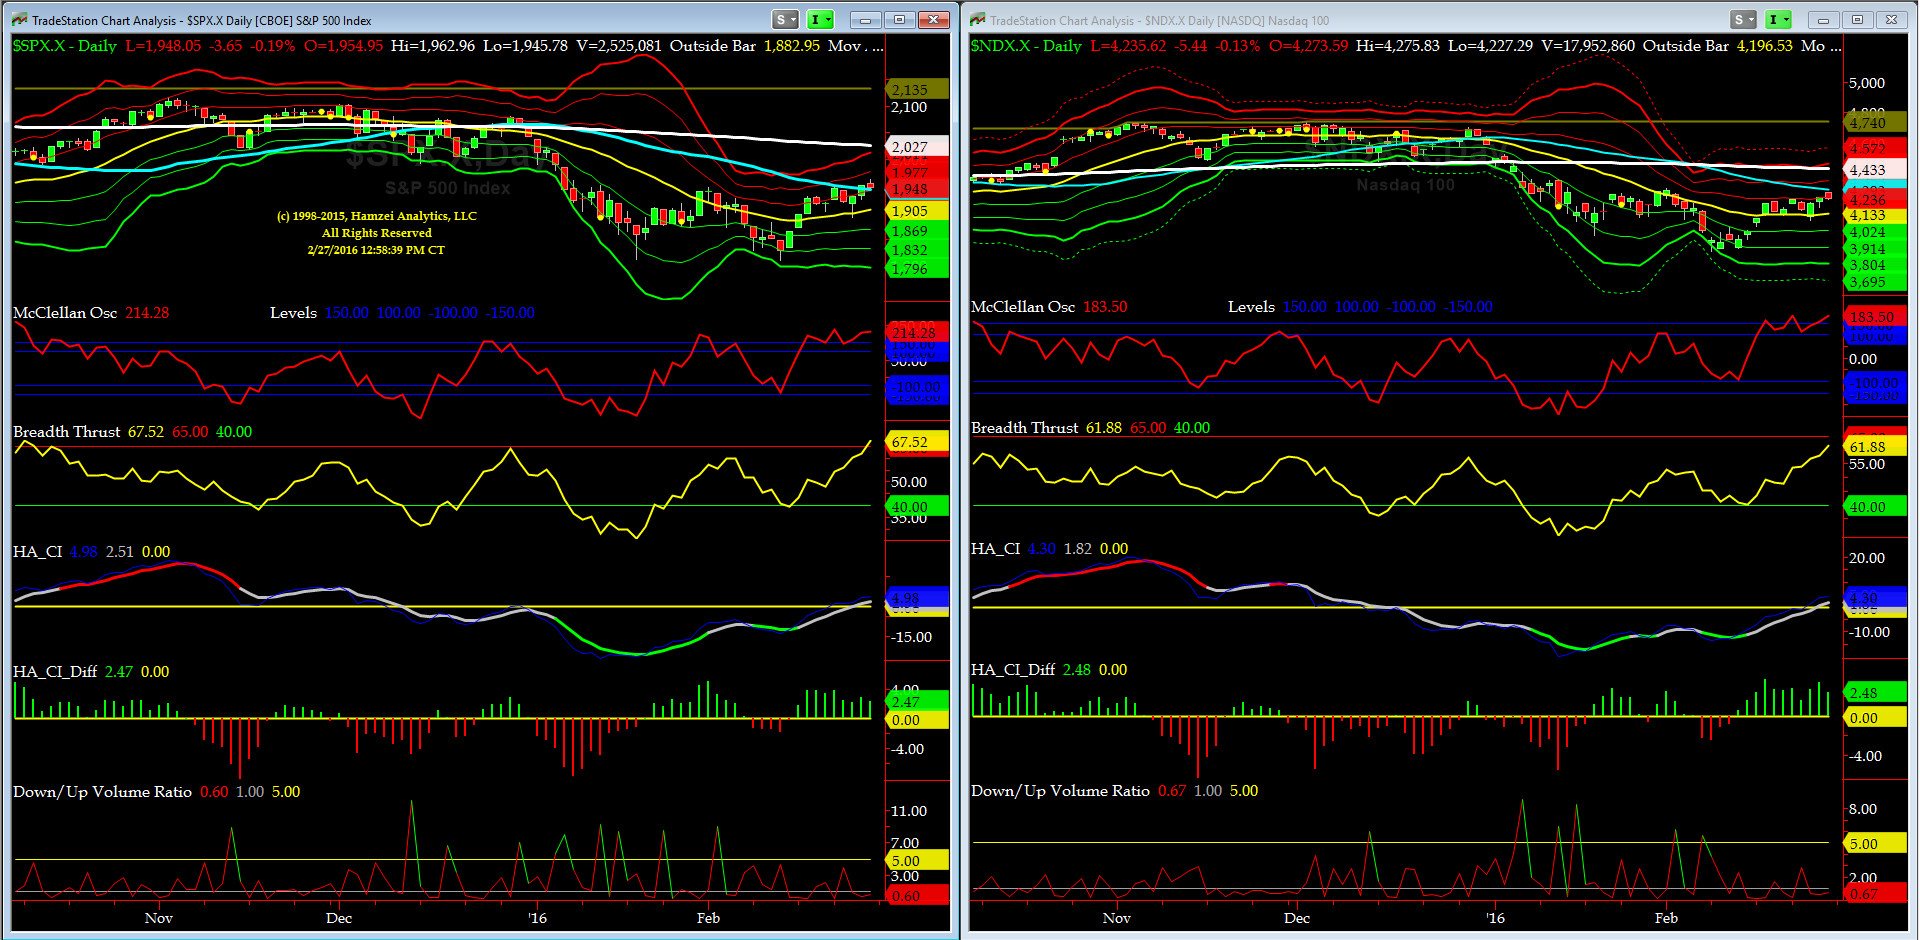
NYSE McClellan Oscillator = +214 (-150 is start of the O/S area; around -275 to -300 area or lower, we go into the �launch-pad� mode, over +150, we are in O/B area)
NYSE Breadth Thrust = 67.52 (40 is considered as oversold and 65 as overbought)
SPX finally captured 50 day MA, mainly due to better Crude Oil prices.... the key test is holding 50-day and building momentum towards 2020-2030 zone (200 day MA and +3 sigma) in pre- and post- FEB NFP which is due next Friday at 0830 ET.
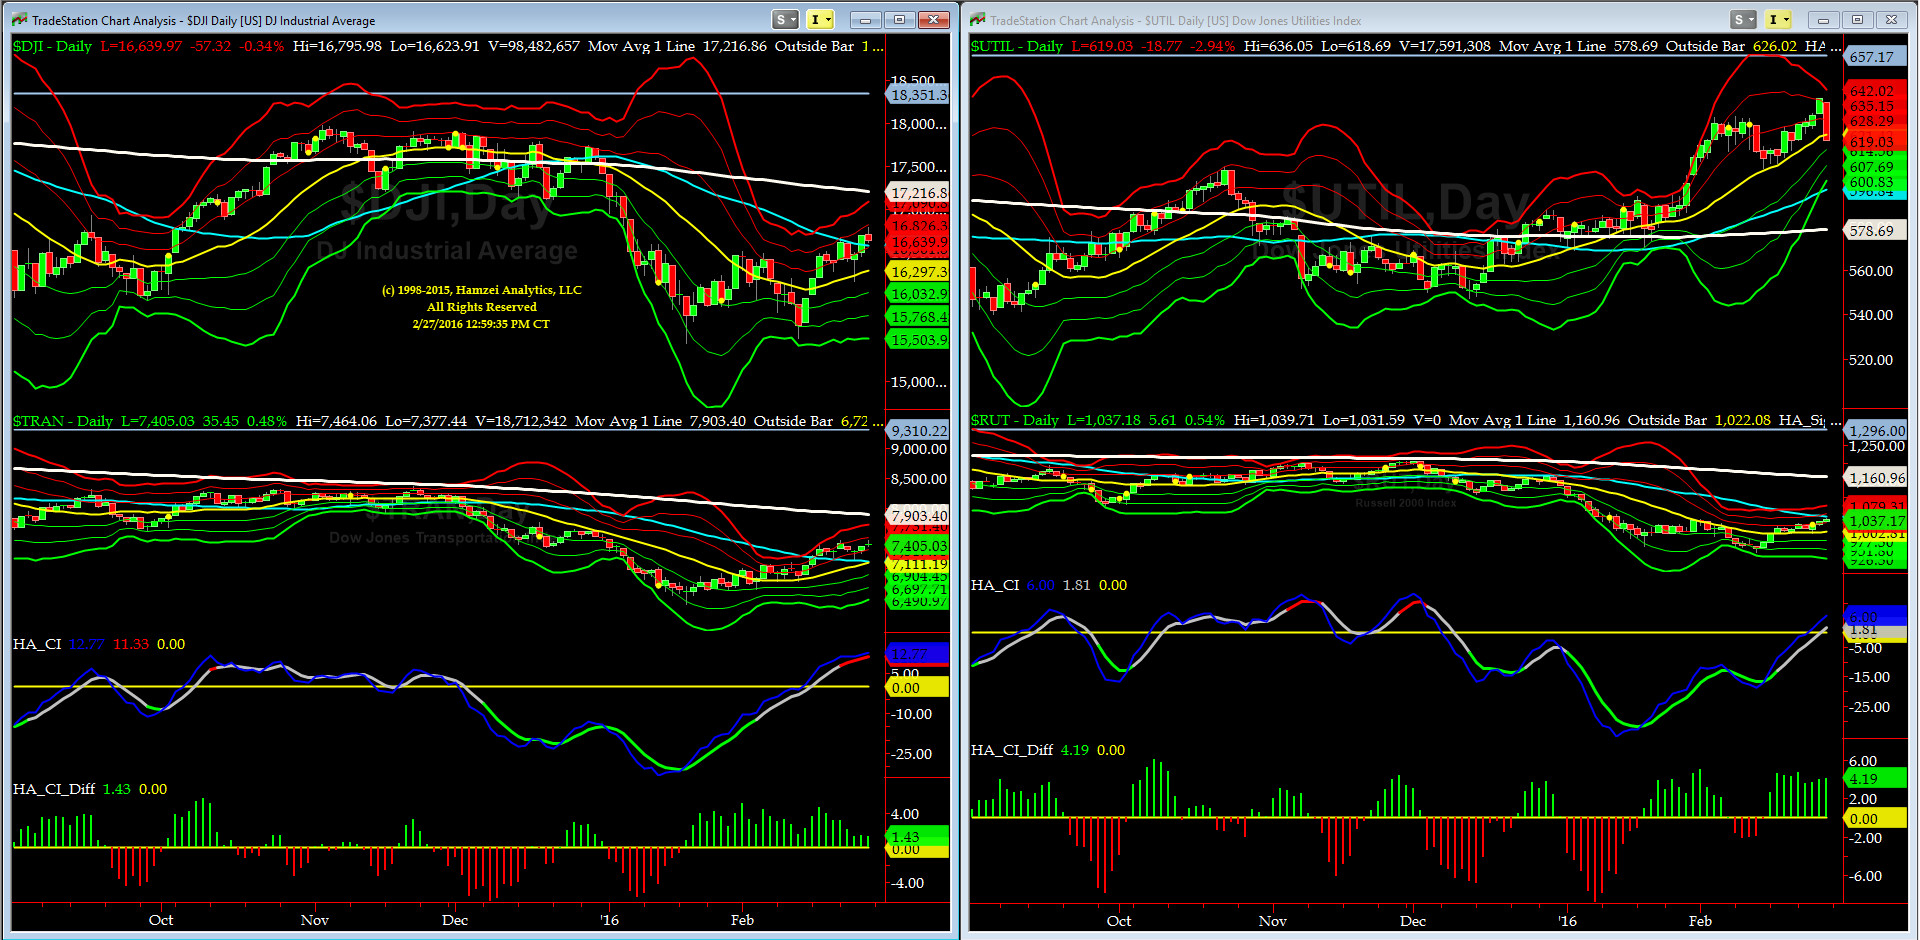
Canaries [in the Coal Mine] Chart for DJ TRAN & RUT Indices
200-Day MA DJ TRAN = 7903 or -6.3% above DJ TRAN (max observed in last 5 yrs = 20.2%, min = -20.3%)
200-Day MA RUT = 1161 or -10.7% above RUT (max observed in last 5 yrs = 21.3%, min = -22.6%)
DJ Transports (proxy for economic conditions 6 to 9 months hence) spent most of the last 2 weeks in the +1 to +2 channel and we are very encouraged of it progress.
Must recall that Transports peaked in Nov '14 and then led the SPX down in 2015 and now they are leading SPX here.
Russell 2000 Small Caps (proxy for RISK ON/OFF) is about to cross its 50day MA. RISK is slowly creeping back in, ioho.
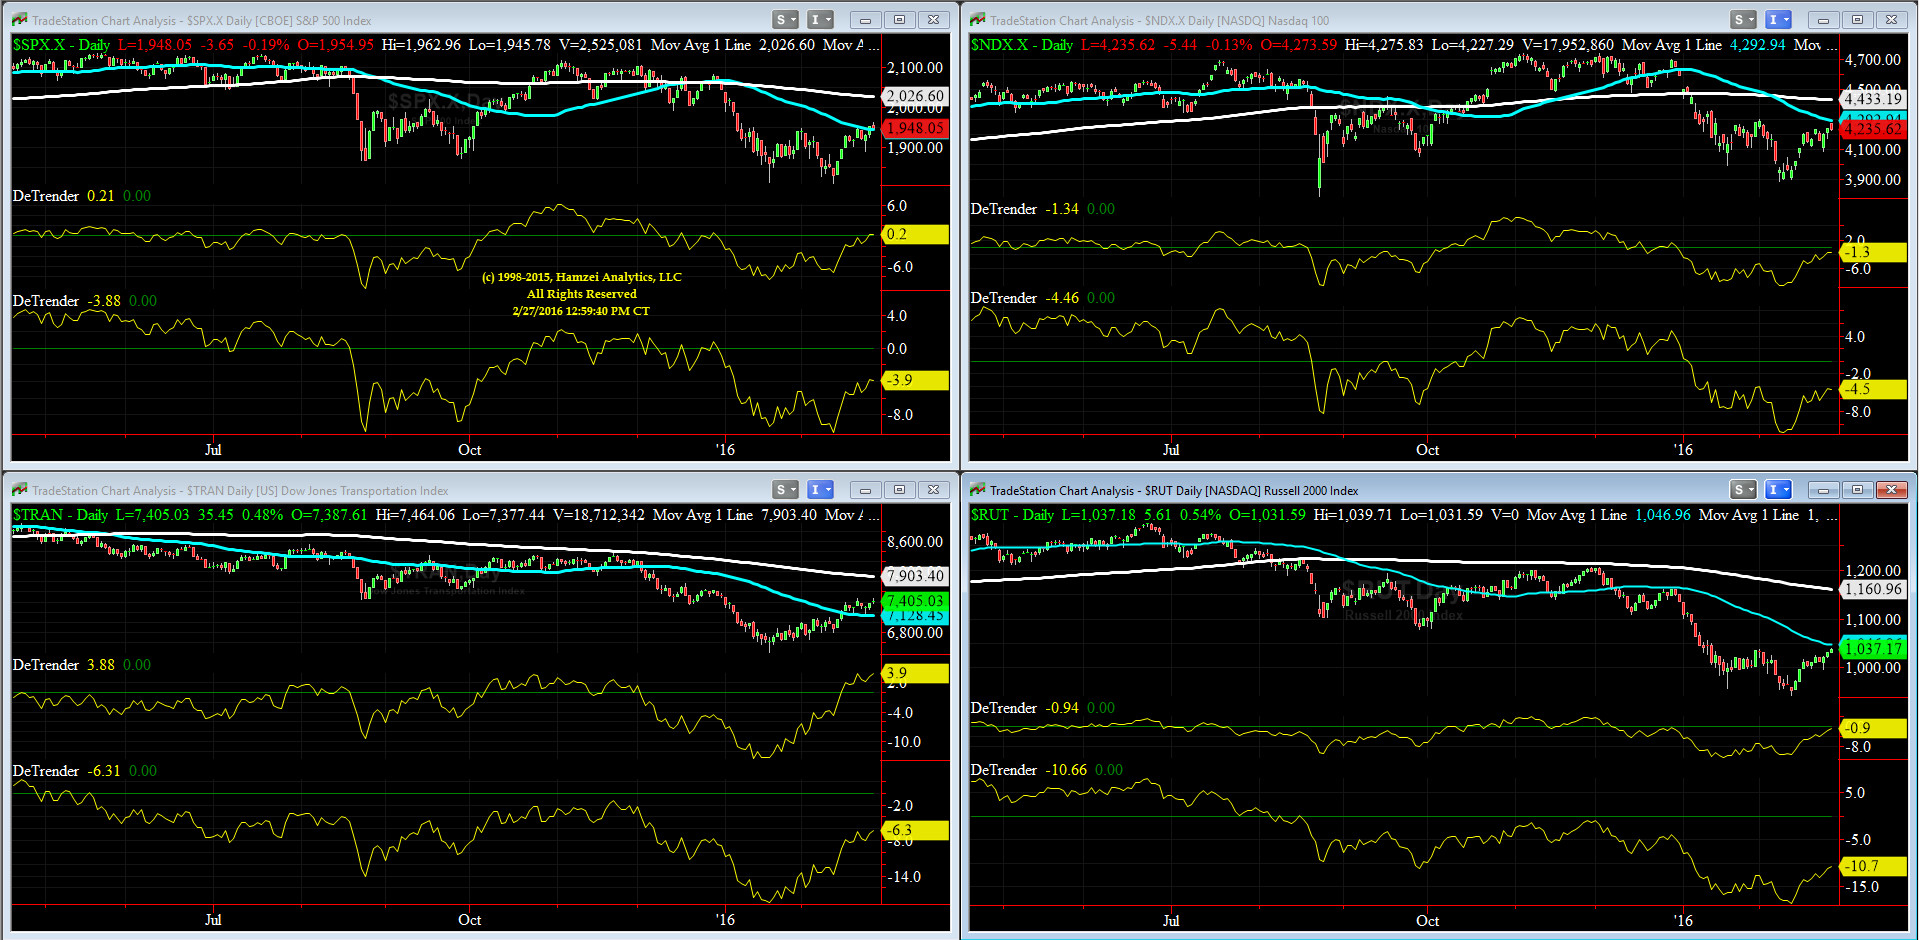
DeTrenders Charts for SPX, NDX, TRAN & RUT Indices
50-Day MA SPX =1948 or +0.2% below SPX (max observed in last 5 yrs = +8.6%, min = -9.3% )
200-Day MA SPX = 2026 or -3.9% above SPX (max observed in last 5 yrs = 15.2%, min = -14%)
Six of our Eight DeTrenders are negative but all have improved since Jan lows.
HA_SP1_momo Chart
WEEKLY Timing Model = on a SELL Signal since Friday 1/29/16 CLOSE
DAILY Timing Model = on a BUY Signal since Thursday 2/18/16 CLOSE
Max SPX 52wk-highs reading last week = 32 (over 120-140, the local maxima is in)
Max SPX 52wk-Lows reading last week = 4 (over 40-60, the local minima is in)
HA_SP1 = almost at its +1.5 Sigma
HA_Momo = +7.11 (reversals most likely occur above +10 or below -10)
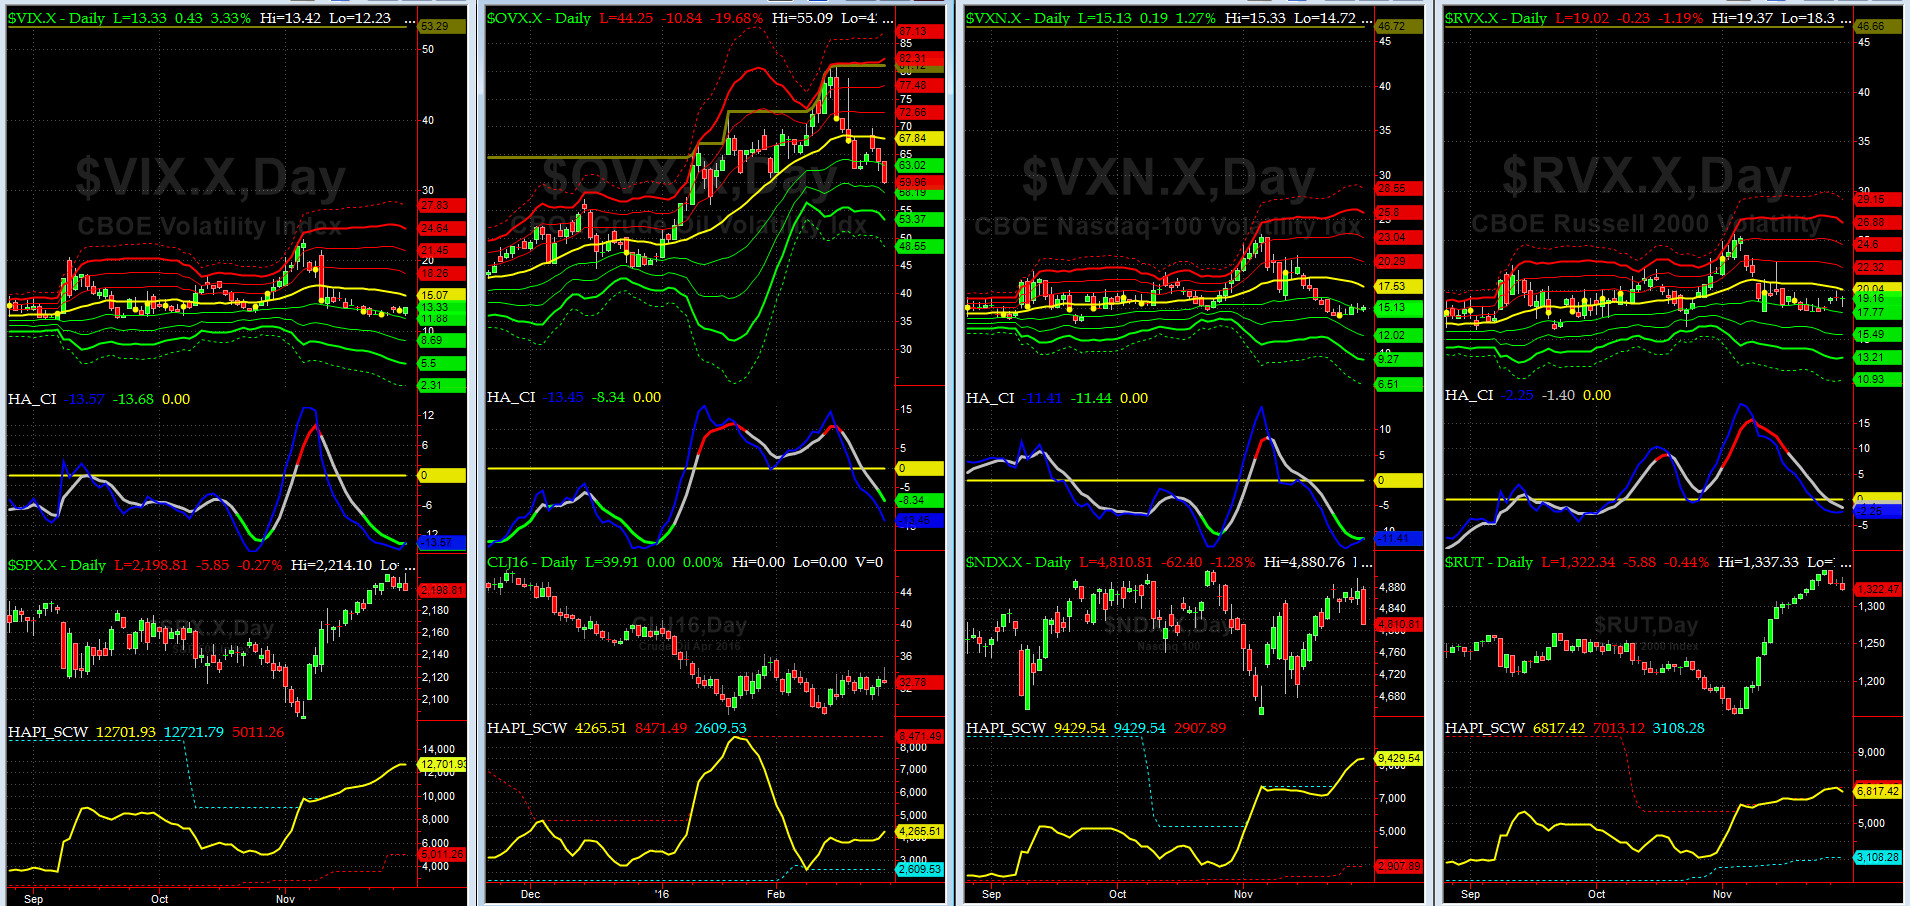
Vol of the Vols Chart
VIX = 19.9 which is at its -1 sigma (remember it�s the VIX�s vol pattern (its sigma channels) that matters, and not the level of VIX itself (this is per Dr. Robert Whaley, a great mentor and the inventor of original VIX, now called VXO. VIX usually peaks around a test of its +4 sigma).
As stated here in the last 4 weeks, this shockwave is over till the next shoe drops.
Worth noting is OVX pattern (vol for crude oil). It's getting crushed fast from very high levels.
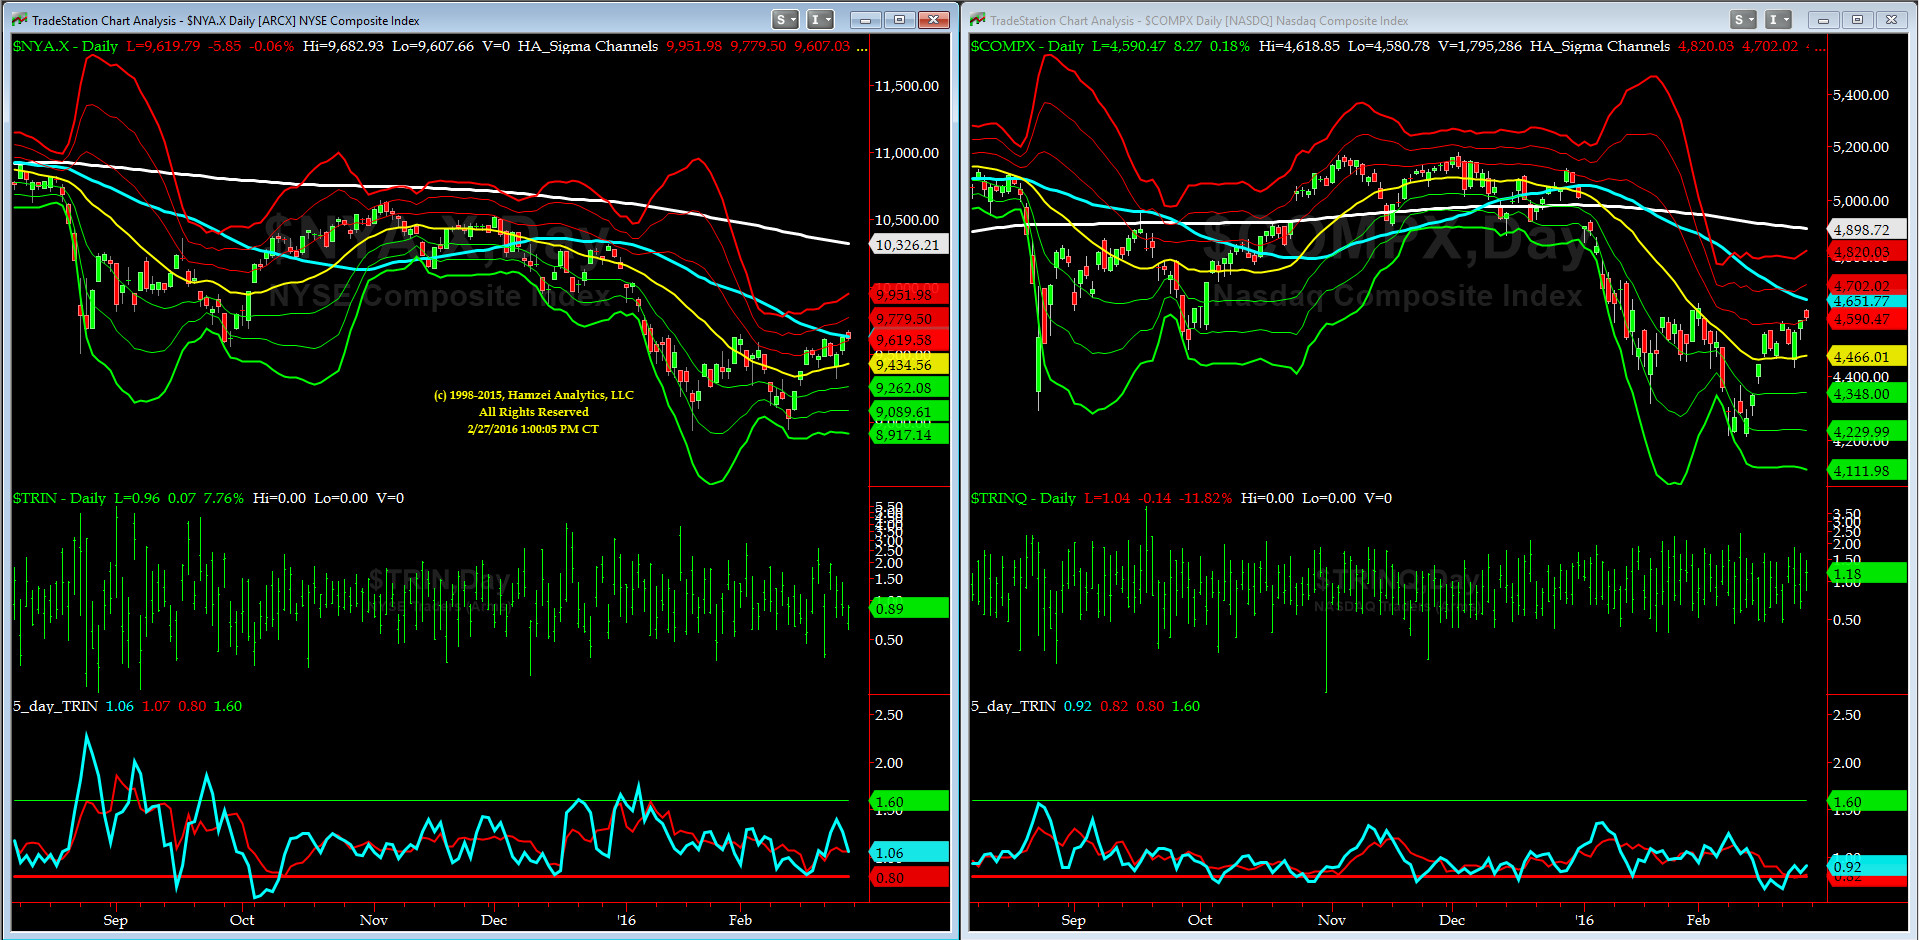
5-day TRIN & TRINQ Charts
The 5-day TRIN (for NYSE) is now NEUTRAL but 5-day TRINQ (for NASDAQ) is still near a SELL signal here.
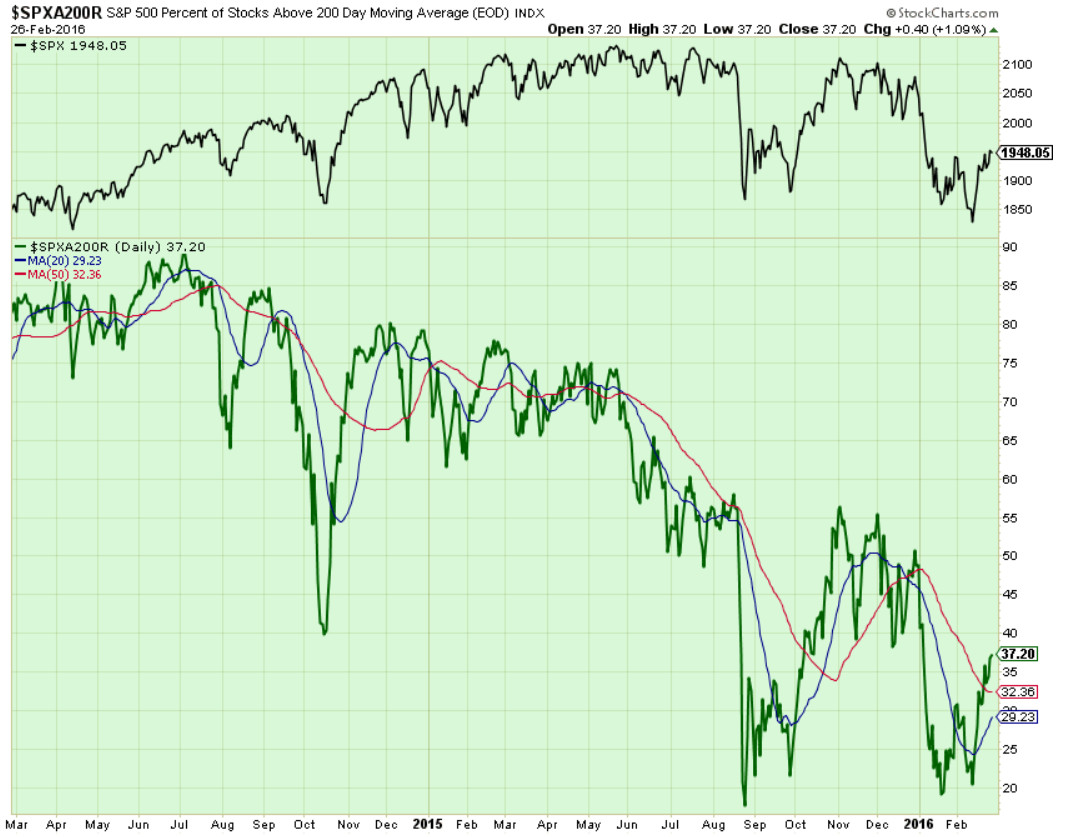
Components of SPX above their respective 200day MA Chart
We closed the week over 37% for this scoring indicator, having plowed thru its 50-day MA(red line).
Notice it is no longer in Divergence with SPX. Next key level is 45%.
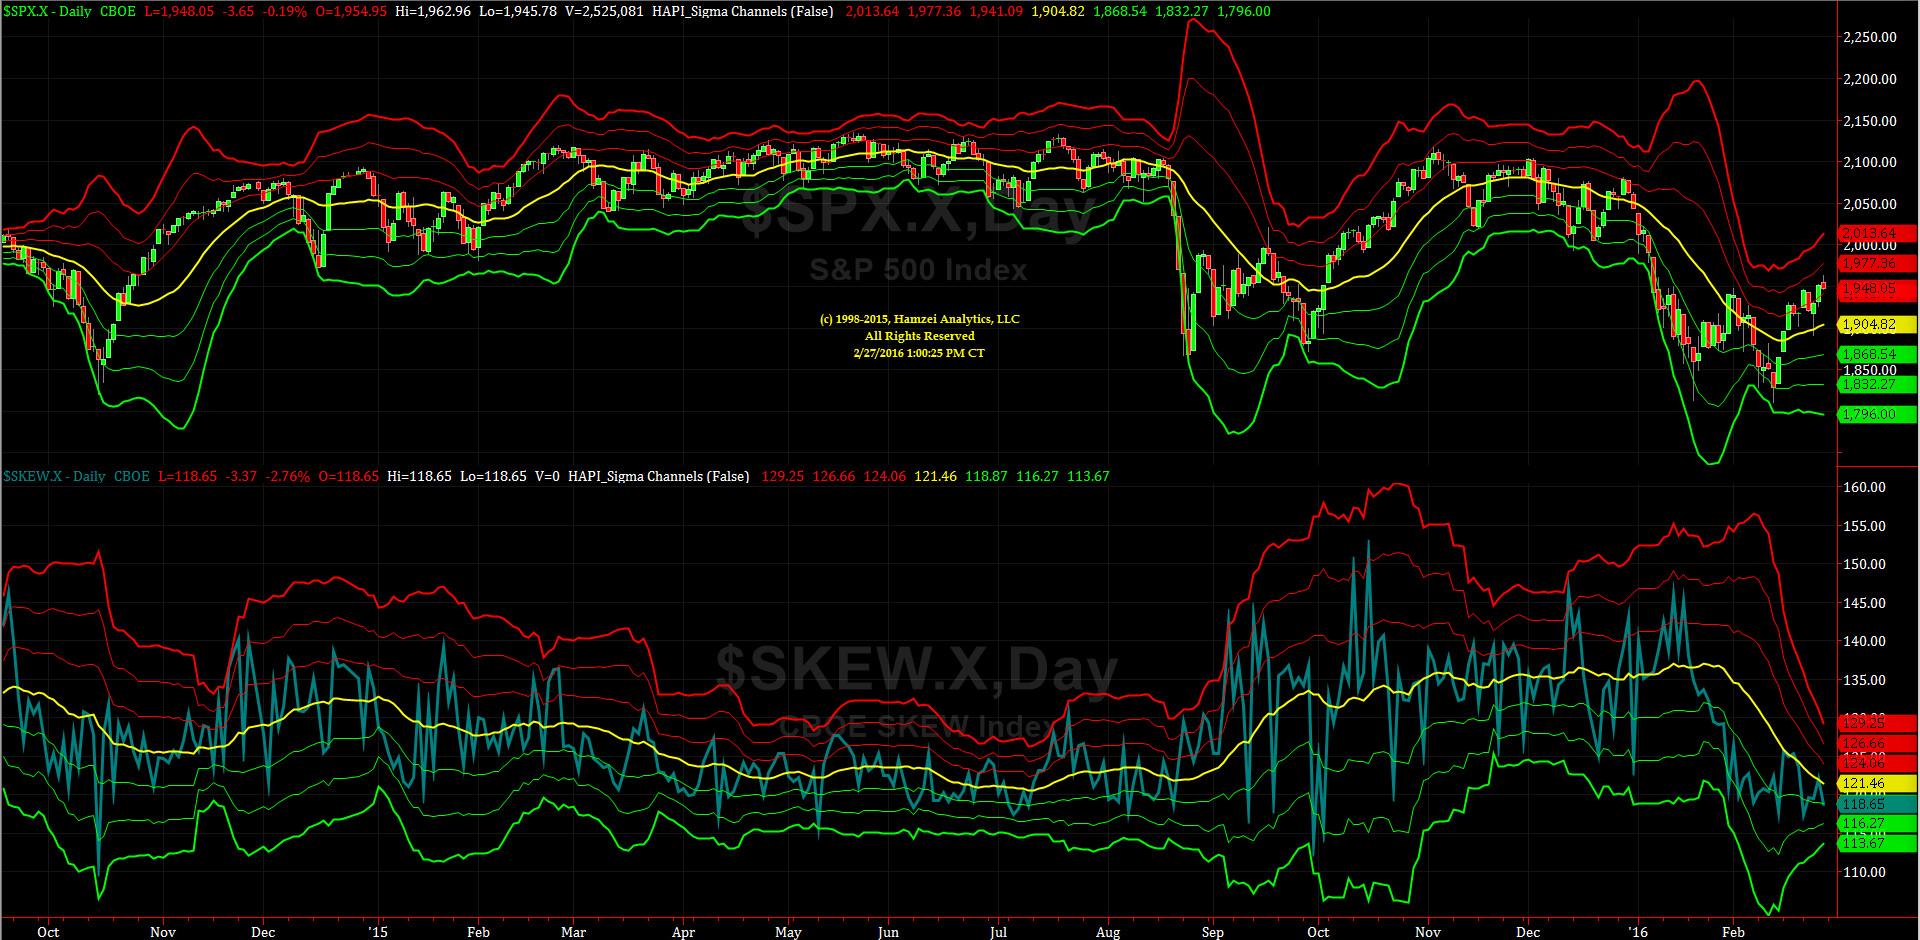
SPX SKEW (Tail Risk) Chart
SPX SKEW (Tail Risk) = 118 and about its -1 sigma (normal = 120-125, range 100-150)
All Quiet on the Mid-Western Front? And, is Smart Money giving the all clear signal for a rise to 200-day MA (2025)? who knows, but we think so. So does @Capt_Tiko.
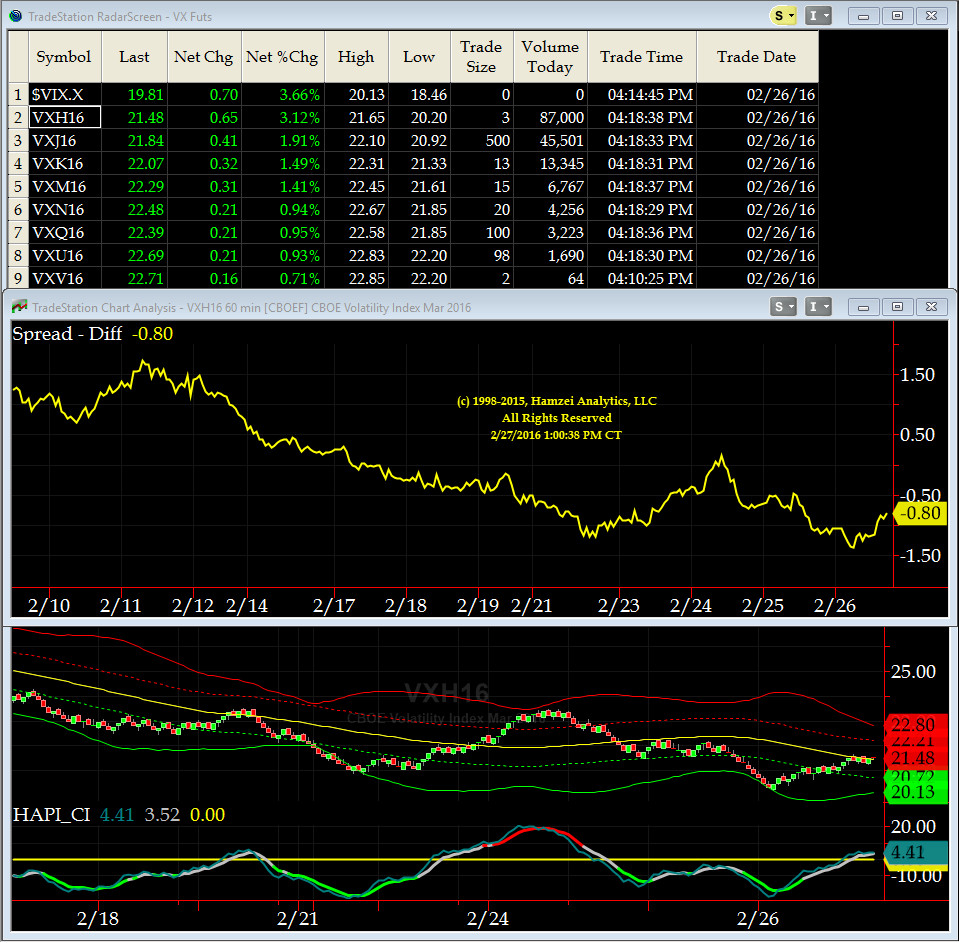
3-month VIX Futures Spread(VX) Chart
Our 3-month VIX Futures Spread (LONG MAR16 SHORT JUN16), closed Friday at -0.80. This confirms the low is behind us for now.
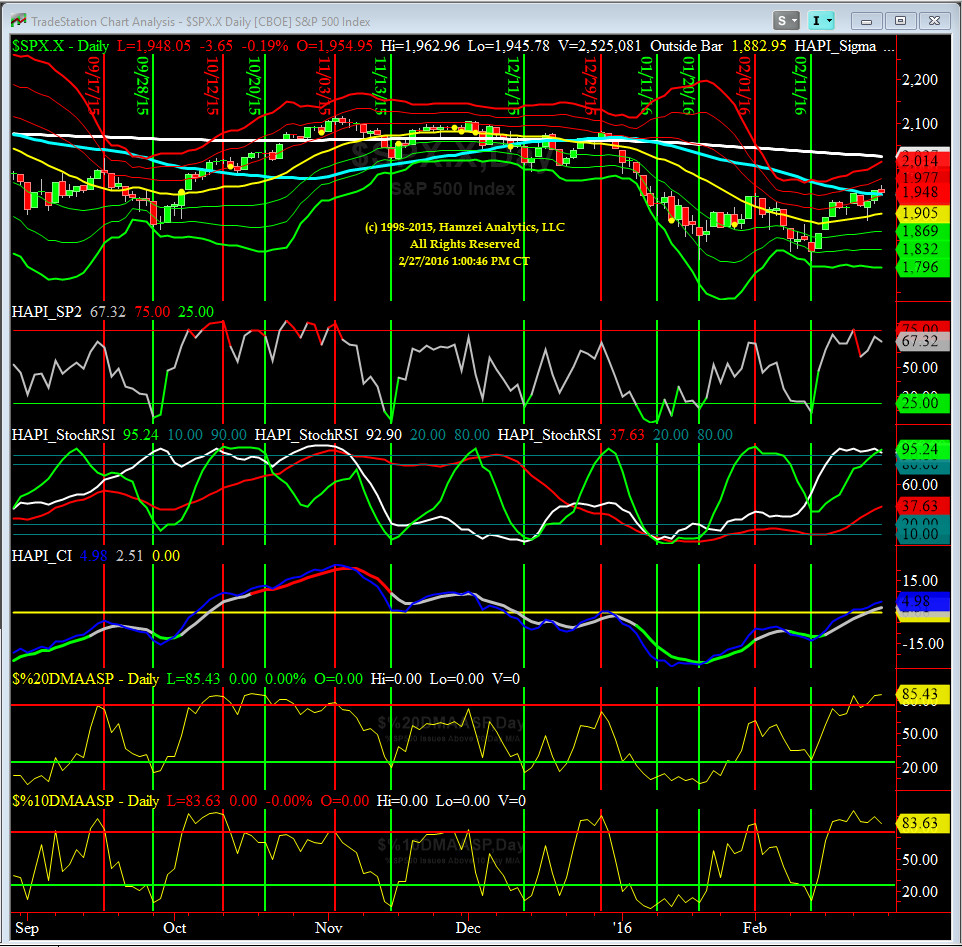
HA_SP2 Chart
HA_SP2 = 67.3(Buy signal <= 25, Sell Signal >= 75)
At ~67, this prop indicator is still near overbought.
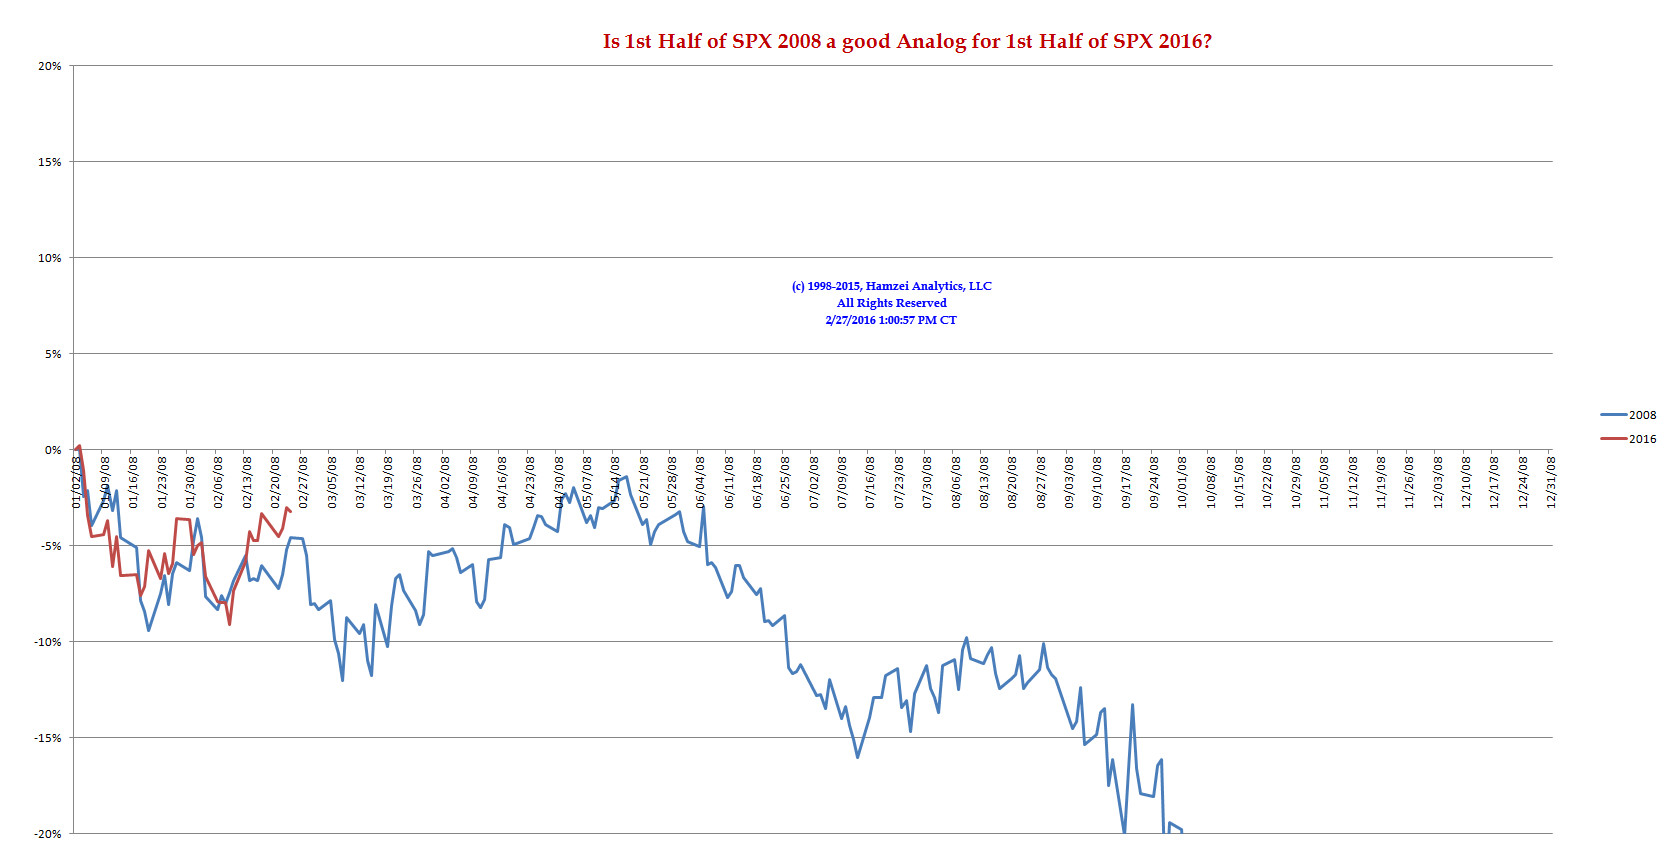
SPX 2008 Analog for SPX 2016
SPX 2016 is still tracking the SPX 2008 price action so far. Looks like interesting action coming up as we get closer to Spring Equinox (Norouz = Persian New Year) on March 19.
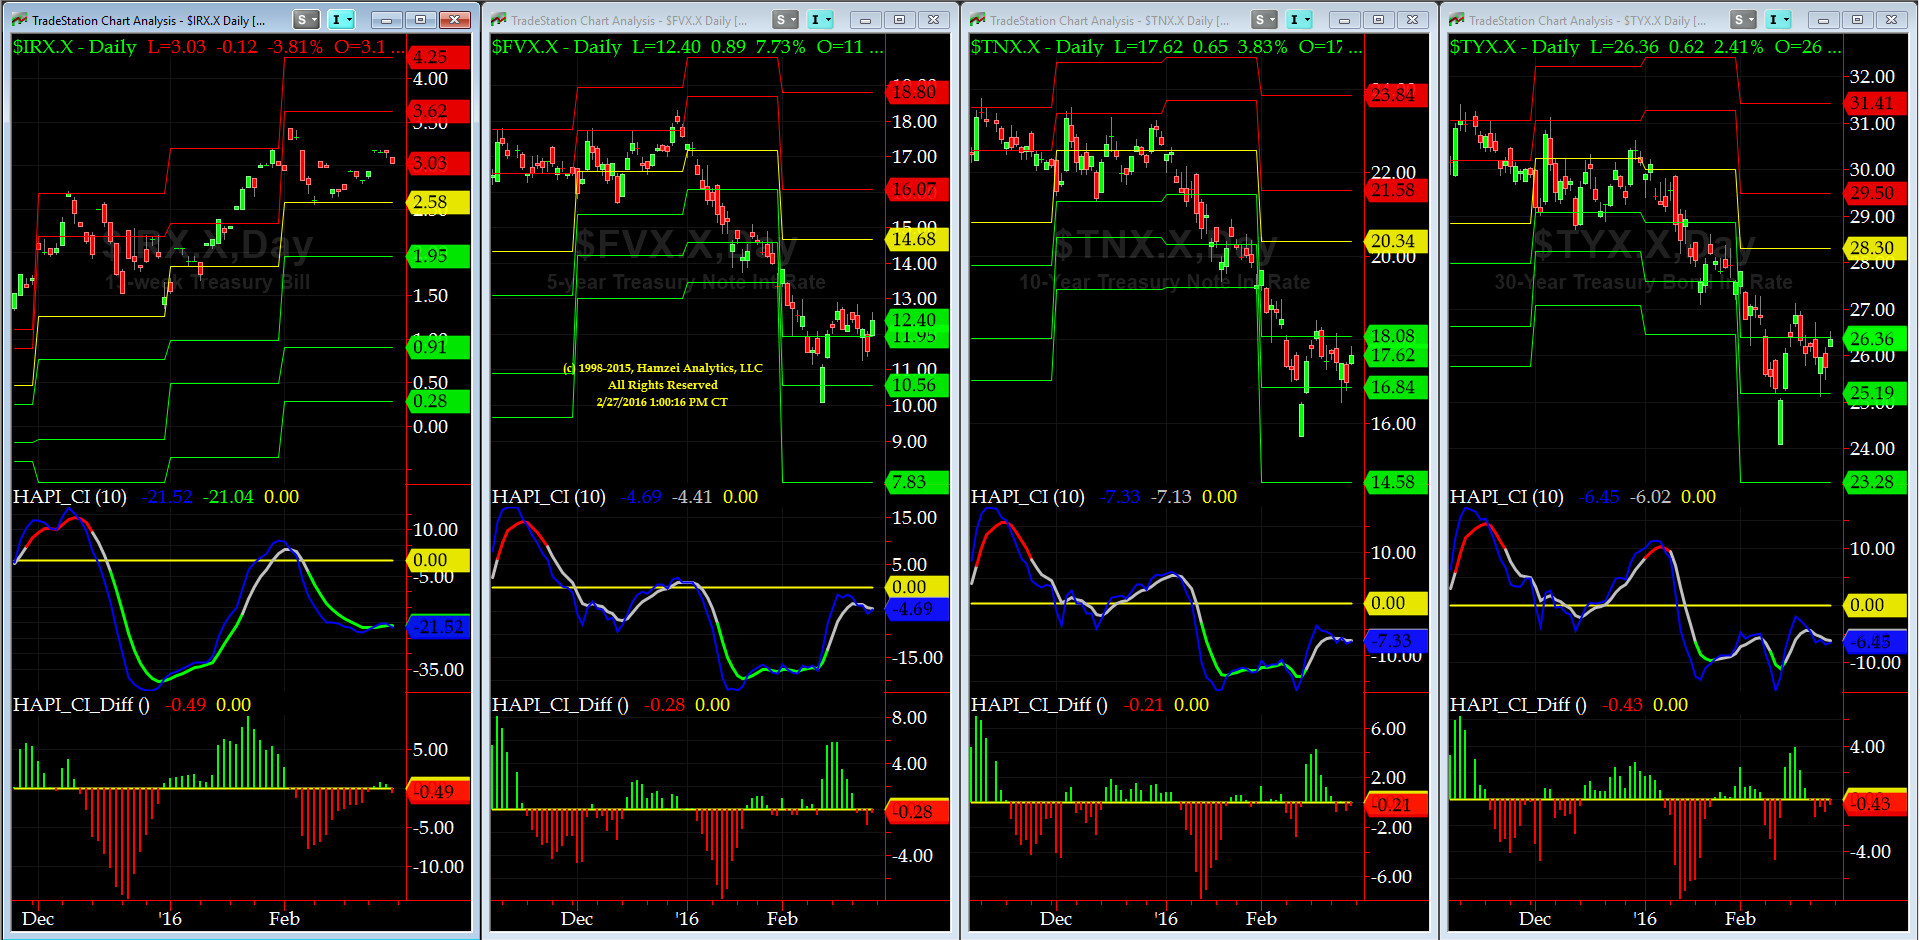
US Treasury T-Notes & T-Bonds Yields Chart
Treasury Complex Yields rose up a tad this past week. No signal here.
Fari Hamzei
|


 Proactive Market Timing