|
Saturday, March 5, 2016 1145ET
Market Timing Charts, Analysis & Commentary for Issue #134
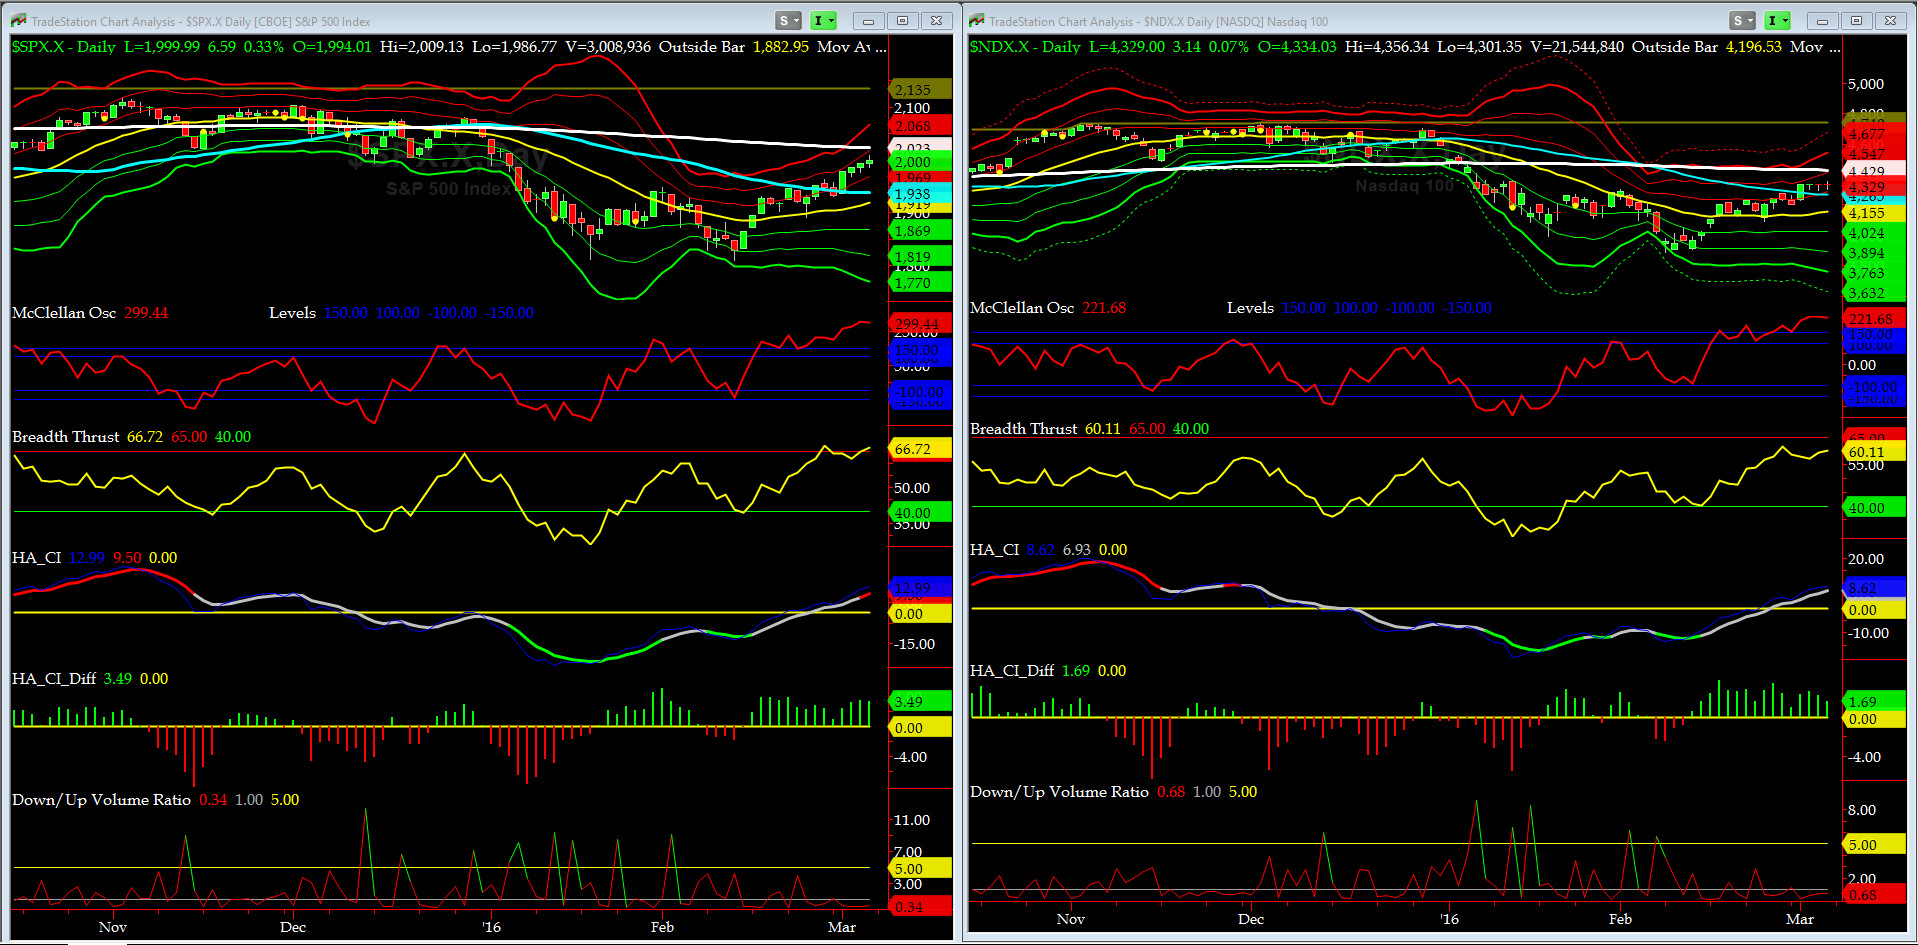
Timer Charts of S&P-500 Cash Index (SPX) + NASDAQ-100 Cash Index (NDX)
Most recent S&P-500 Cash Index (SPX): 1999.99 up +52.94 (up +2.72%) for the week ending on Friday, March 4th, 2016, which closed about its +1.5 sigma.
SPX ALL TIME INTRADAY HIGH = 2134.72 (reached on Wednesday, May 20th, 2015)
SPX ALL TIME CLOSING HIGH = 2130.82 (reached on Thursday, May 21st, 2015)
Current DAILY +2 Sigma SPX = 2018 with WEEKLY +2 Sigma = 2156
Current DAILY 0 Sigma (20 day MA) SPX = 1919 with WEEKLY 0 Sigma = 1996
Current DAILY -2 Sigma SPX = 1819 with WEEKLY -2 Sigma = 1837
NYSE McClellan Oscillator = +299 (-150 is start of the O/S area; around -275 to -300 area or lower, we go into the �launch-pad� mode, over +150, we are in O/B area)
NYSE Breadth Thrust = 66.72 (40 is considered as oversold and 65 as overbought)
SPX is fairly close to its 200day MA (now at 2023).... NDX has had [relatively] three Flat Closes.

Canaries [in the Coal Mine] Chart for DJ TRAN & RUT Indices
200-Day MA DJ TRAN = 7875 or -2.8% above DJ TRAN (max observed in last 5 yrs = 20.2%, min = -20.3%)
200-Day MA RUT = 1156 or -6.4% above RUT (max observed in last 5 yrs = 21.3%, min = -22.6%)
DJ Transports (proxy for economic conditions 6 to 9 months hence) spent most of the last 3 weeks in the +1 to +2 sigma channels. We view this as very positive for longer term econ picture.
Must recall that Transports peaked in Nov '14 and then led the SPX down in 2015 and now they are leading SPX here.
Russell 2000 Small Caps (proxy for RISK ON/OFF) is now above its 50day MA & RISK is slowly back ON.
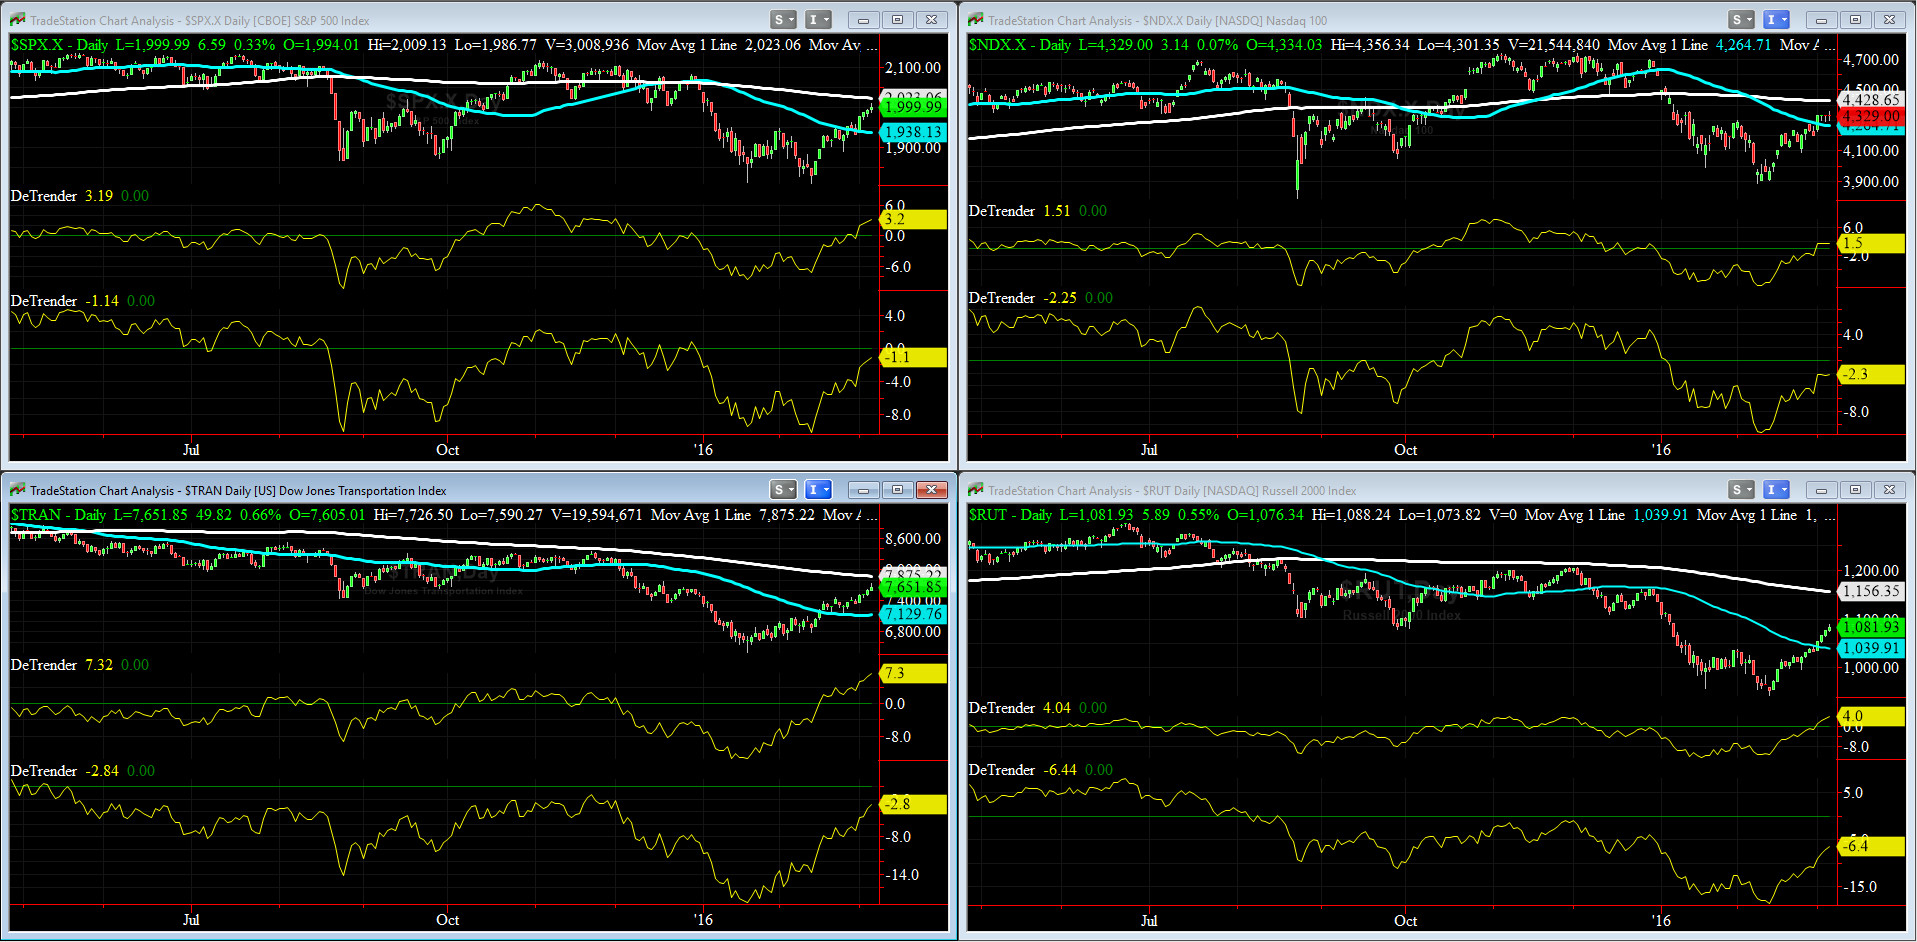
DeTrenders Charts for SPX, NDX, TRAN & RUT Indices
50-Day MA SPX =1938 or +3.2% below SPX (max observed in last 5 yrs = +8.6%, min = -9.3% )
200-Day MA SPX = 2023 or -1.1% above SPX (max observed in last 5 yrs = 15.2%, min = -14%)
FOUR of our Eight DeTrenders are negative but all have improved since Jan lows.

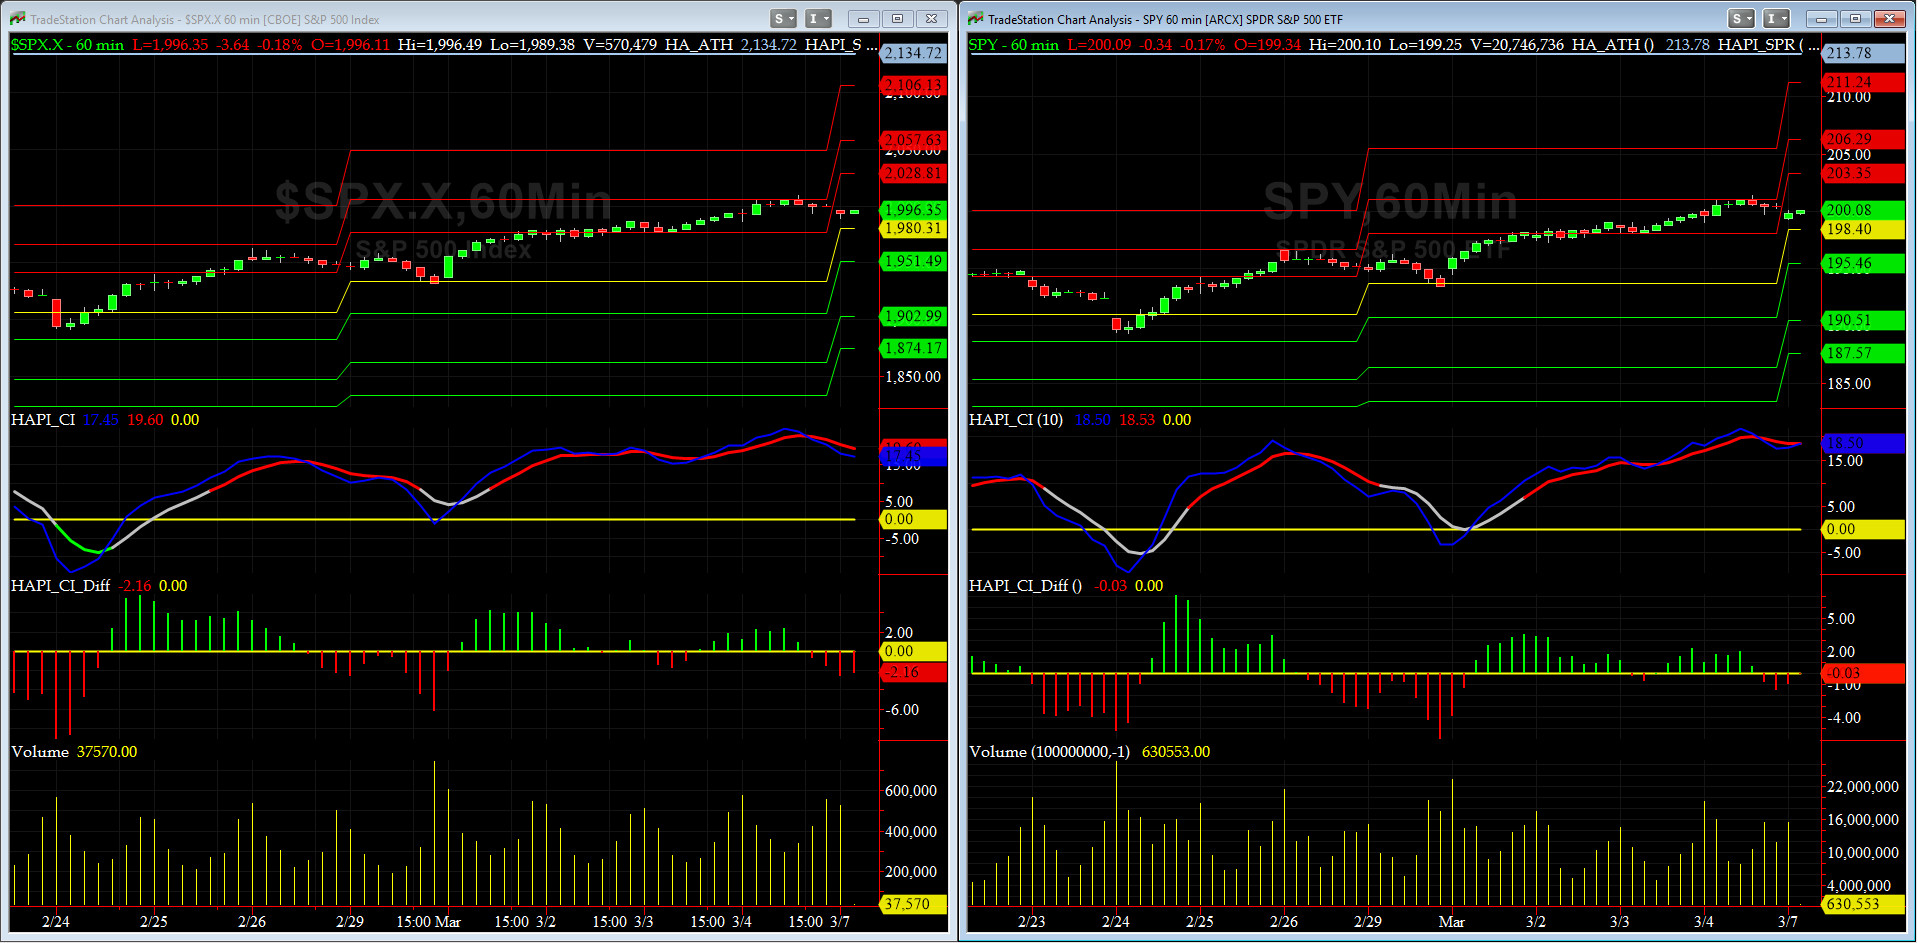
HA_SP1_momo Chart
WEEKLY Timing Model = on a SELL Signal since Friday 1/29/16 CLOSE
DAILY Timing Model = on a BUY Signal since Thursday 2/18/16 CLOSE
Max SPX 52wk-highs reading last week = 17 (over 120-140, the local maxima is in)
Max SPX 52wk-Lows reading last week = 2 (over 40-60, the local minima is in)
HA_SP1 = is still rising near its +1.5 Sigma
HA_Momo = +7.73 (reversals most likely occur above +10 or below -10)
NOTE: it is worth paying attention to the divergences developing between our HA_momo and HA_SP1.
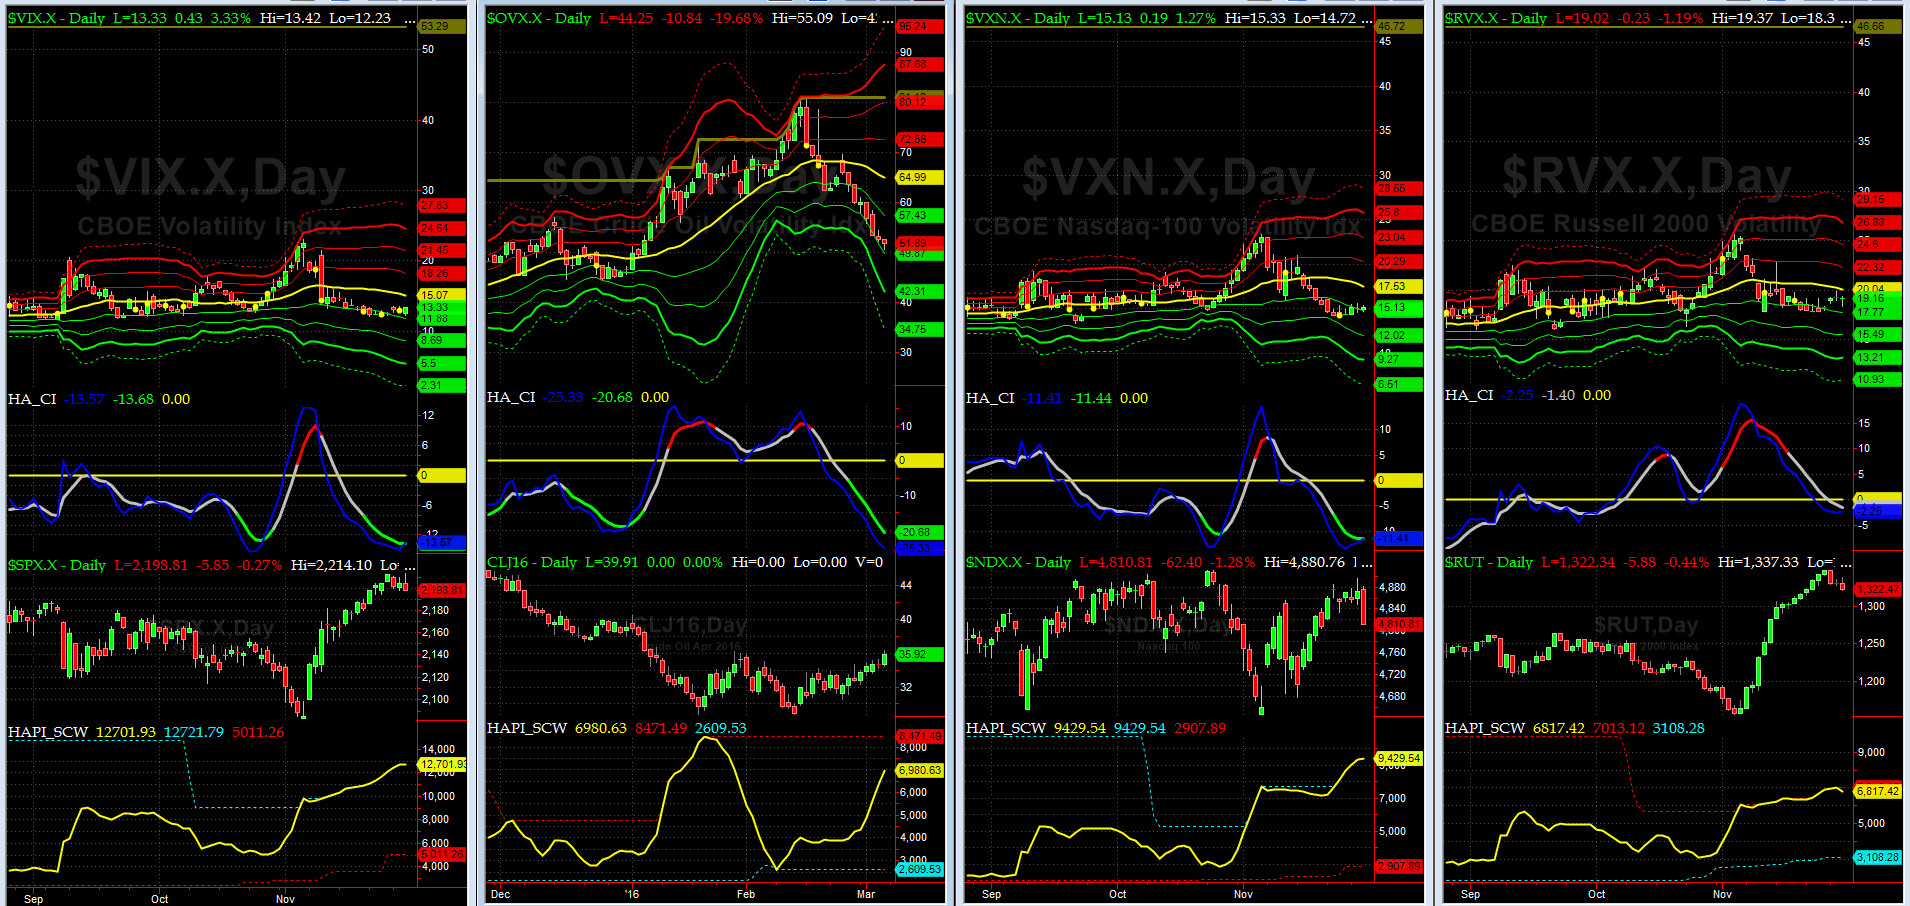
Vol of the Vols Chart
VIX = 16.9 which is at its -1.5 sigma (remember it�s the VIX�s vol pattern (its sigma channels) that matters, and not the level of VIX itself (this is per Dr. Robert Whaley, a great mentor and the inventor of original VIX, now called VXO. VIX usually peaks around a test of its +4 sigma).
As stated here in the last 5 weeks, this shockwave is over till the next shoe drops.
Worth noting is that OVX (vol for crude oil) is very near its 2016 lows.
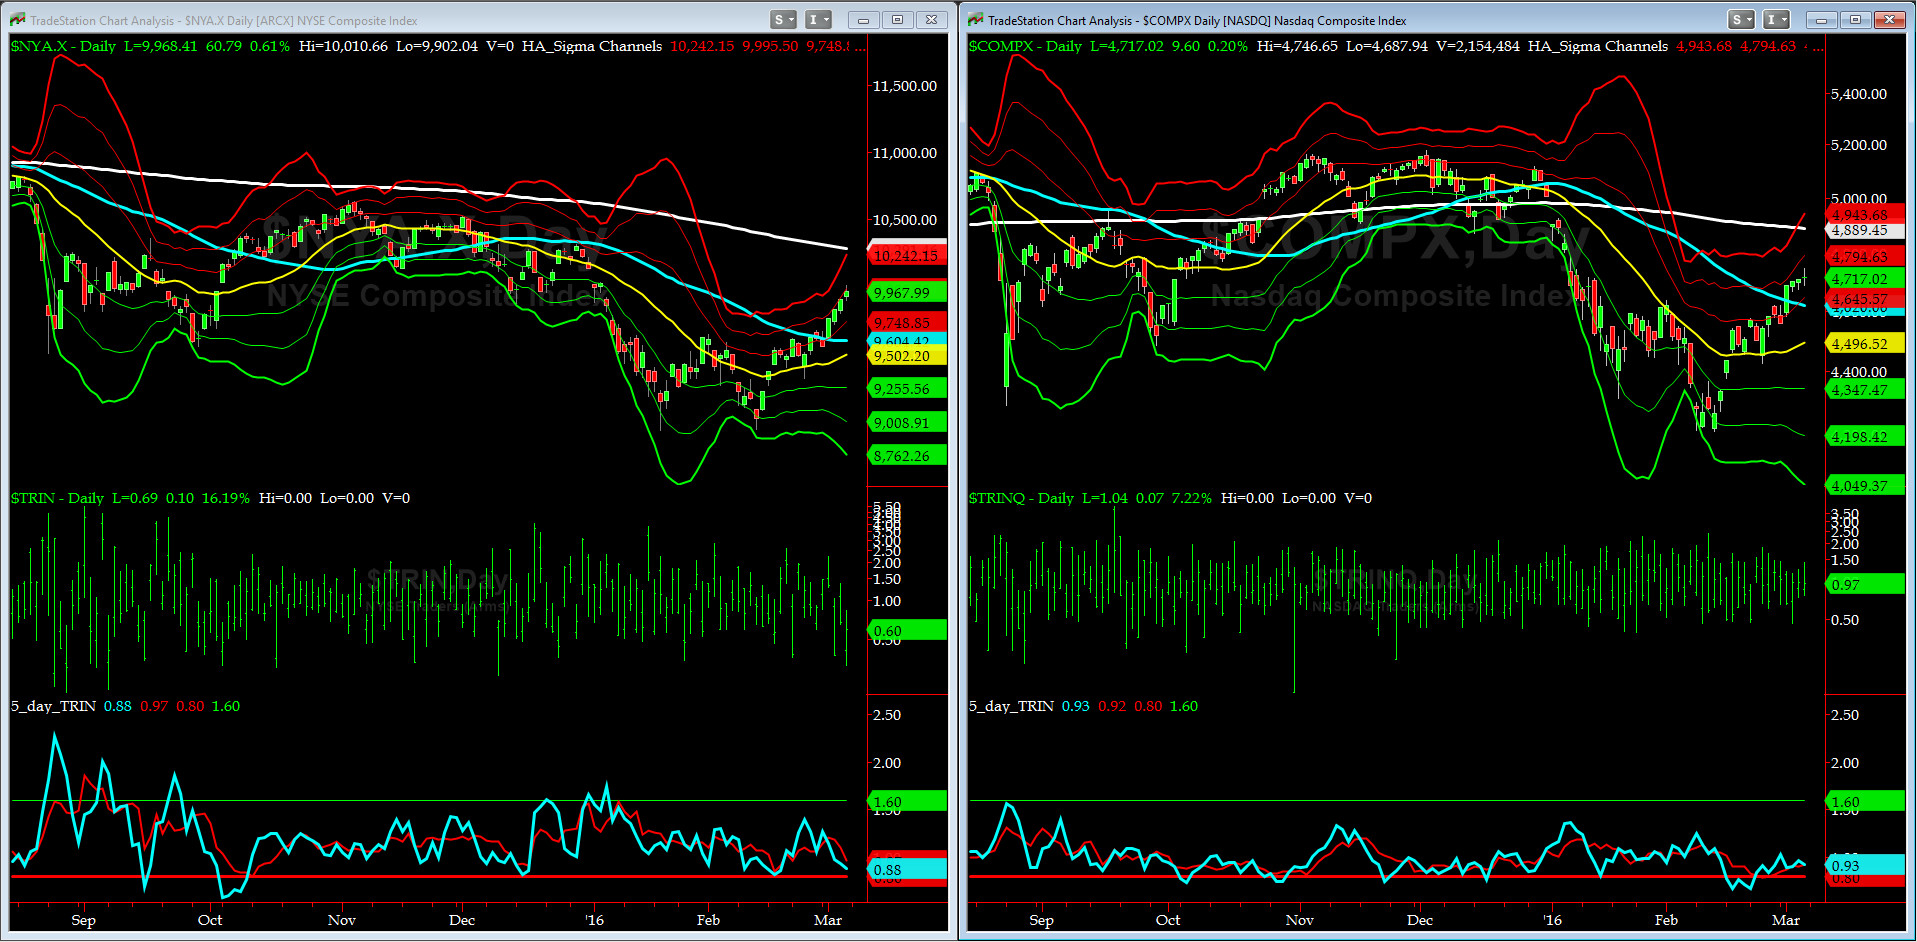
5-day TRIN & TRINQ Charts
The 5-day TRIN (for NYSE) and 5-day TRINQ (for NASDAQ) are now rushing into SELL signal territory (below 0.8).
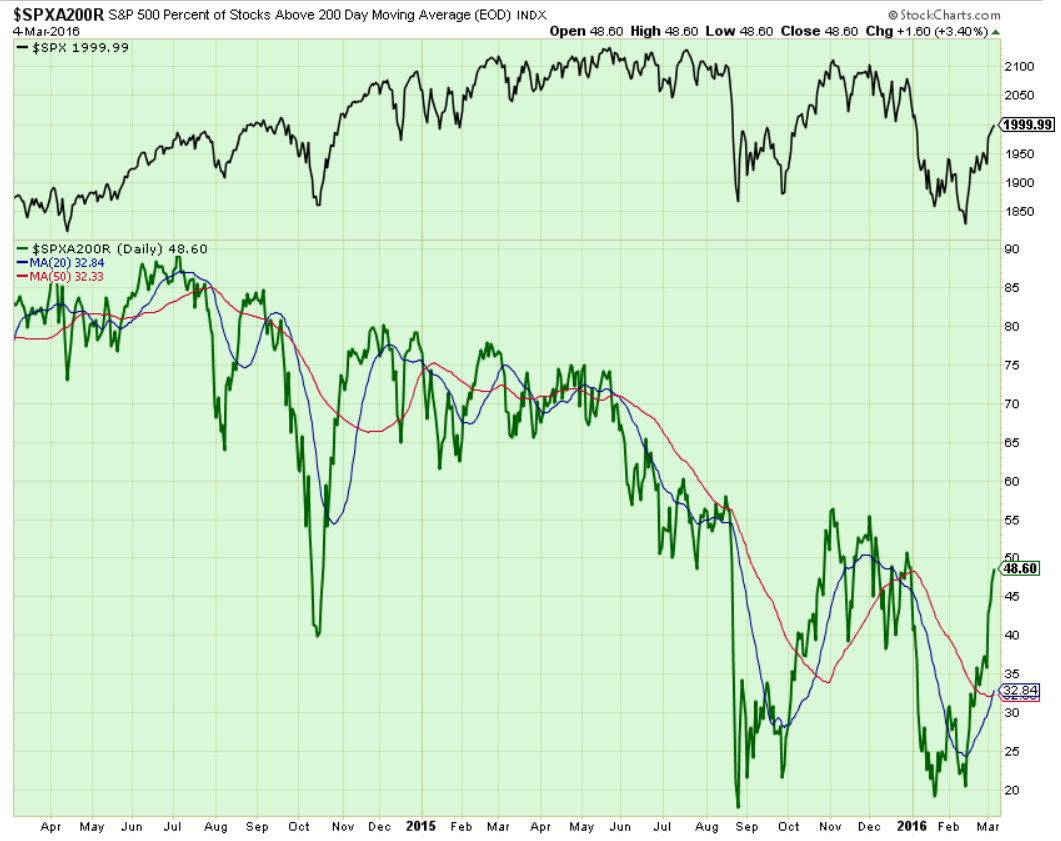
Components of SPX above their respective 200day MA Chart
We closed the week over 48% for this scoring indicator, having plowed thru our 45% target stated here last weekend.
Next key level is 57%.
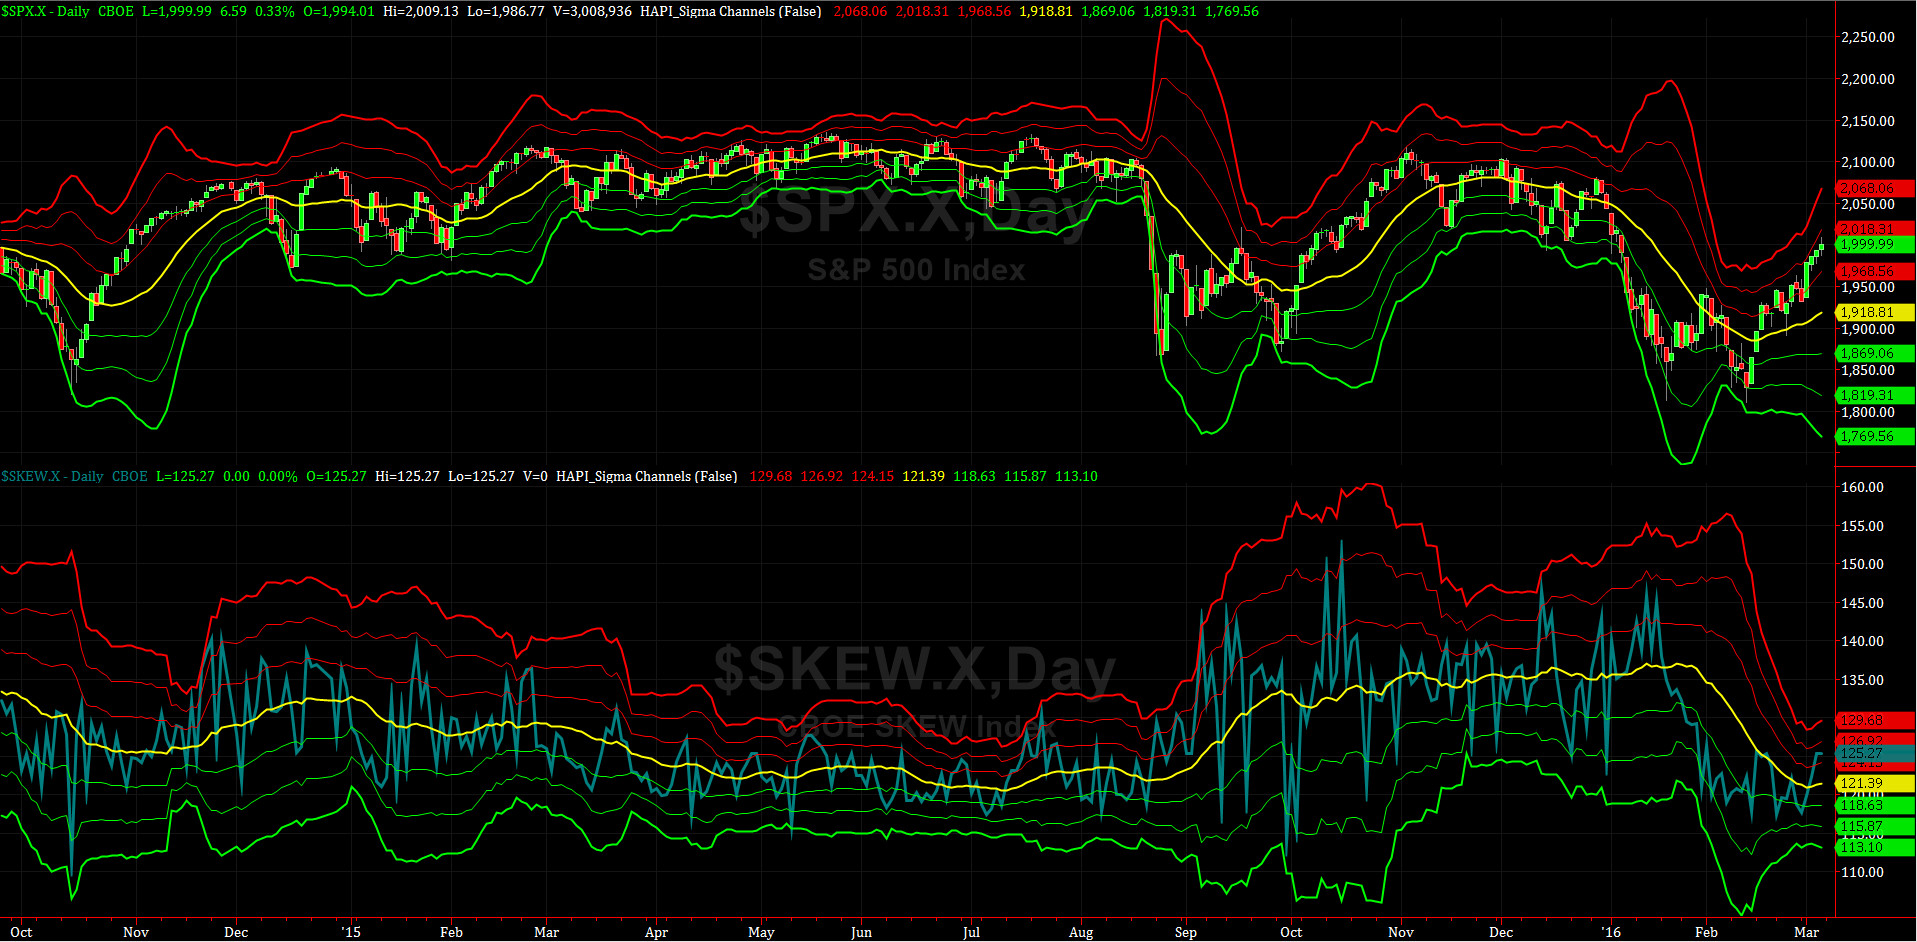
SPX SKEW (Tail Risk) Chart
SPX SKEW (Tail Risk) = 125 and about its +1 sigma (normal = 120-125, range 100-150)
All Quiet on the Mid-Western Front? Yes & No. Smart Money is giving the all clear signal for a rise to 200-day MA but a shallow pull-back should be in order. And, my co-pilot, @Capt_Tiko, while NOT taking another nap on the job, agrees. LOL.
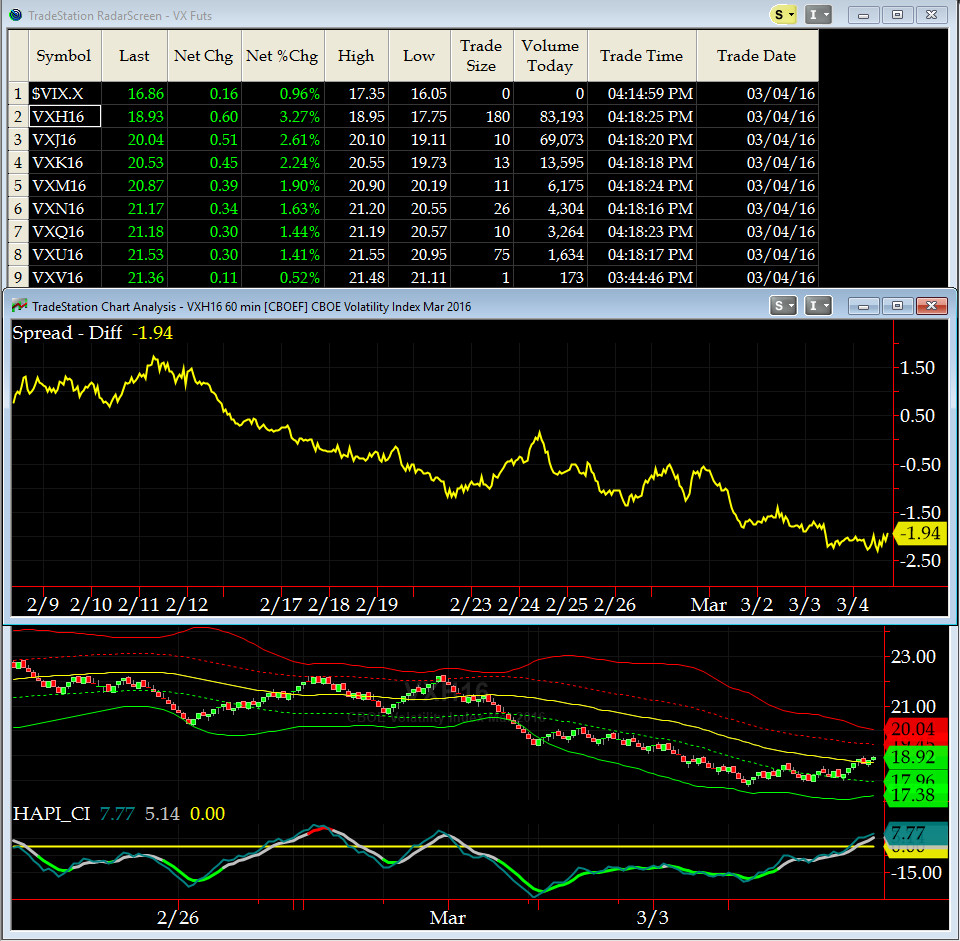
3-month VIX Futures Spread(VX) Chart
Our 3-month VIX Futures Spread (LONG MAR16 SHORT JUN16), closed Friday at -1.94. This confirms SPX is heading up for now (till we get to about -3 reading), but, NOT necessarily in a straight line.

HA_SP2 Chart
HA_SP2 = 79.68(Buy signal <= 25, Sell Signal >= 75)
At ~80, this prop indicator is VERY OverBought.
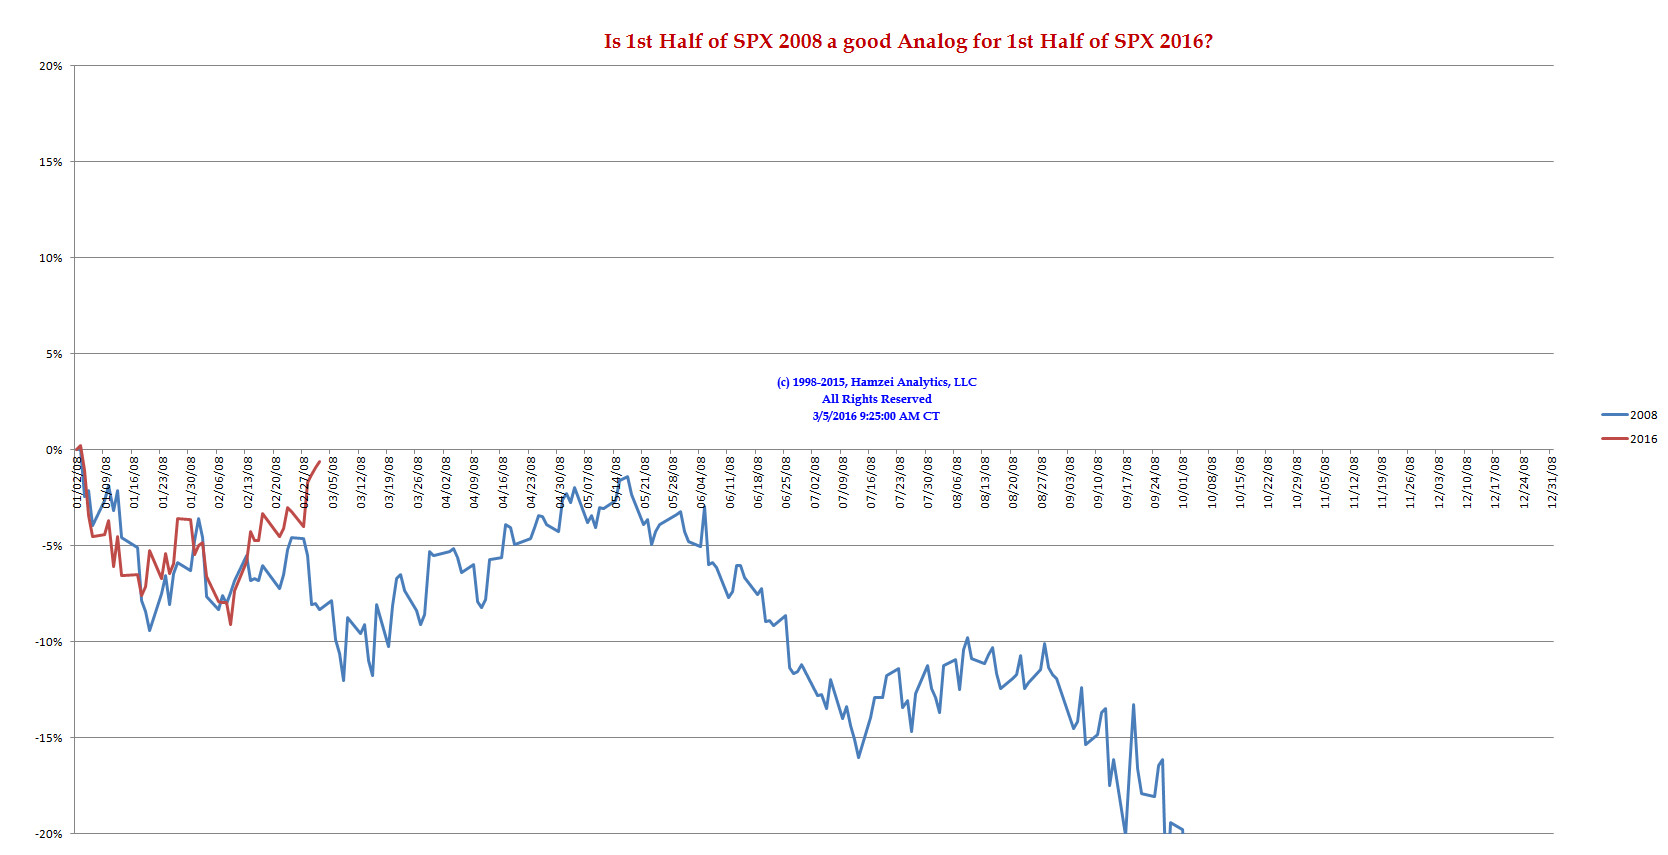
SPX 2008 Analog for SPX 2016
SPX 2016 is no longer tracking the SPX 2008 price action. We are still looking for a pullback as we get closer to Spring Equinox (which is Norouz = Persian New Year 1395) on March 20th.
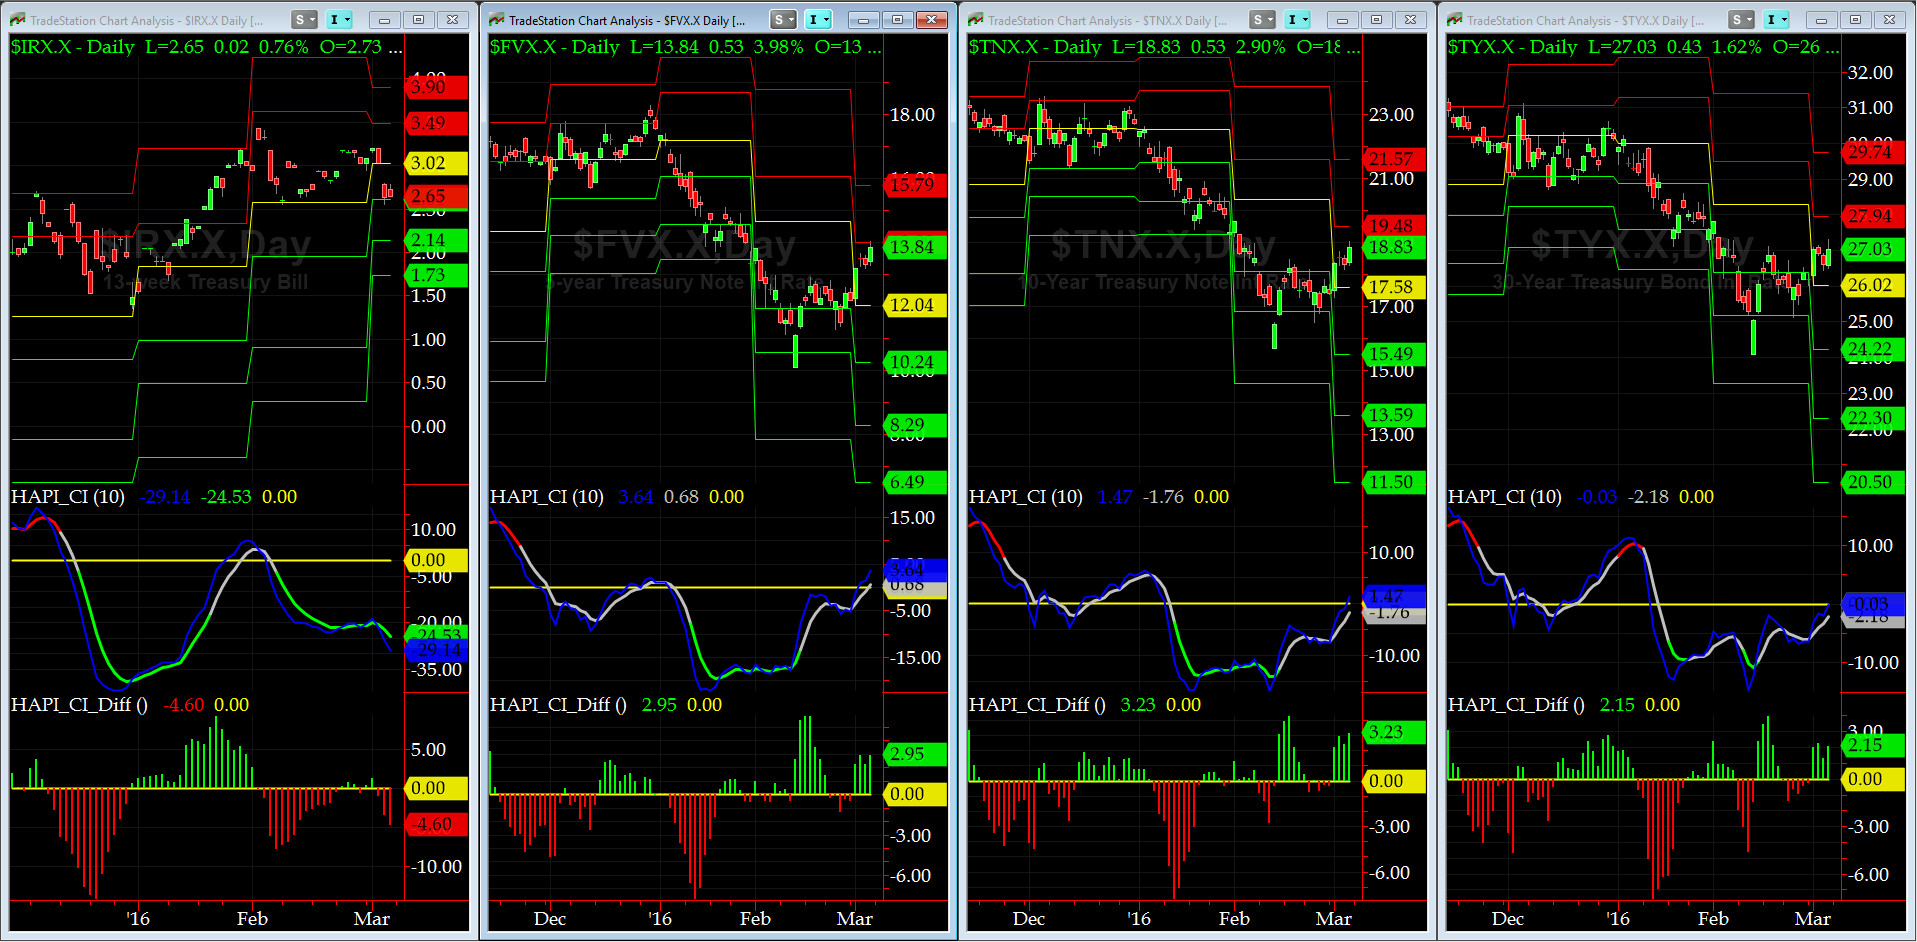
US Treasury T-Notes & T-Bonds Yields Chart
The long-end of the US Treasury Yield Curve steepend a tad this past week, while its front-end pulled back. No signal here.
Fari Hamzei
|


 Proactive Market Timing