|
Sunday, March 13, 2016 0930ET
Market Timing Charts, Analysis & Commentary for Issue #135
Timer Charts of S&P-500 Cash Index (SPX) + NASDAQ-100 Cash Index (NDX)
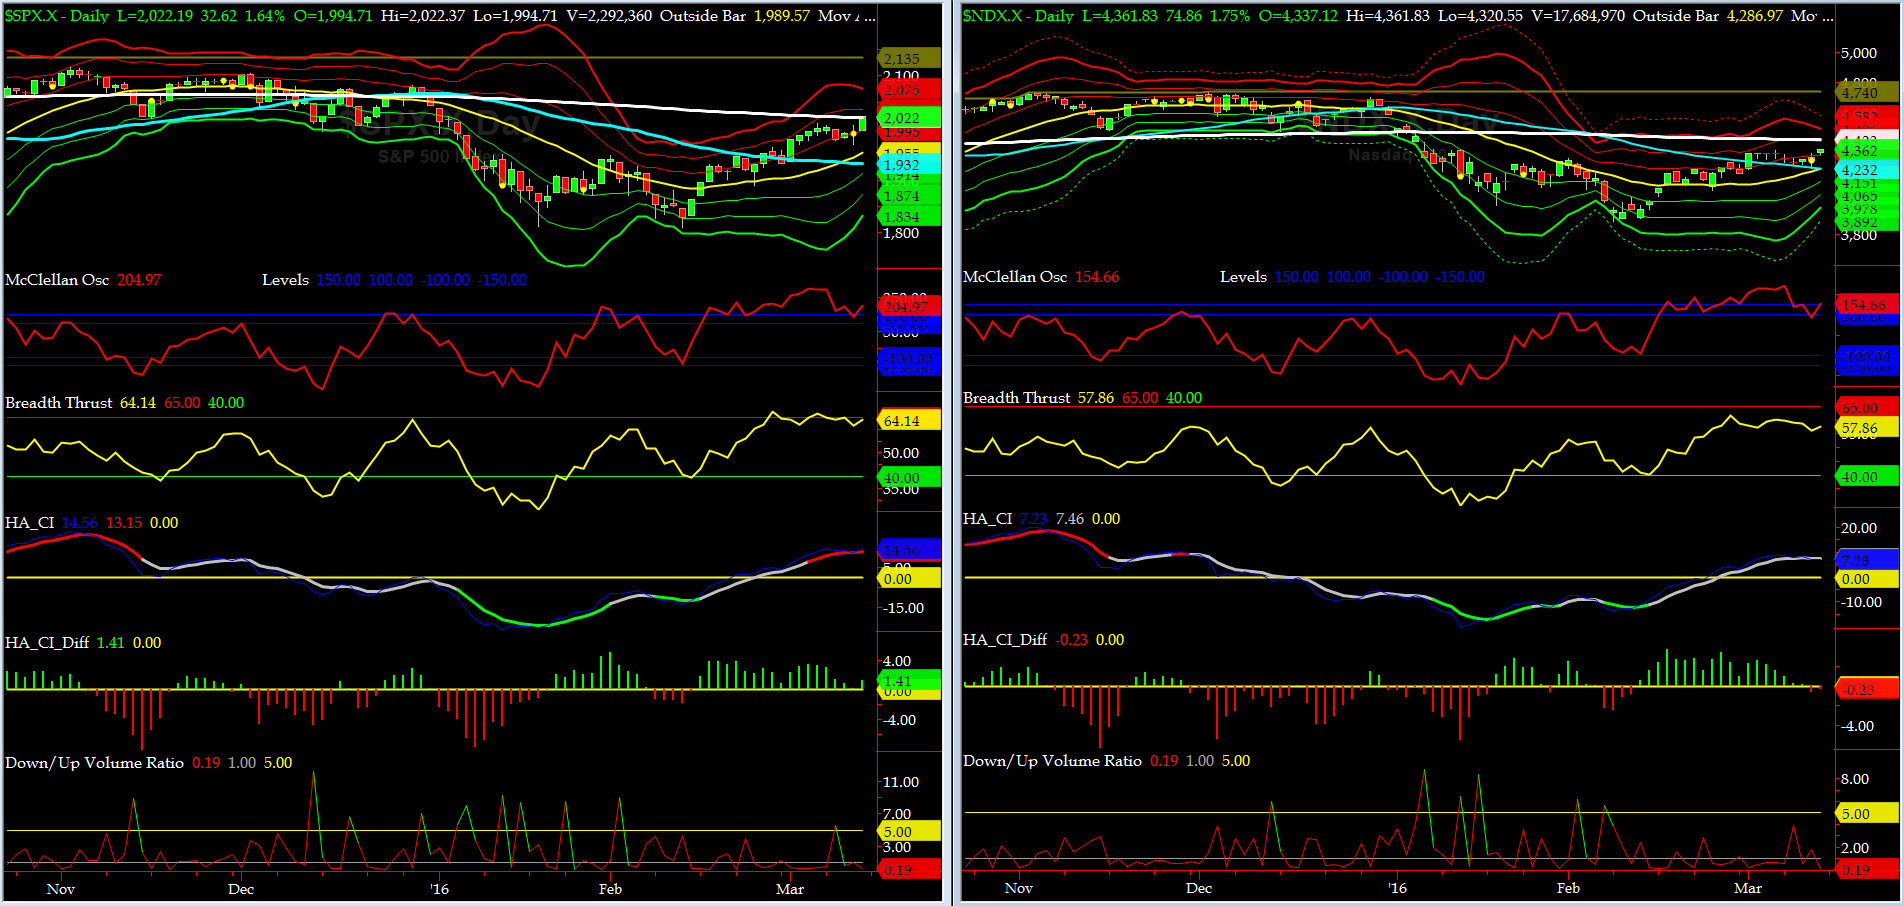
Most recent S&P-500 Cash Index (SPX): 1999.99 2022.19 up +22.20 (up +1.11%) for the week ending on Friday, March 11th, 2016, which closed about its 200 day MA & its +1.5 sigma.
SPX ALL TIME INTRADAY HIGH = 2134.72 (reached on Wednesday, May 20th, 2015)
SPX ALL TIME CLOSING HIGH = 2130.82 (reached on Thursday, May 21st, 2015)
Current DAILY +2 Sigma SPX = 2035 with WEEKLY +2 Sigma = 2150
Current DAILY 0 Sigma (20 day MA) SPX = 1955 with WEEKLY 0 Sigma = 1994
Current DAILY -2 Sigma SPX = 1874 with WEEKLY -2 Sigma = 1838
NYSE McClellan Oscillator = +205 (-150 is start of the O/S area; around -275 to -300 area or lower, we go into the �launch-pad� mode, over +150, we are in O/B area)
NYSE Breadth Thrust = 64.14 (40 is considered as oversold and 65 as overbought)
As expected, SPX met & finally closed above its 200day MA (2020).... NDX 200-bar is at 4423.
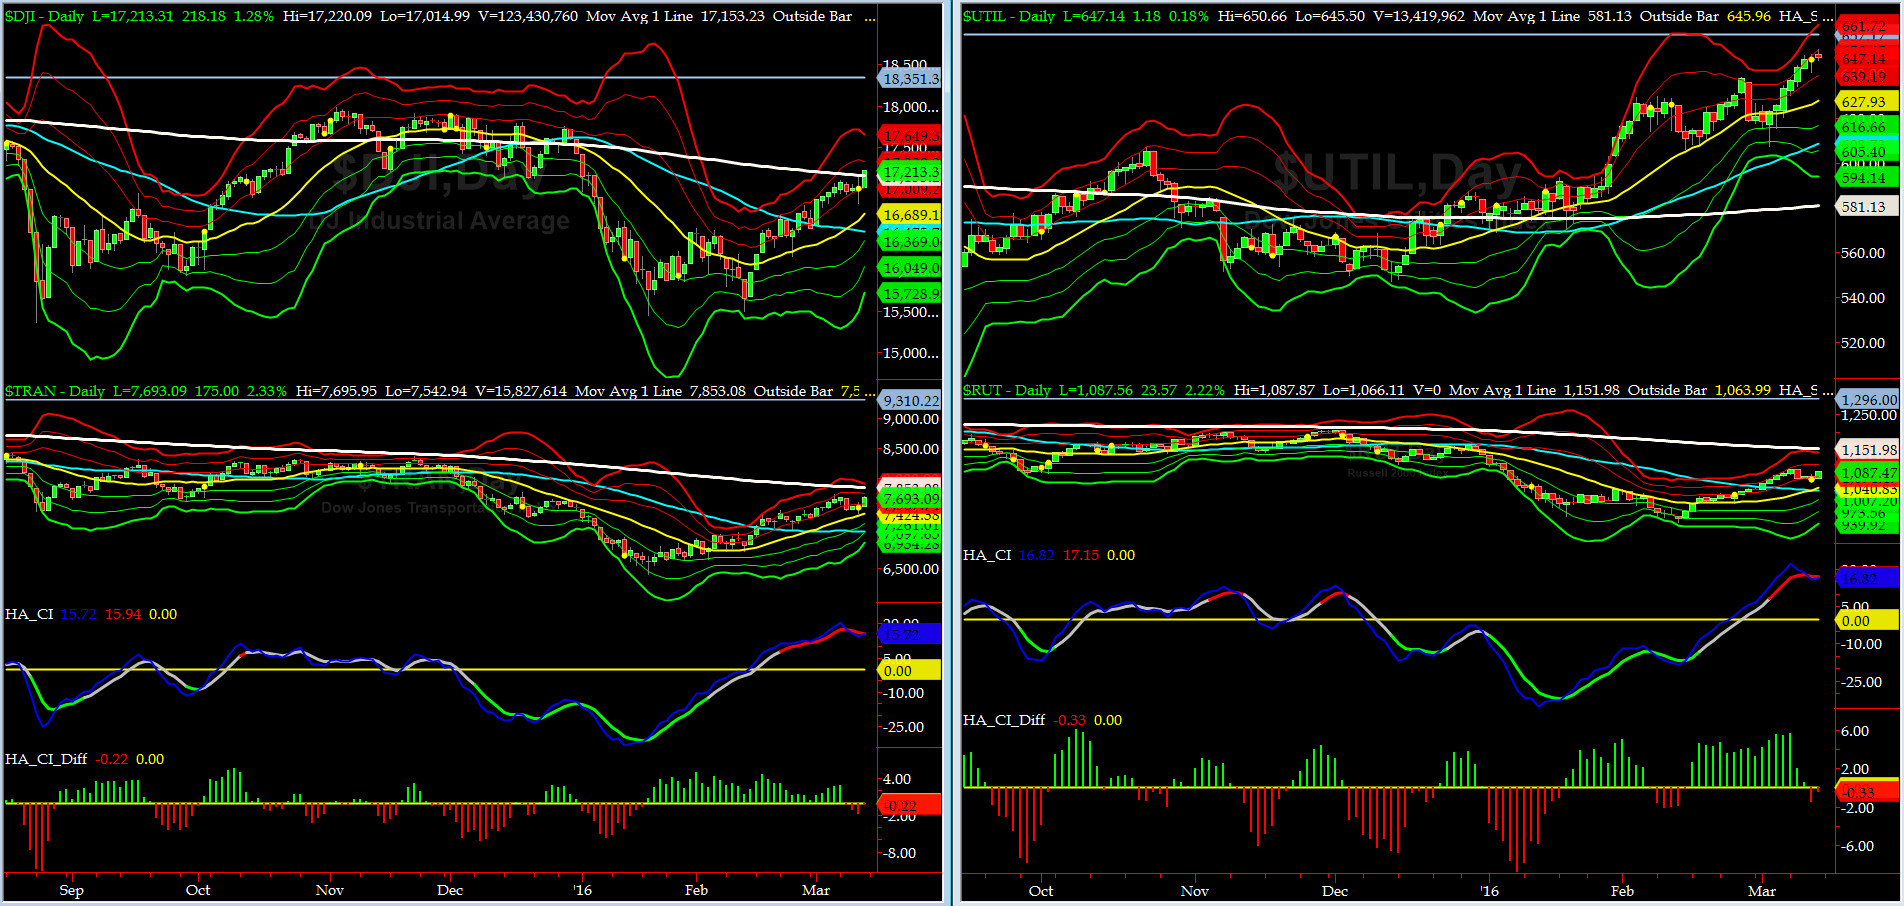
Canaries [in the Coal Mine] Chart for DJ TRAN & RUT Indices
200-Day MA DJ TRAN = 7853 or -2.0% above DJ TRAN (max observed in last 5 yrs = 20.2%, min = -20.3%)
200-Day MA RUT = 1152 or -5.6% above RUT (max observed in last 5 yrs = 21.3%, min = -22.6%)
DJ Transports (proxy for economic conditions 6 to 9 months hence) spent most of the last 5 weeks in the 0 to +2 sigma channels. We view this as very positive for longer term econ picture.
Must recall that Transports peaked in Nov '14 and then led the SPX down in 2015 and now they are leading SPX higher.
Russell 2000 Small Caps (proxy for RISK ON/OFF) is now 3% above its 50day MA & RISK continues to crawl back in.
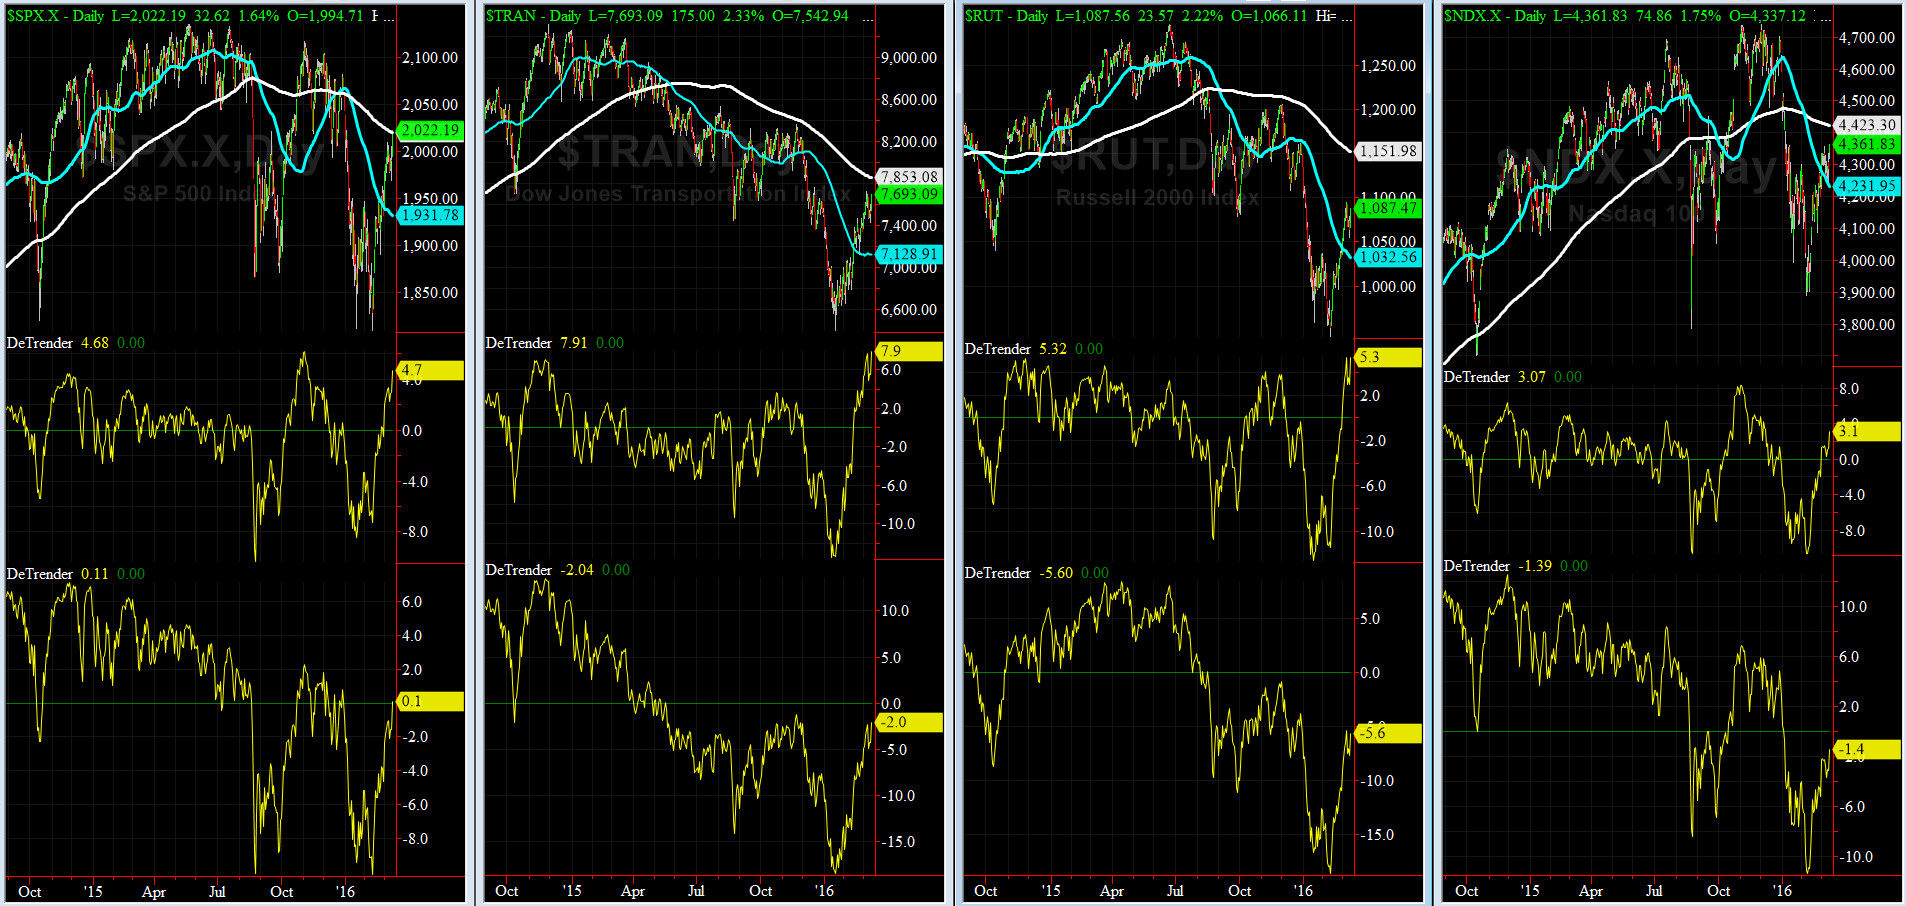
DeTrenders Charts for SPX, NDX, TRAN & RUT Indices
50-Day MA SPX =1932 or +4.7% below SPX (max observed in last 5 yrs = +8.6%, min = -9.3% )
200-Day MA SPX = 2022 or +0.1% below SPX (max observed in last 5 yrs = 15.2%, min = -14%)
THREE of our Eight DeTrenders are negative now but all have improved since Jan lows.
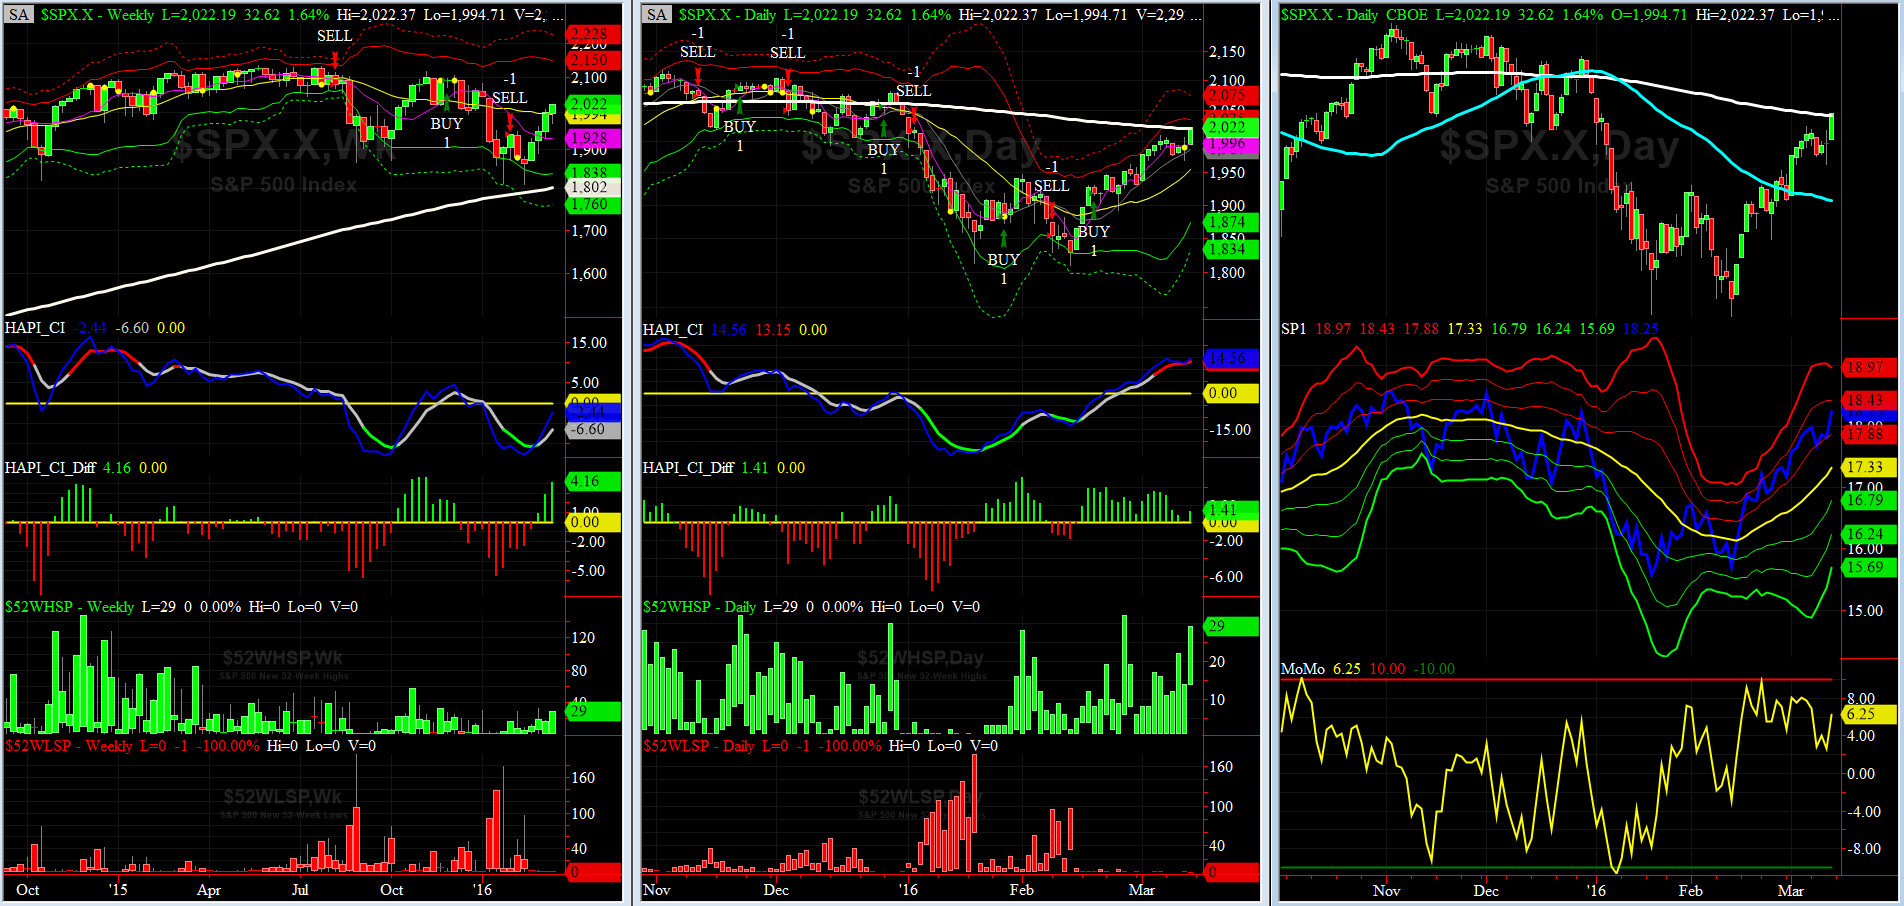
HA_SP1_momo Chart
WEEKLY Timing Model = on a SELL Signal since Friday 1/29/16 CLOSE
DAILY Timing Model = on a BUY Signal since Thursday 2/18/16 CLOSE
Max SPX 52wk-highs reading last week = 29 (over 120-140, the local maxima is in)
Max SPX 52wk-Lows reading last week = 1 (over 40-60, the local minima is in)
HA_SP1 = is still rising near its +1.5 Sigma
HA_Momo = +6.25 (reversals most likely occur above +10 or below -10)
NOTE: it is worth paying attention to the divergences developing between our HA_momo and HA_SP1.
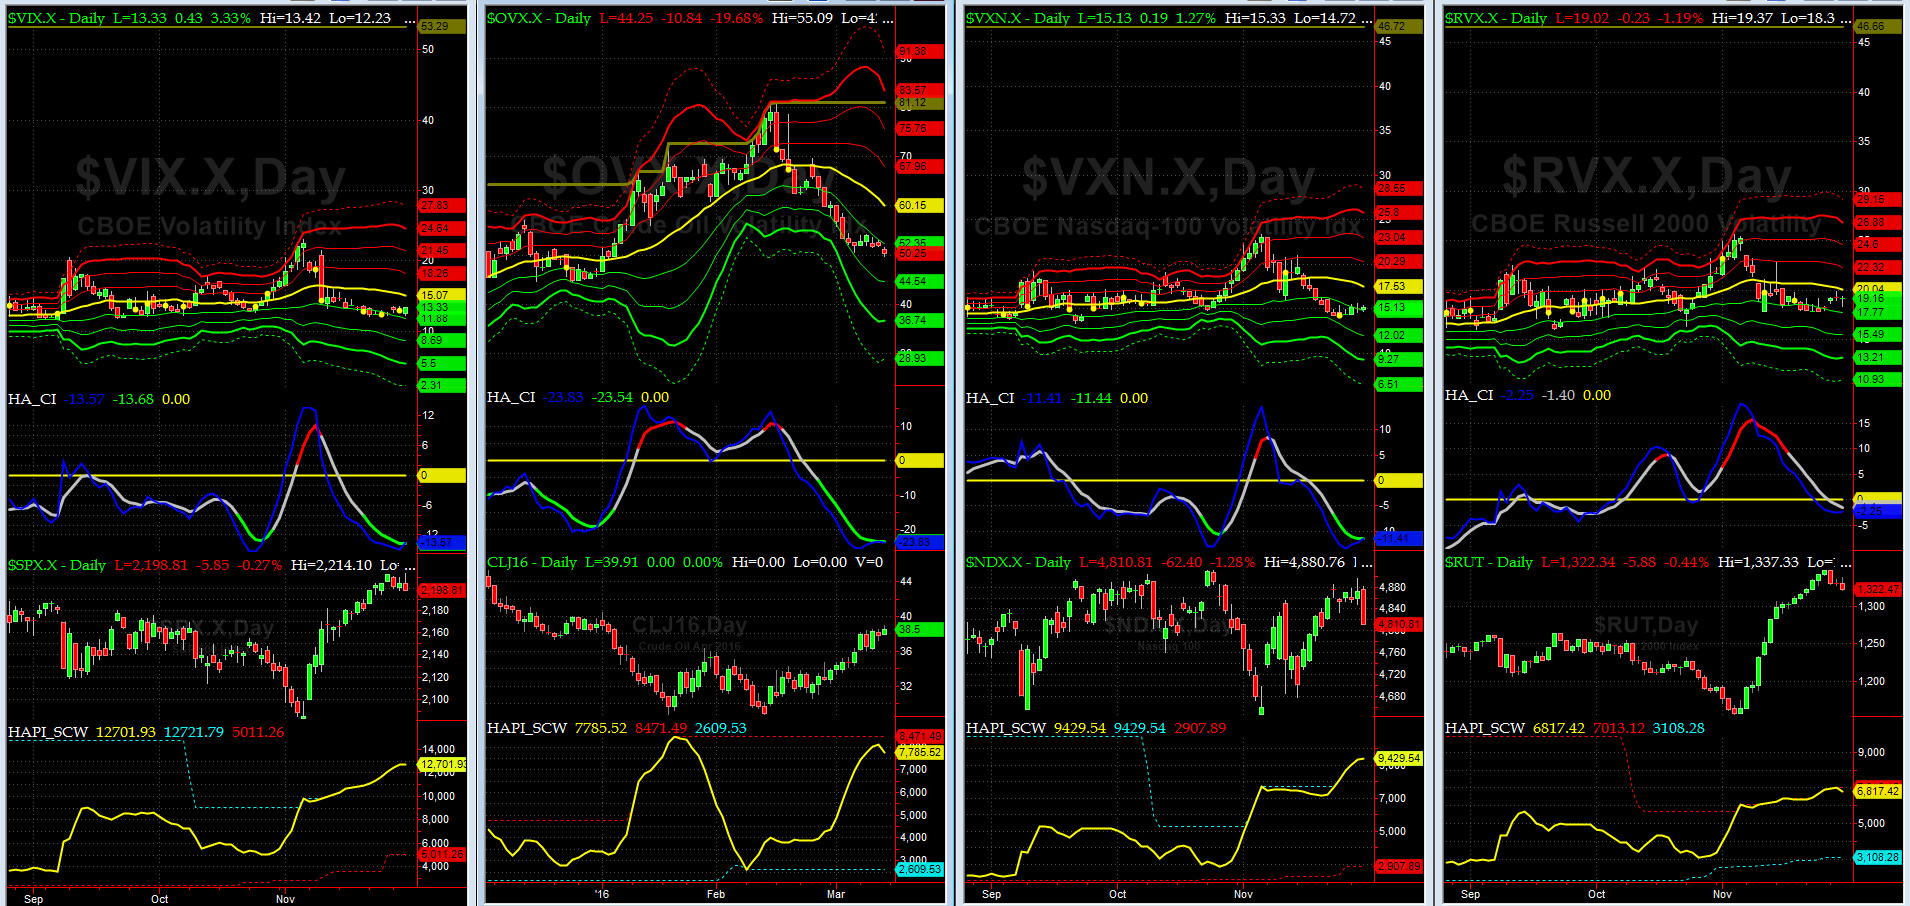
Vol of the Vols Chart
VIX = 16.5 which is at its -1 sigma (remember it�s the VIX�s vol pattern (its sigma channels) that matters, and not the level of VIX itself (this is per Dr. Robert Whaley, a great mentor and the inventor of original VIX, now called VXO. VIX usually peaks around a test of its +4 sigma).
As stated here in the last 6 weeks, this shockwave is over till the next shoe drops.
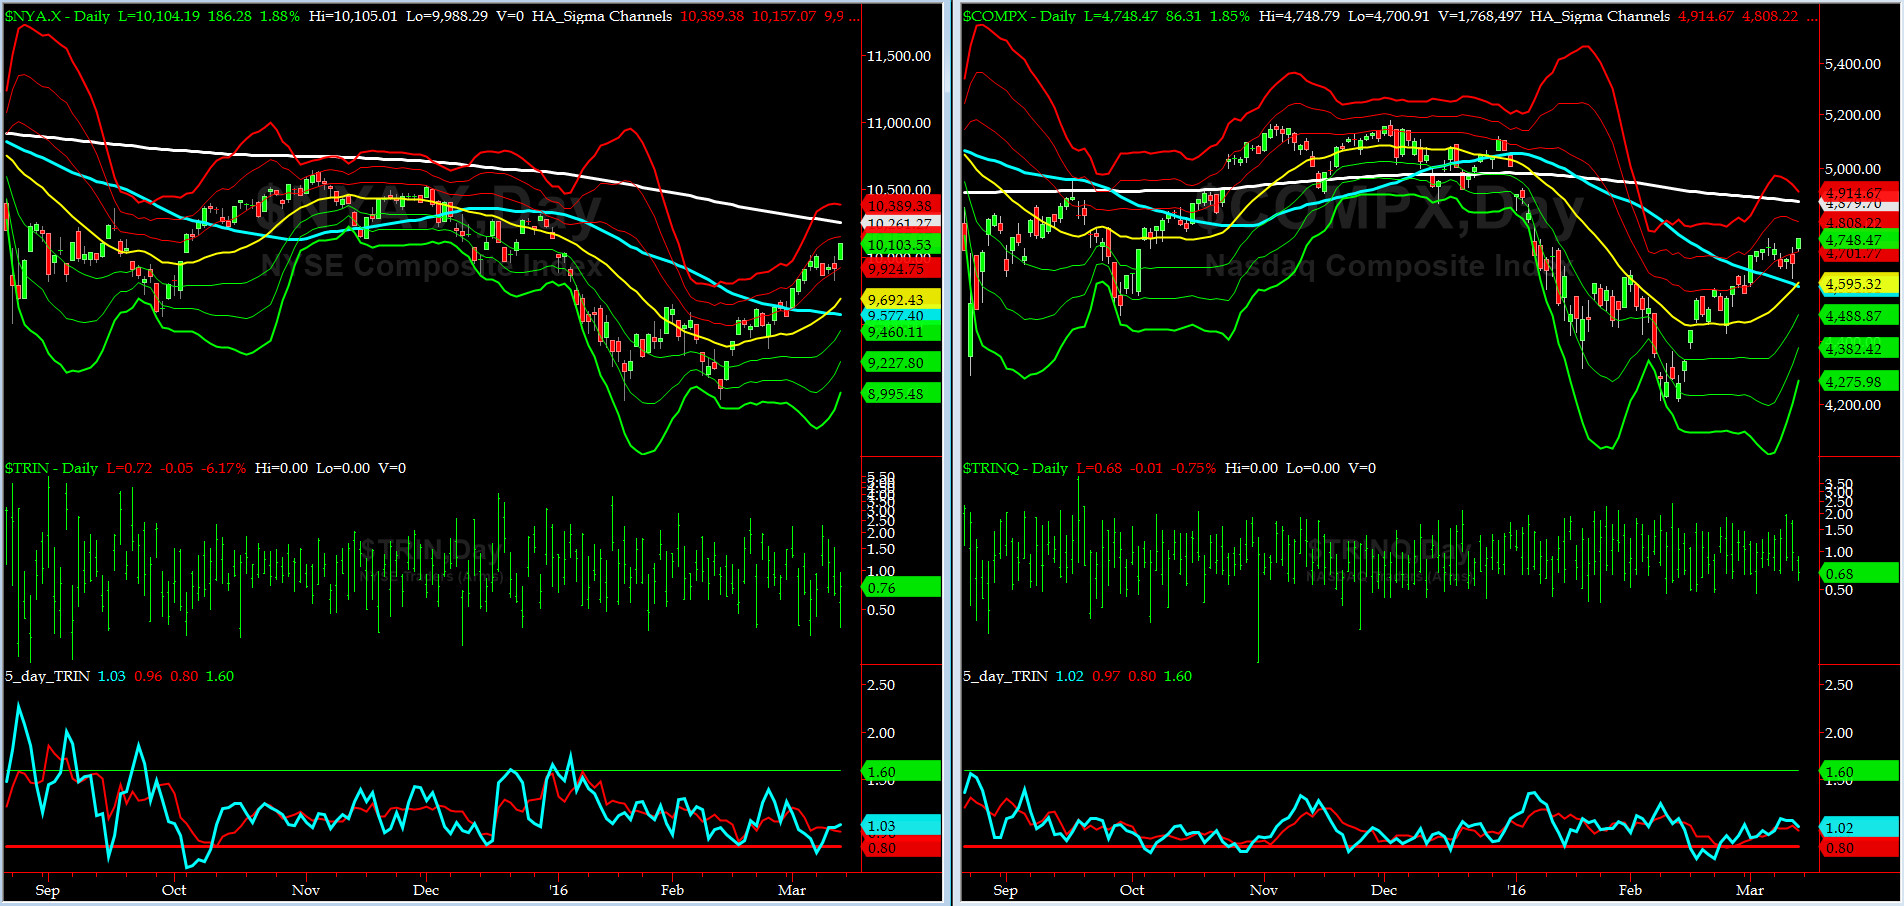
5-day TRIN & TRINQ Charts
The 5-day TRIN (for NYSE) and 5-day TRINQ (for NASDAQ) are now showing NEUTRAL readings. As we have reminded our readers in our webinars, at times TRIN Indicator (due to its construct) can mislead. Keep that in mind.
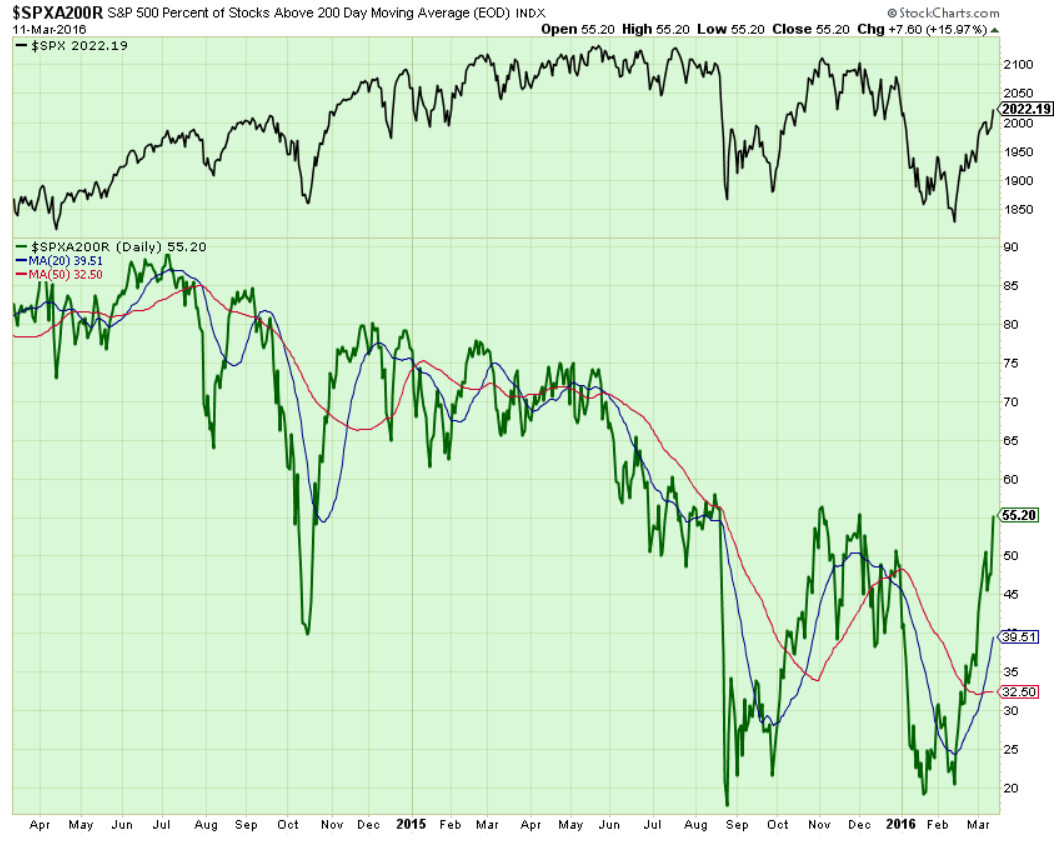
Components of SPX above their respective 200day MA Chart
We closed the week over 55% for this scoring indicator. If it can get thru 57% then the next key levels are 60% & then 65%.
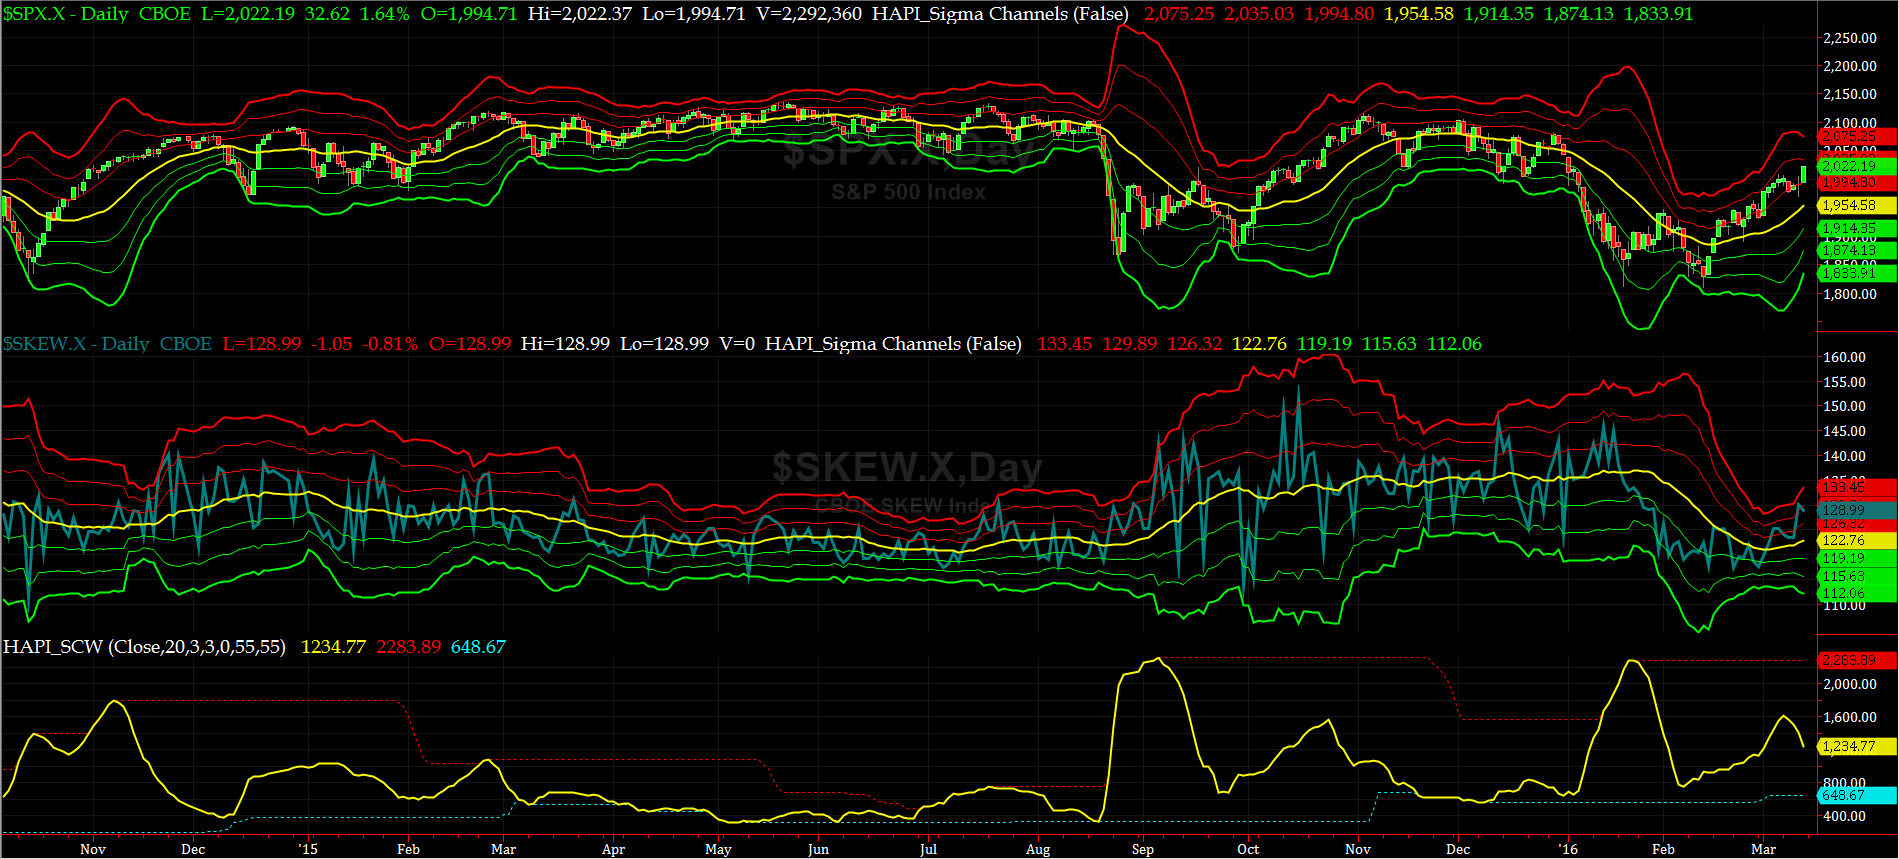
SPX SKEW (Tail Risk) Chart
SPX SKEW (Tail Risk) = 129 and about its +2 sigma (normal = 120-125, range 100-150)
All Quiet on the Mid-Western Front? Yes for NOW. We think, my co-pilot, @Capt_Tiko, was wrong (probably due to having too much Foumanat Tea). LOL.
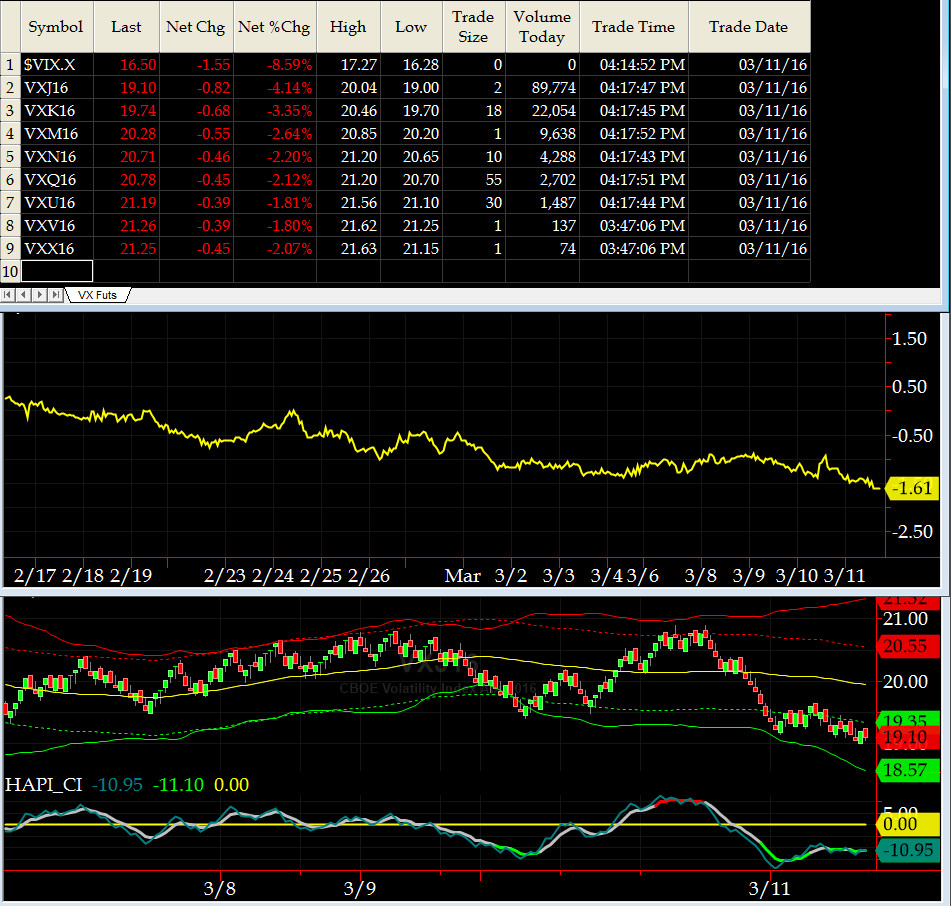
3-month VIX Futures Spread(VX) Chart
As discussed in the last webinar (Mar 9th), on Friday we rolled our spread.
Now, our 3-month VIX Futures Spread (LONG APR16 & SHORT JUL16), closed Friday at -1.61. This confirms SPX is heading up for now (till we get to about -3 reading), but, NOT necessarily in a straight line.
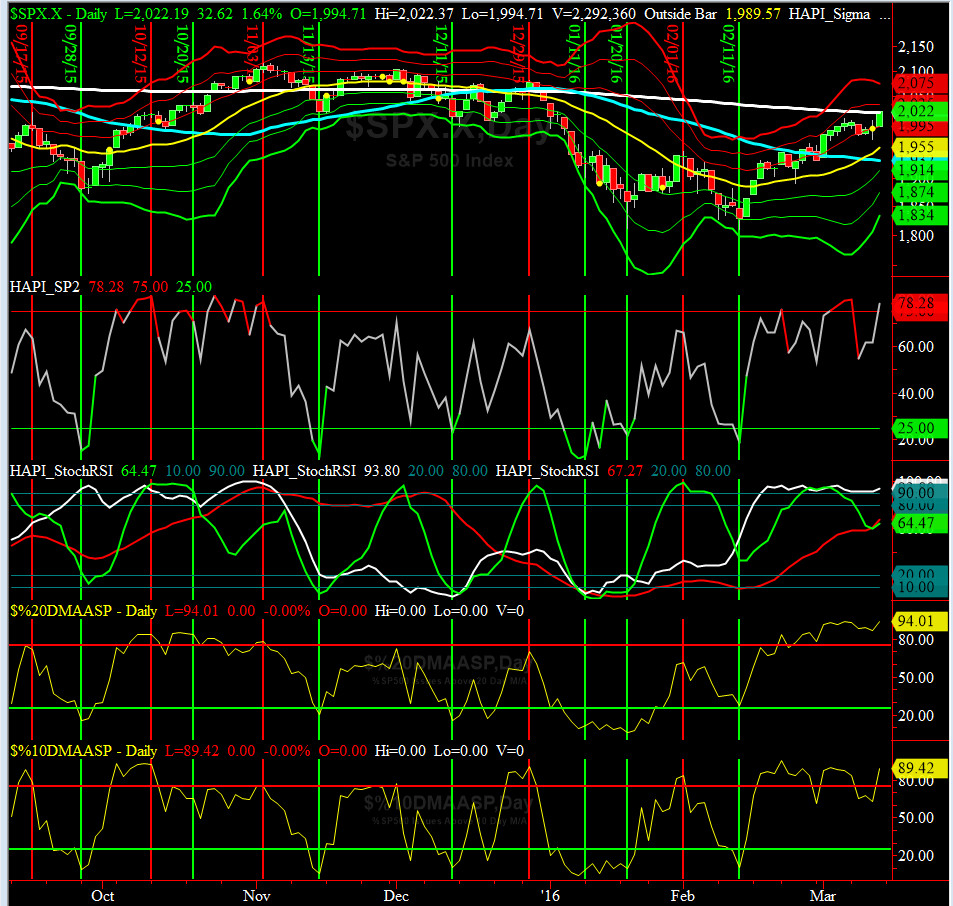
HA_SP2 Chart
HA_SP2 = 78.28(Buy signal <= 25, Sell Signal >= 75)
At ~80, this prop indicator is VERY OverBought.
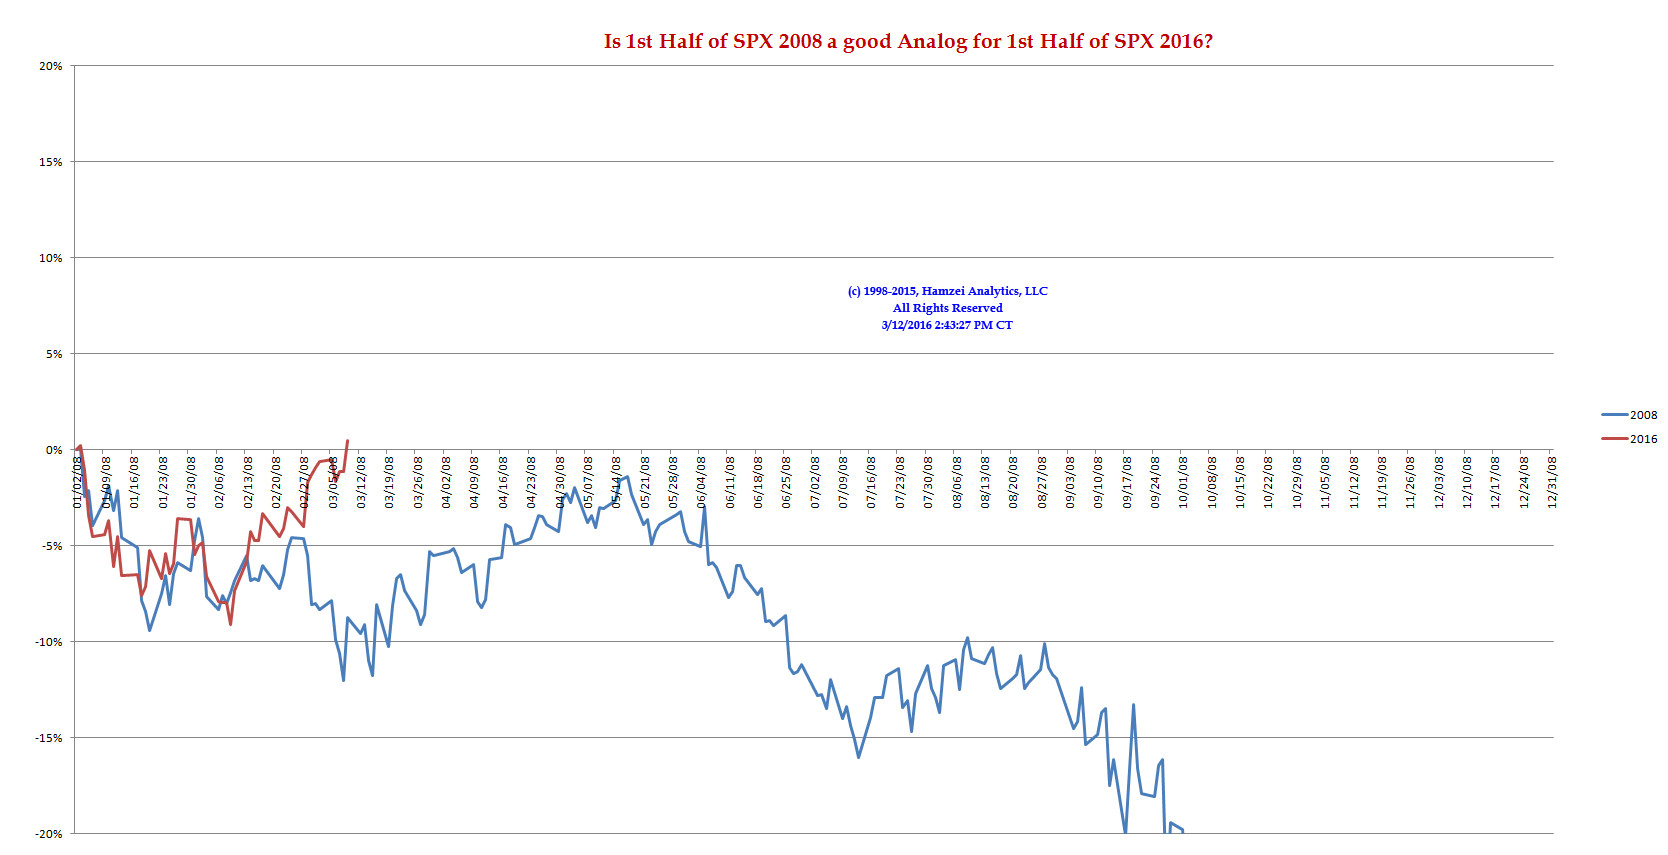
SPX 2008 Analog for SPX 2016
SPX 2016 is no longer tracking the SPX 2008 price action.

SPX 2002 Analog for SPX 2016
Per referral of a PMT Member, my co-pilot, @Capt_Tiko, have started to track SPX 2002 price action. We are still looking for a pullback AROUND Spring Equinox (which is Norouz = Persian New Year 1395) on March 20th +/- 2 trading days.
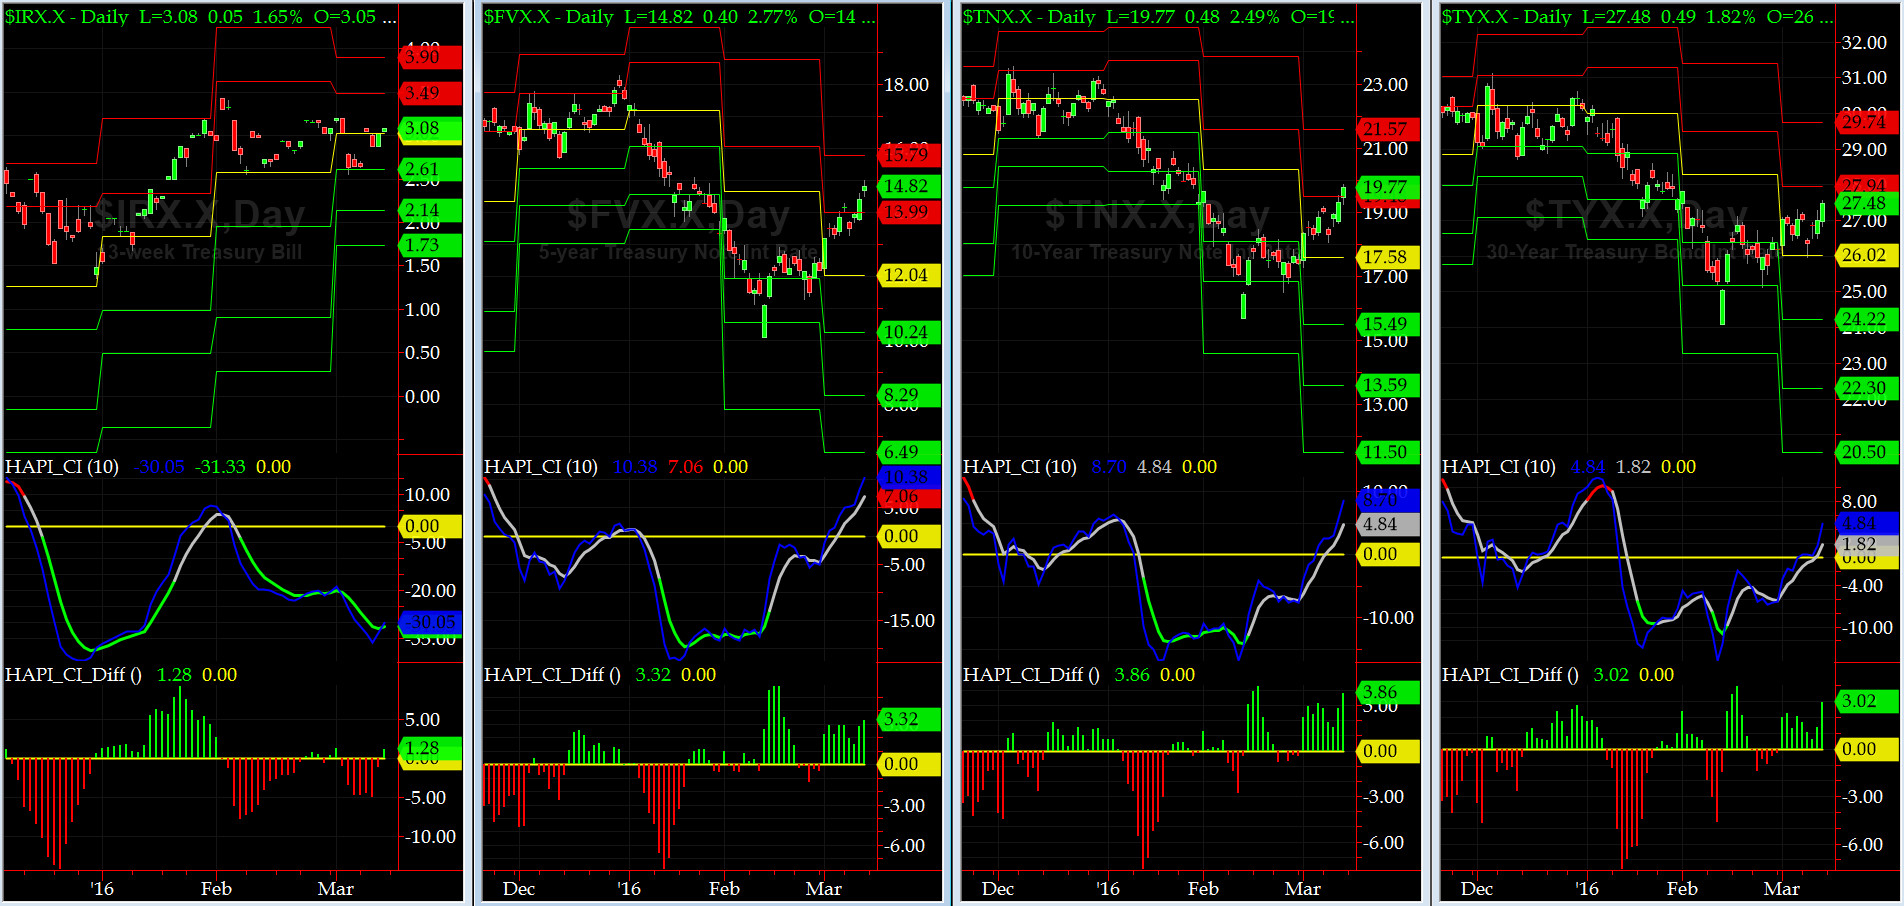
US Treasury T-Notes & T-Bonds Yields Chart
US Treasury Yield Curve steepend again this past week. Classic asset allocation move by portfolio managers as SPX hits 200day MA.
Fari Hamzei
|


 Proactive Market Timing


