|
Sunday, March 27, 2016 2100ET
Market Timing Charts, Analysis & Commentary for Issue #136
Timer Charts of S&P-500 Cash Index (SPX) + NASDAQ-100 Cash Index (NDX)
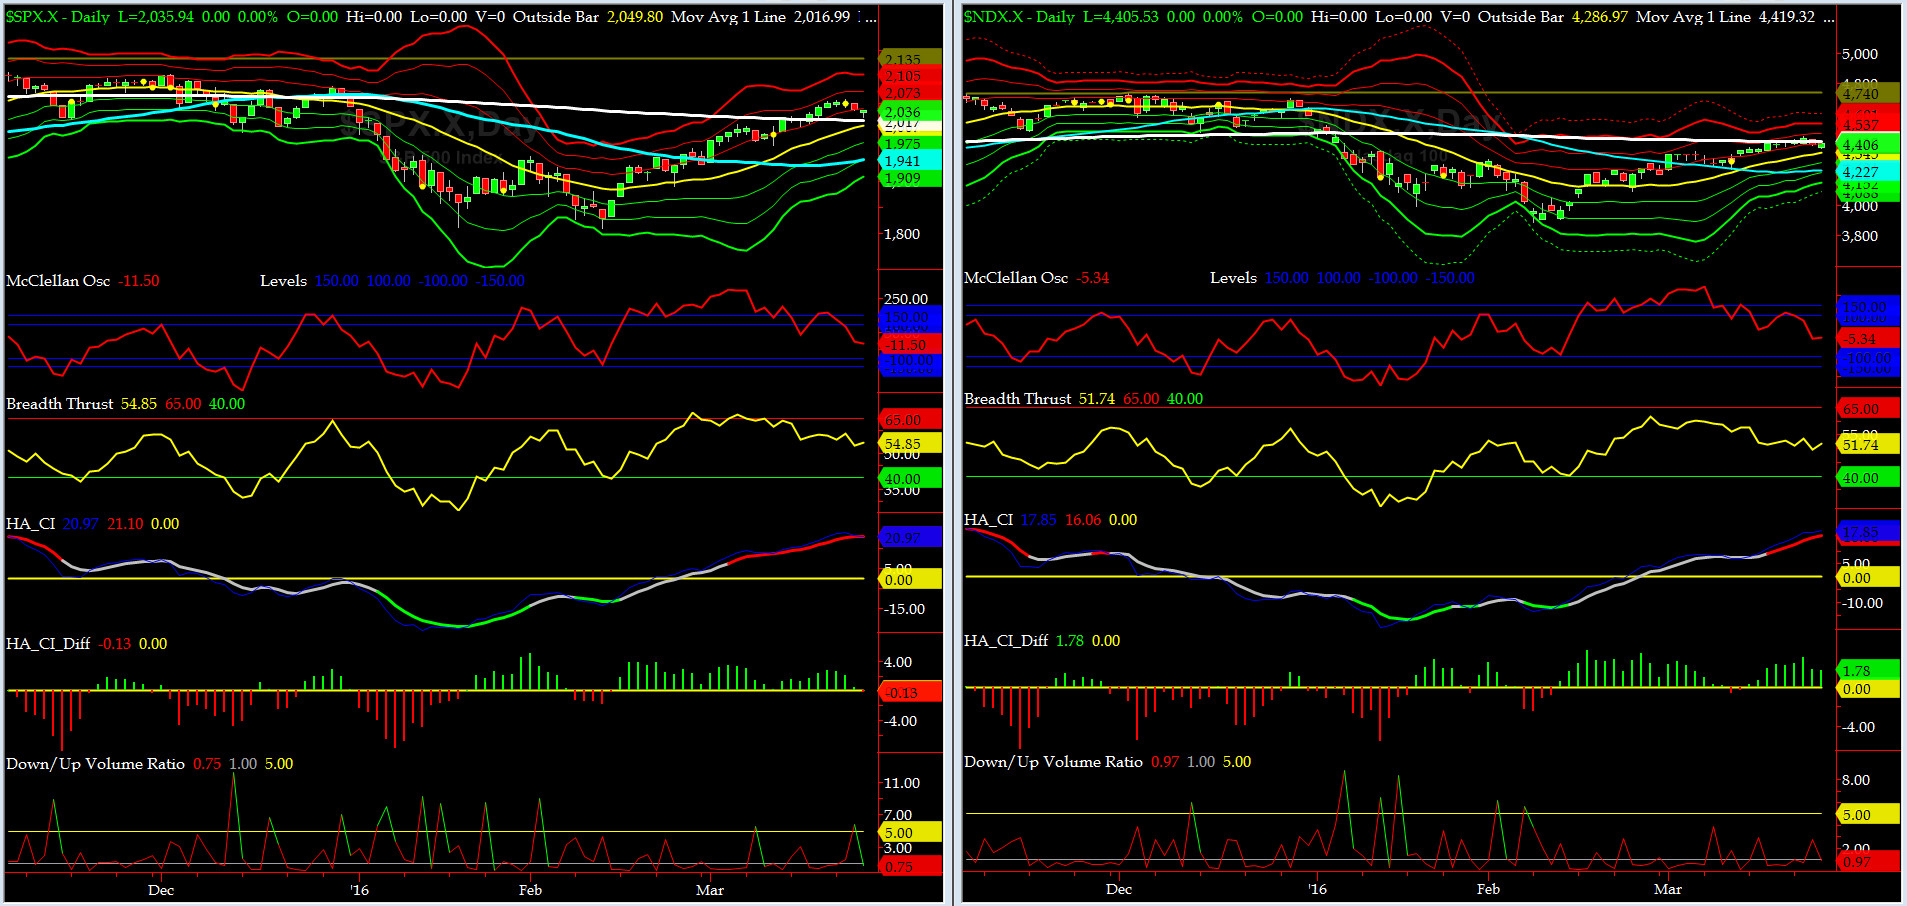
Most recent S&P-500 Cash Index (SPX): 2035.94 down -14.59 (down -0.71%) for the week ending on Thursday, March 24th, 2016, which closed about its 200 day MA & its +0.75 sigma.
SPX ALL TIME INTRADAY HIGH = 2134.72 (reached on Wednesday, May 20th, 2015)
SPX ALL TIME CLOSING HIGH = 2130.82 (reached on Thursday, May 21st, 2015)
Current DAILY +2 Sigma SPX = 2073 with WEEKLY +2 Sigma = 2136
Current DAILY 0 Sigma (20 day MA) SPX = 2007 with WEEKLY 0 Sigma = 1989
Current DAILY -2 Sigma SPX = 1942 with WEEKLY -2 Sigma = 1843
NYSE McClellan Oscillator = -12 (-150 is start of the O/S area; around -275 to -300 area or lower, we go into the �launch-pad� mode, over +150, we are in O/B area)
NYSE Breadth Thrust = 54.85 (40 is considered as oversold and 65 as overbought)
It's worth noting that, last Thursday, SPX came within 5 handles of testing its 200 day MA, from above, and then put in a "hammer" candlestick bar. This is very bullish configuration. We should run up from here. Target = 2100-2120.
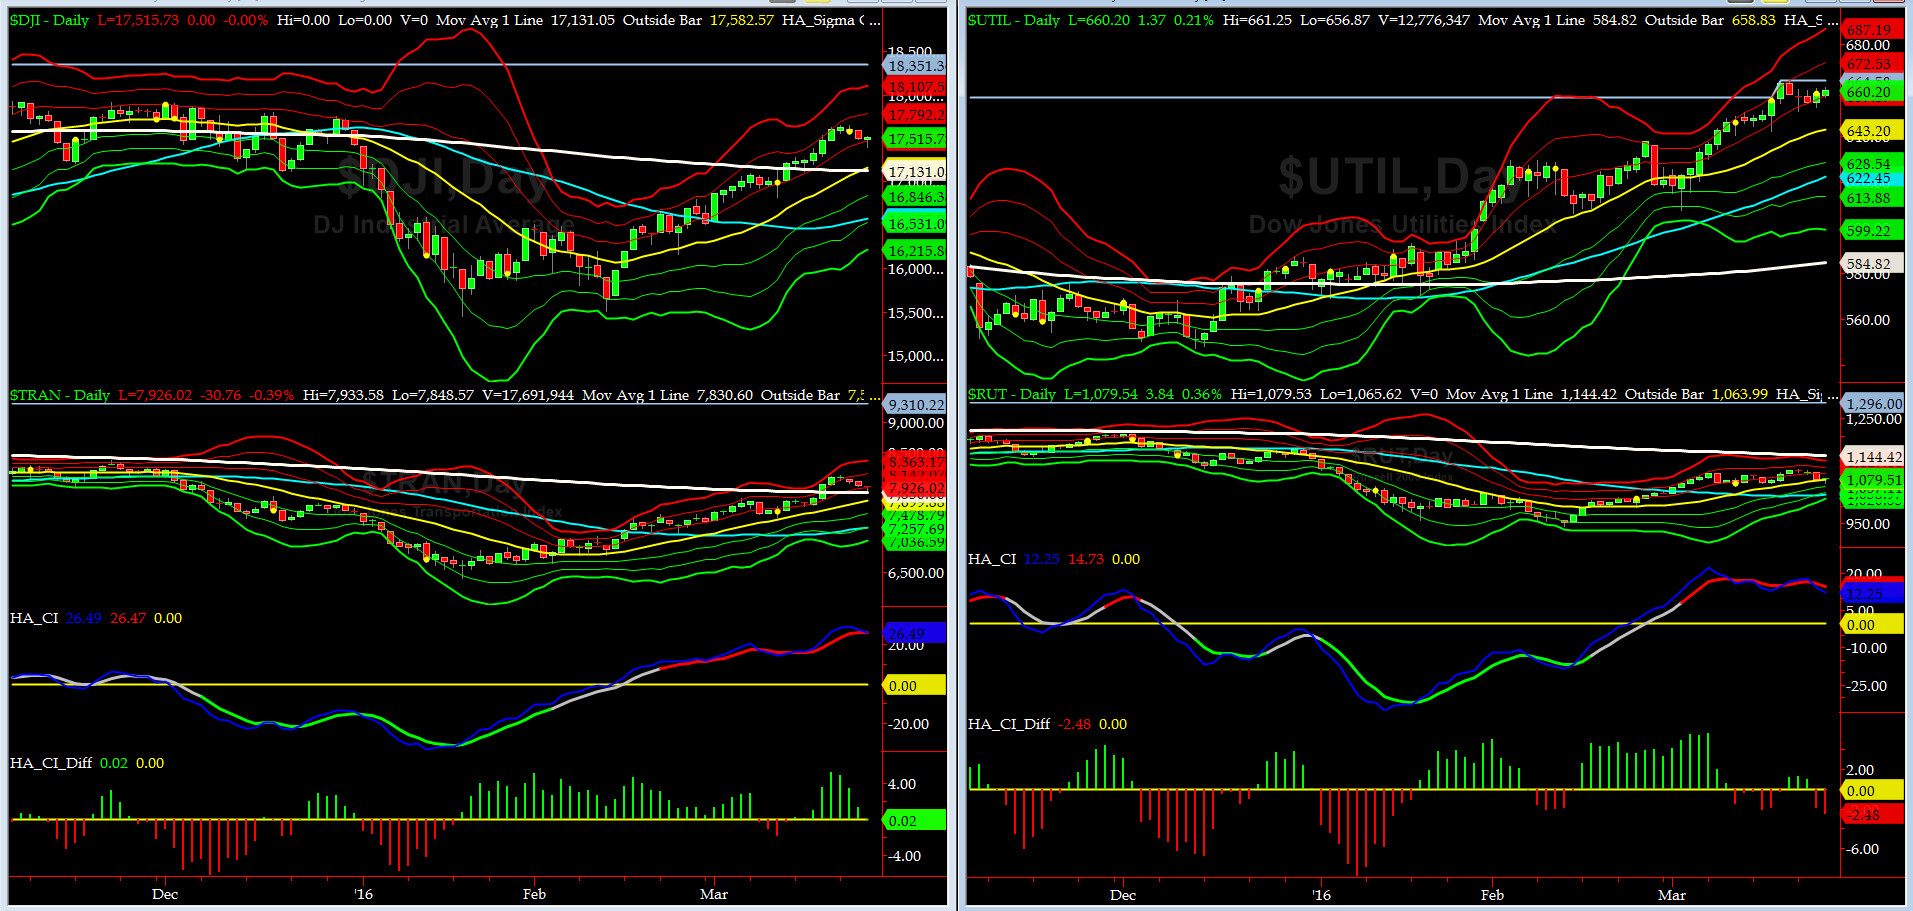
Canaries [in the Coal Mine] Chart for DJ TRAN & RUT Indices
200-Day MA DJ TRAN = 7830 or 1.2% below DJ TRAN (max observed in last 5 yrs = 20.2%, min = -20.3%)
200-Day MA RUT = 1144 or 5.7% above RUT (max observed in last 5 yrs = 21.3%, min = -22.6%)
DJ Transports (proxy for economic conditions 6 to 9 months hence) also tested its 200 day MA with a "hammer" candlestick. We view this as very positive for intermediate term econ picture.
Must recall that Transports peaked in Nov '14 and then led the SPX down in 2015 and now they are leading SPX higher after bottoming in Jan 20, 2016.
Russell 2000 Small Caps (proxy for RISK ON/OFF) is now 4.6% above its 50day MA & RISK continues to crawl back in, albeit at a slow rate as RUT has been almost flat in the last two weeks.
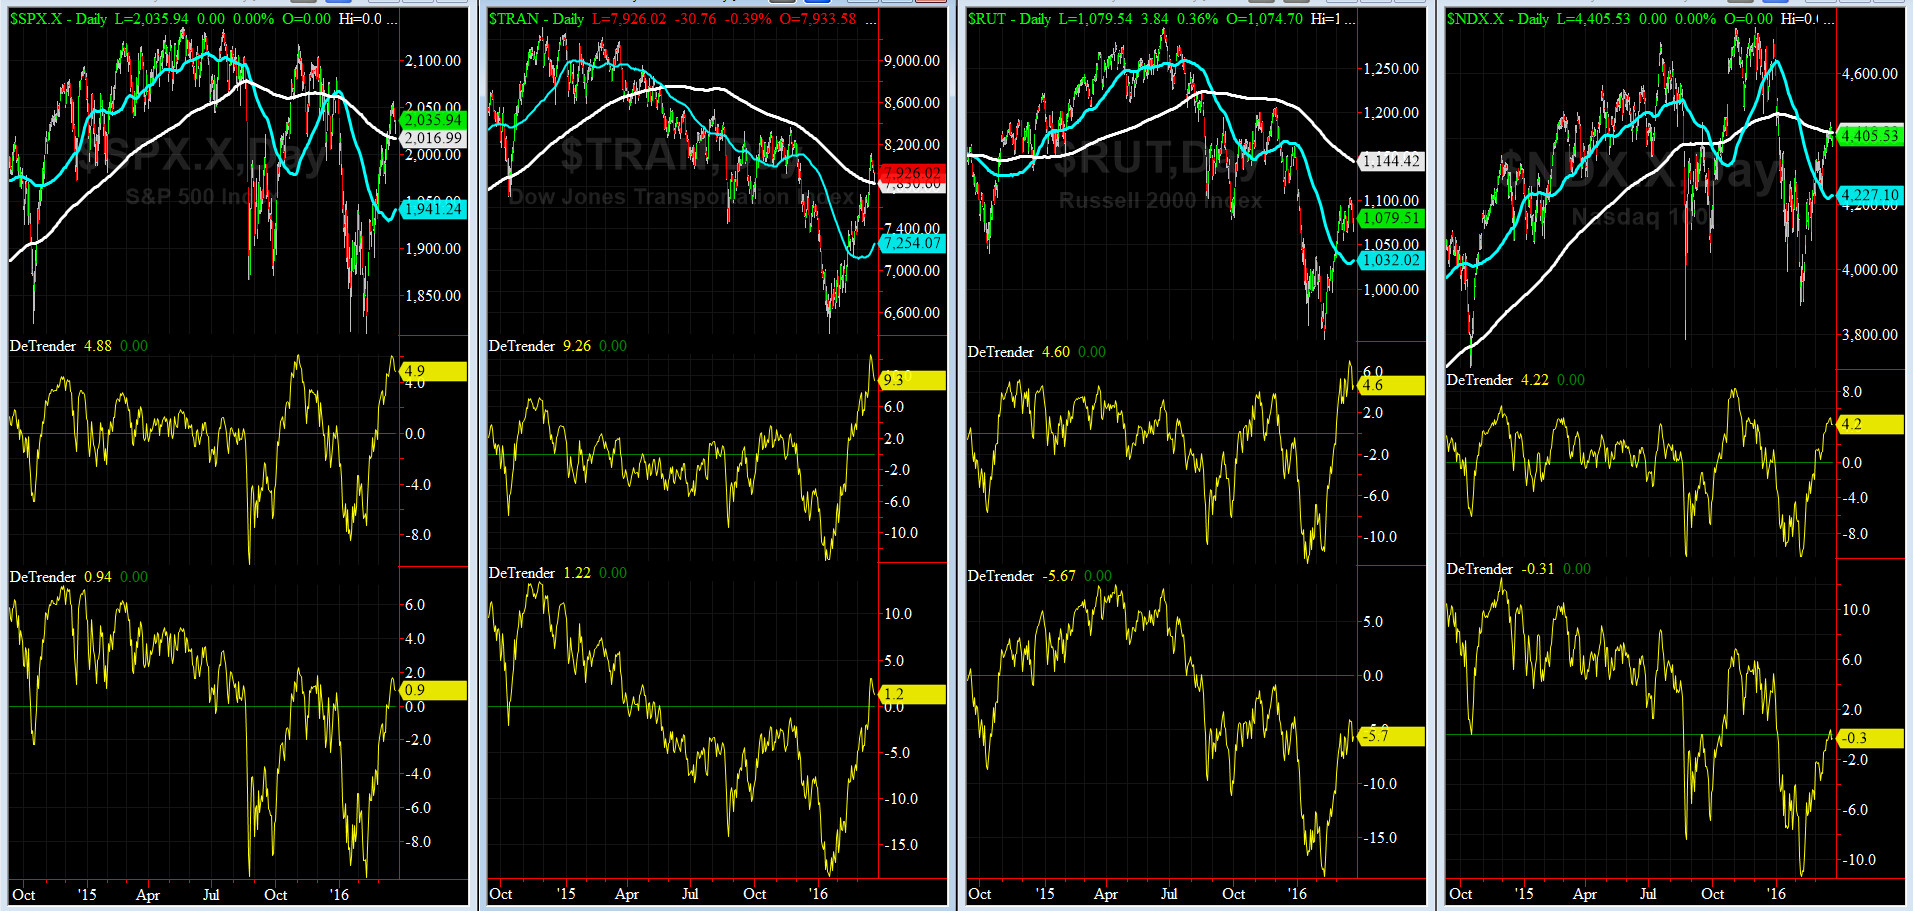
DeTrenders Charts for SPX, NDX, TRAN & RUT Indices
50-Day MA SPX =1941 or +4.9% below SPX (max observed in last 5 yrs = +8.6%, min = -9.3% )
200-Day MA SPX = 2017 or +0.9% below SPX (max observed in last 5 yrs = 15.2%, min = -14%)
Only TWO of our Eight DeTrenders are negative now (RUT & NDX 200DTs) but all have greatly improved since Jan lows.
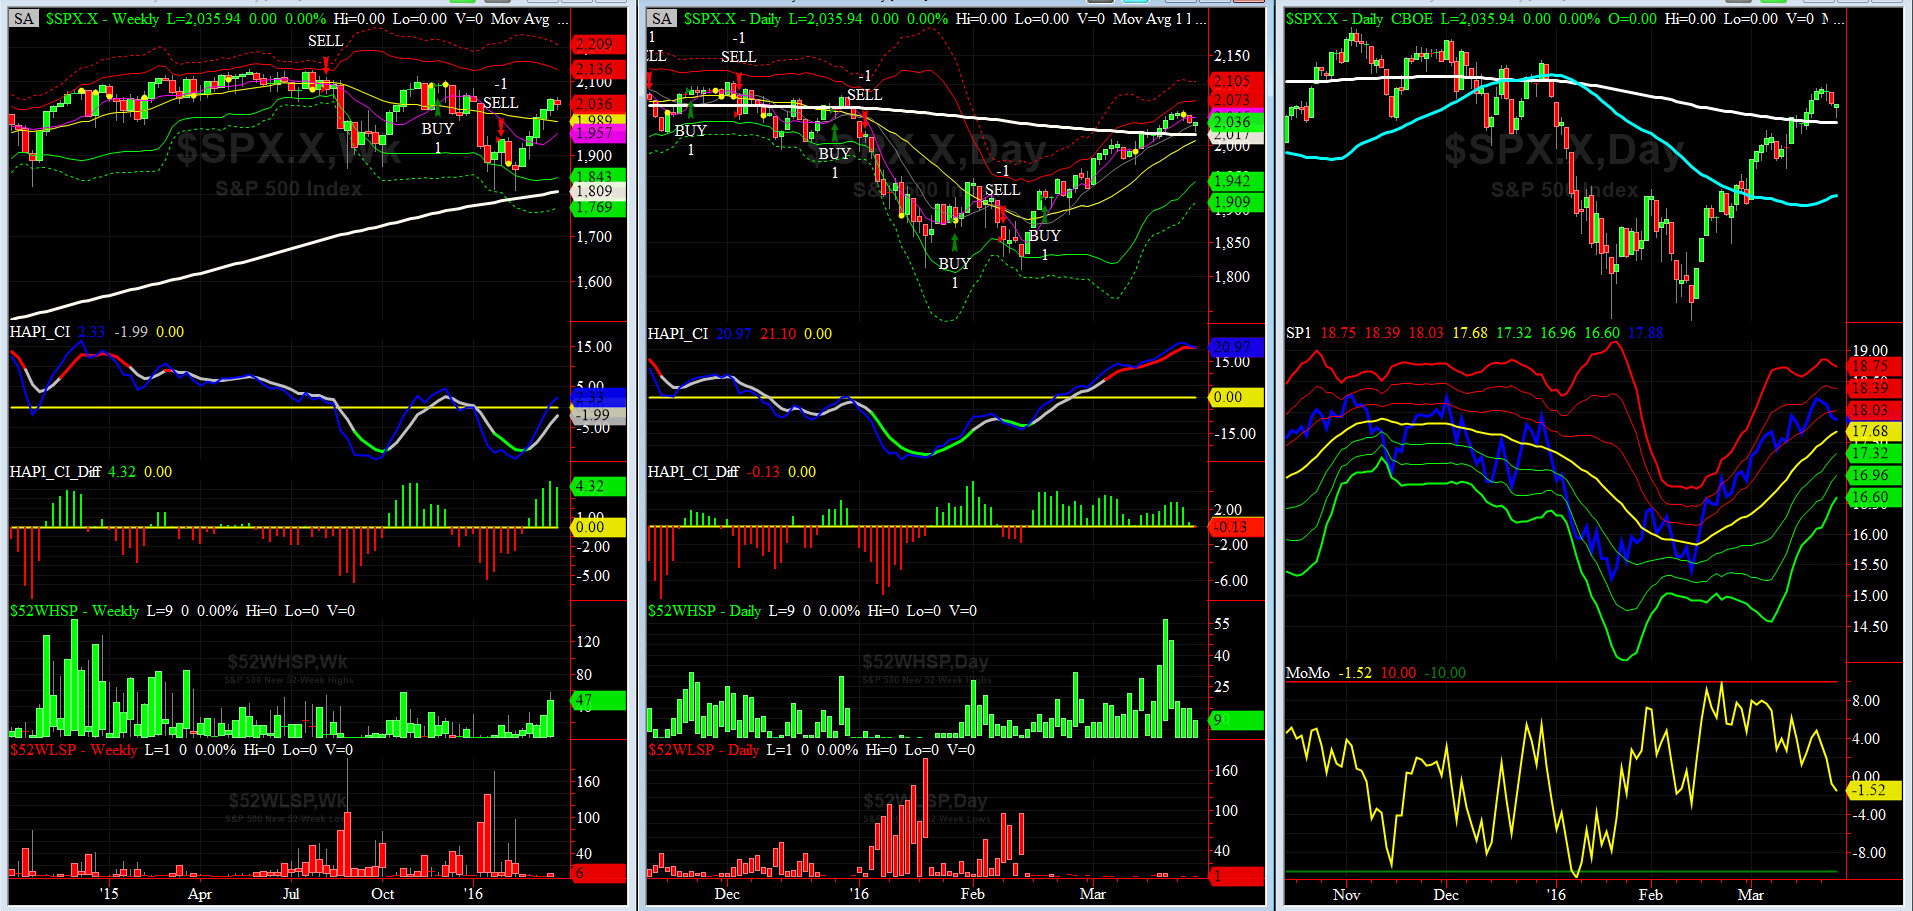
HA_SP1_momo Chart
WEEKLY Timing Model = on a SELL Signal since Friday 1/29/16 CLOSE
DAILY Timing Model = on a BUY Signal since Thursday 2/18/16 CLOSE
Max SPX 52wk-highs reading last week = 18 (over 120-140, the local maxima is in)
Max SPX 52wk-Lows reading last week = 1 (over 40-60, the local minima is in)
HA_SP1 = pulled backed into its +0.5 Sigma
HA_Momo = -1.52 (reversals most likely occur above +10 or below -10)
NOTE: it is worth to continue to pay attention to the divergences developing between our HA_momo and HA_SP1.
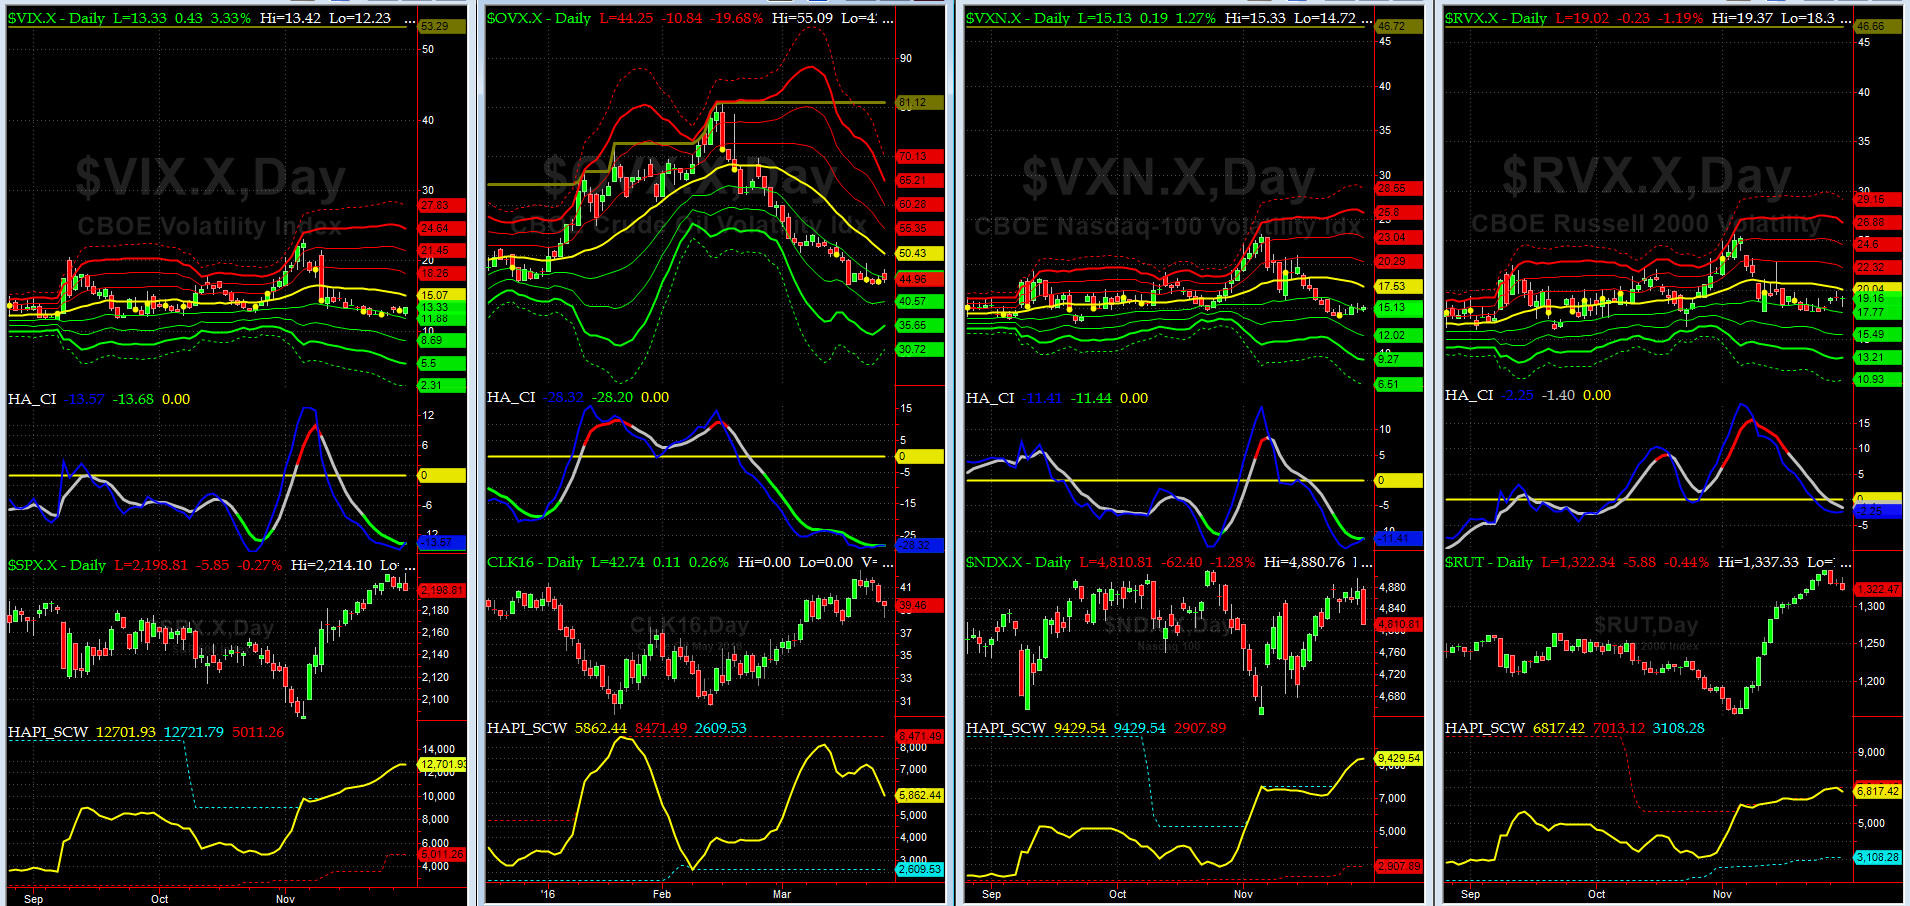
Vol of the Vols Chart
VIX = 14.7 which is at its -1 sigma (remember it�s the VIX�s vol pattern (its sigma channels) that matters, and not the level of VIX itself (this is per Dr. Robert Whaley, a great mentor and the inventor of original VIX, now called VXO. VIX usually peaks around a test of its +4 sigma).
As stated here in the last 8 weeks, this shockwave is over till the next shoe drops.
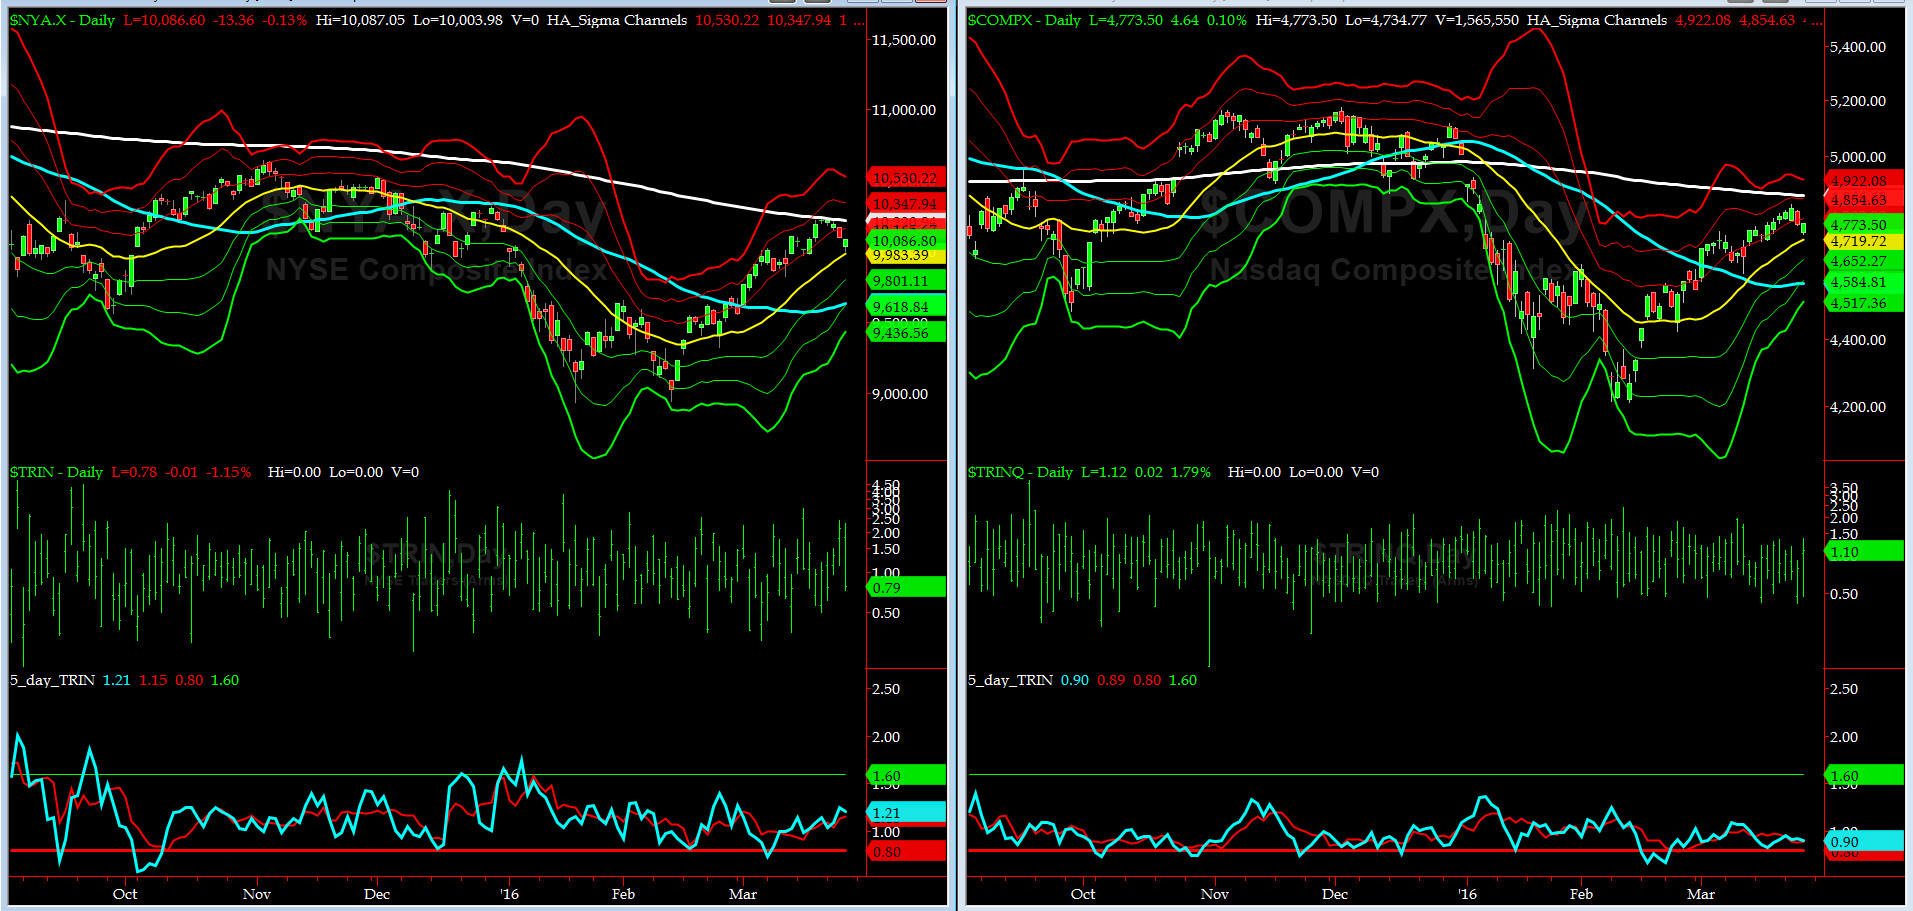
5-day TRIN & TRINQ Charts
The 5-day TRIN (for NYSE) and 5-day TRINQ (for NASDAQ) continue to show NEUTRAL readings. As we have reminded our readers in our webinars, at times, the TRIN Indicator (due to its construct) can mislead. Keep that in mind.
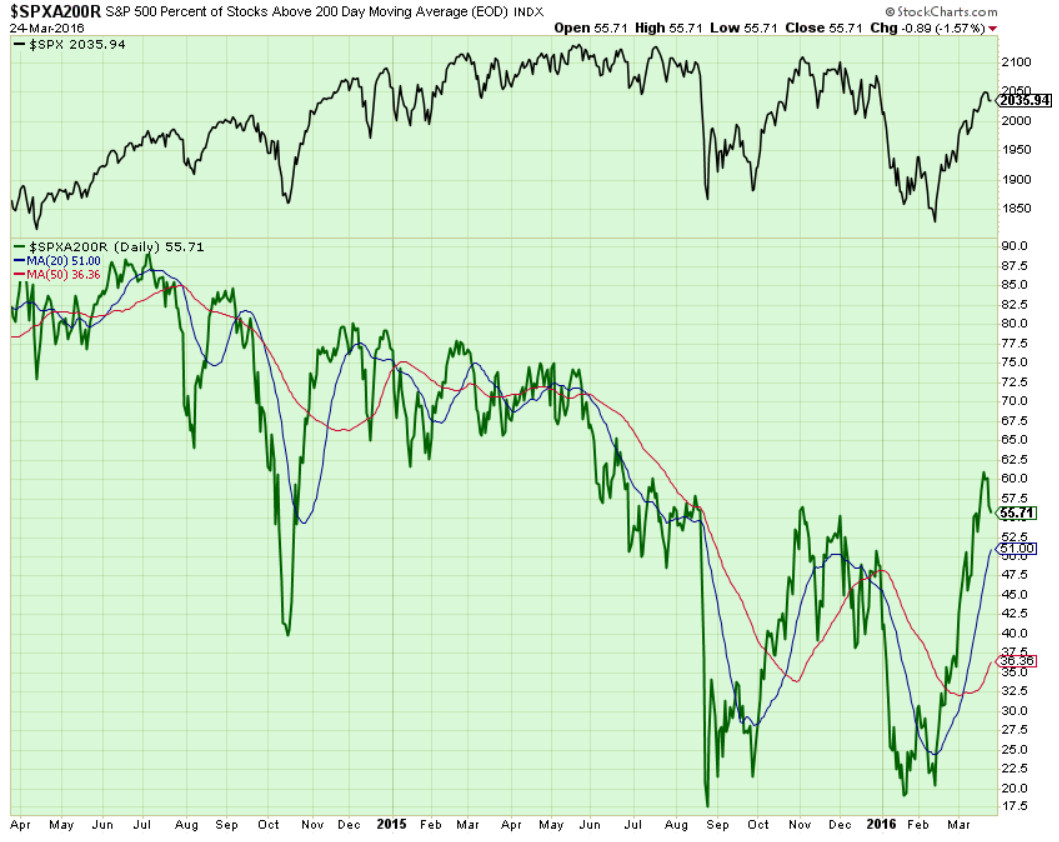
Components of SPX above their respective 200day MA Chart
This past week, this scoring indicator exceeded our 1st target of 60% and then pulled back fast to 56%. It is crucial that 56%-57% level hold here (as a retest failure). You can keep an eye on this level each evening, at approximately about an hour after the market data settles, by entering the symbol shown in upper left hand side of the chart on StockCharts.com website.
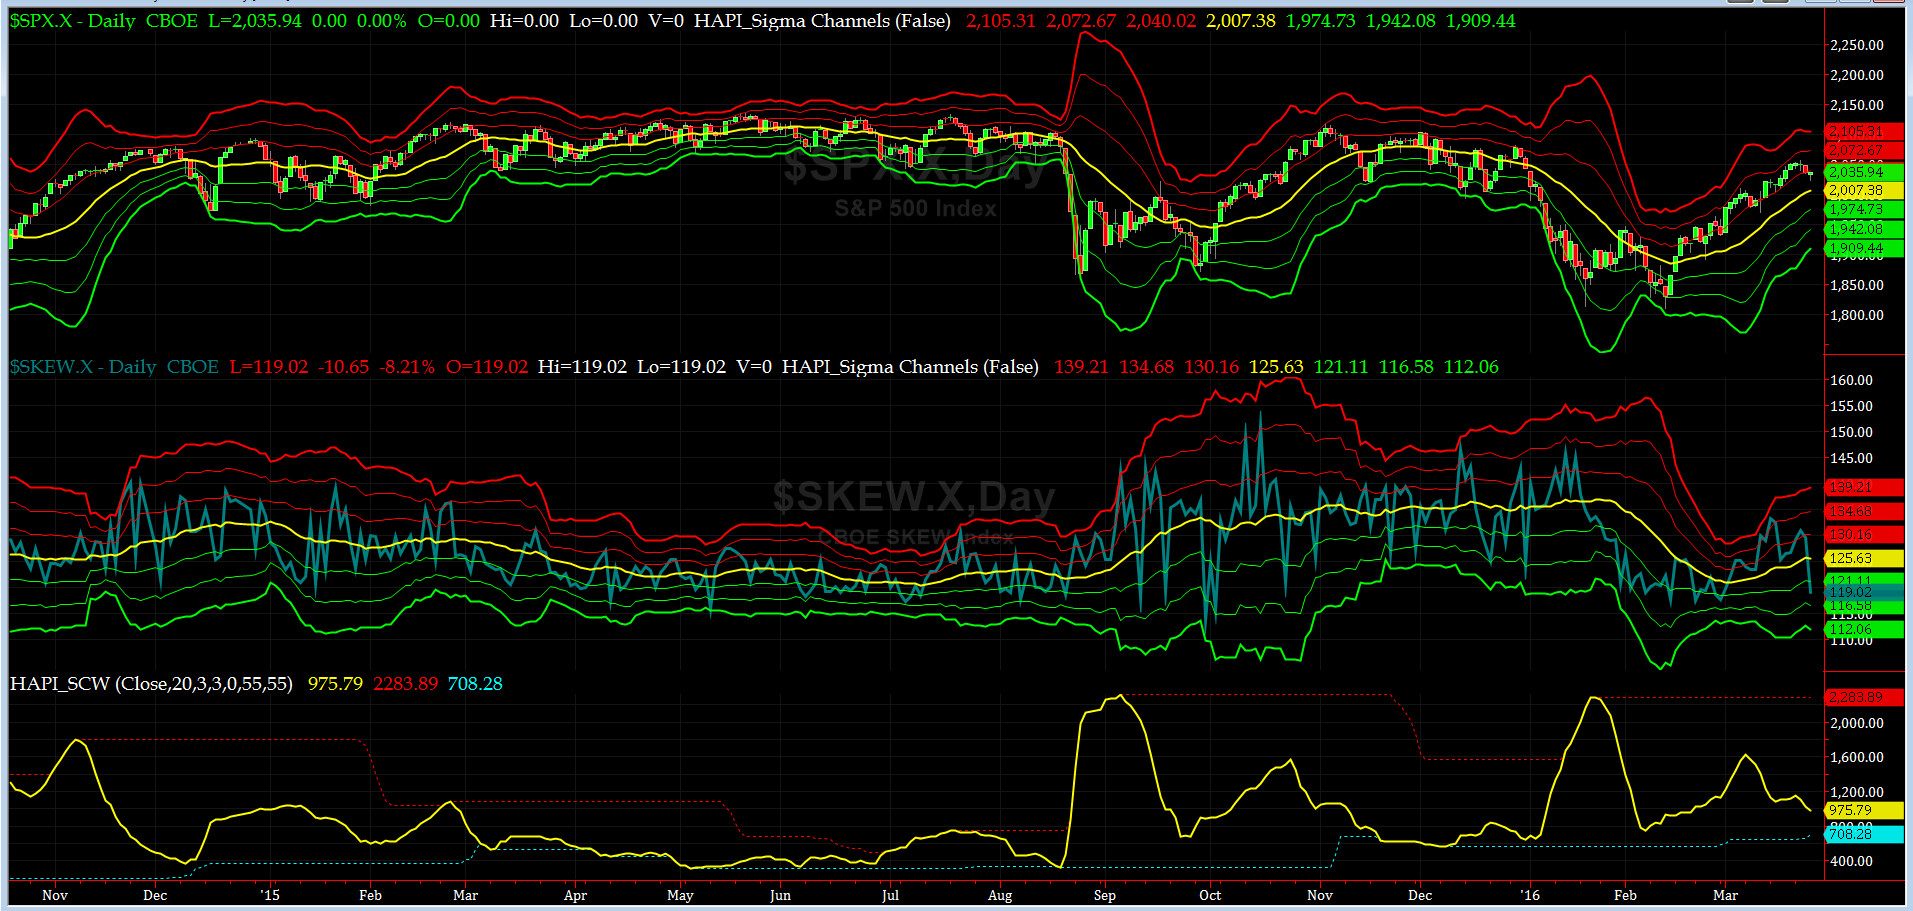
SPX SKEW (Tail Risk) Chart
SPX SKEW (Tail Risk) = 119 and about its -1.5 sigma (normal = 120-125, range 100-150)
All Quiet on the Mid-Western Front? Yes for NOW. And, oh btw, my co-pilot, @Capt_Tiko, these days is taking more notes (and having less Foumanat Tea). LOL.
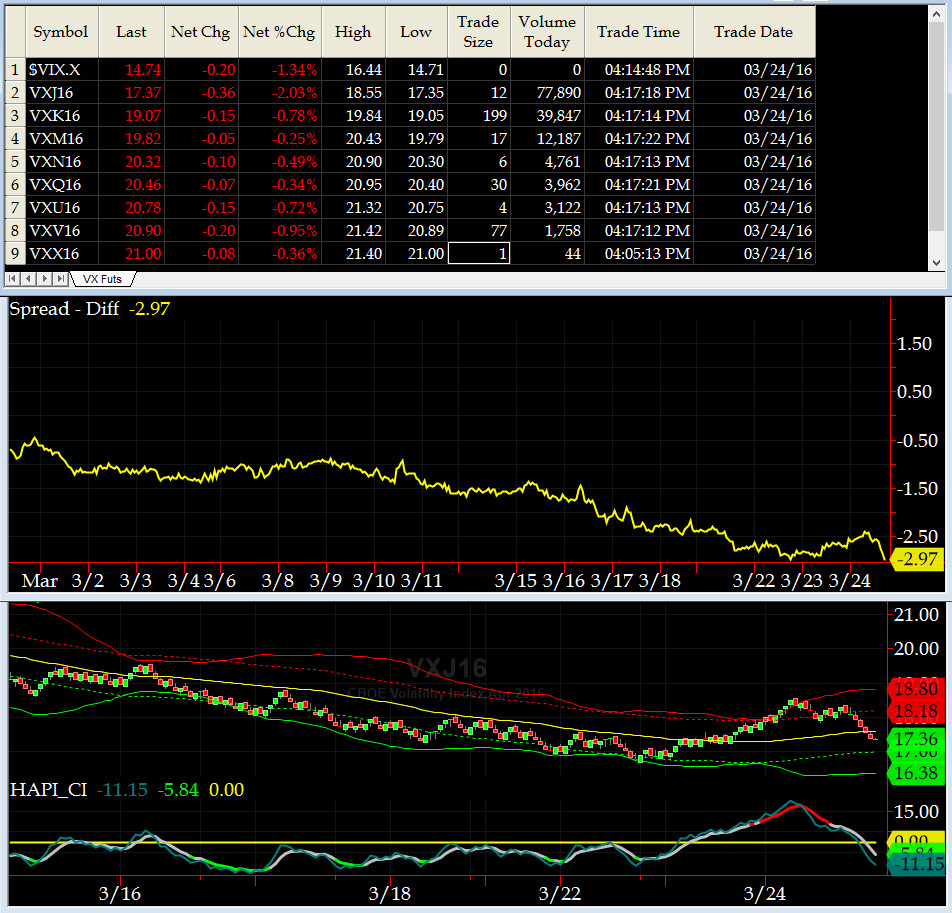
3-month VIX Futures Spread(VX) Chart
Now, our 3-month VIX Futures Spread (LONG APR16 & SHORT JUL16), closed Friday at about -3. This reading says SPX is heading into some resistance shortly. Stay Alert, sailor.
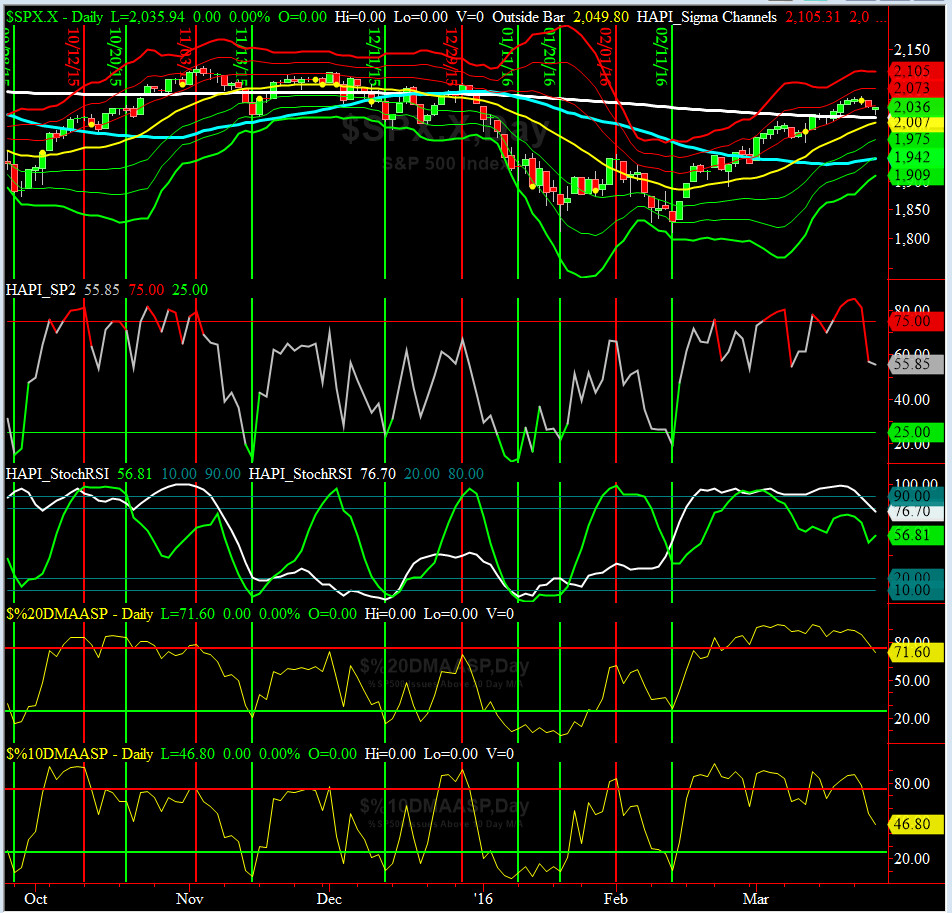
HA_SP2 Chart
HA_SP2 = 55.8(Buy signal <= 25, Sell Signal >= 75)
At ~56, this prop indicator is back to NEUTRAL again.
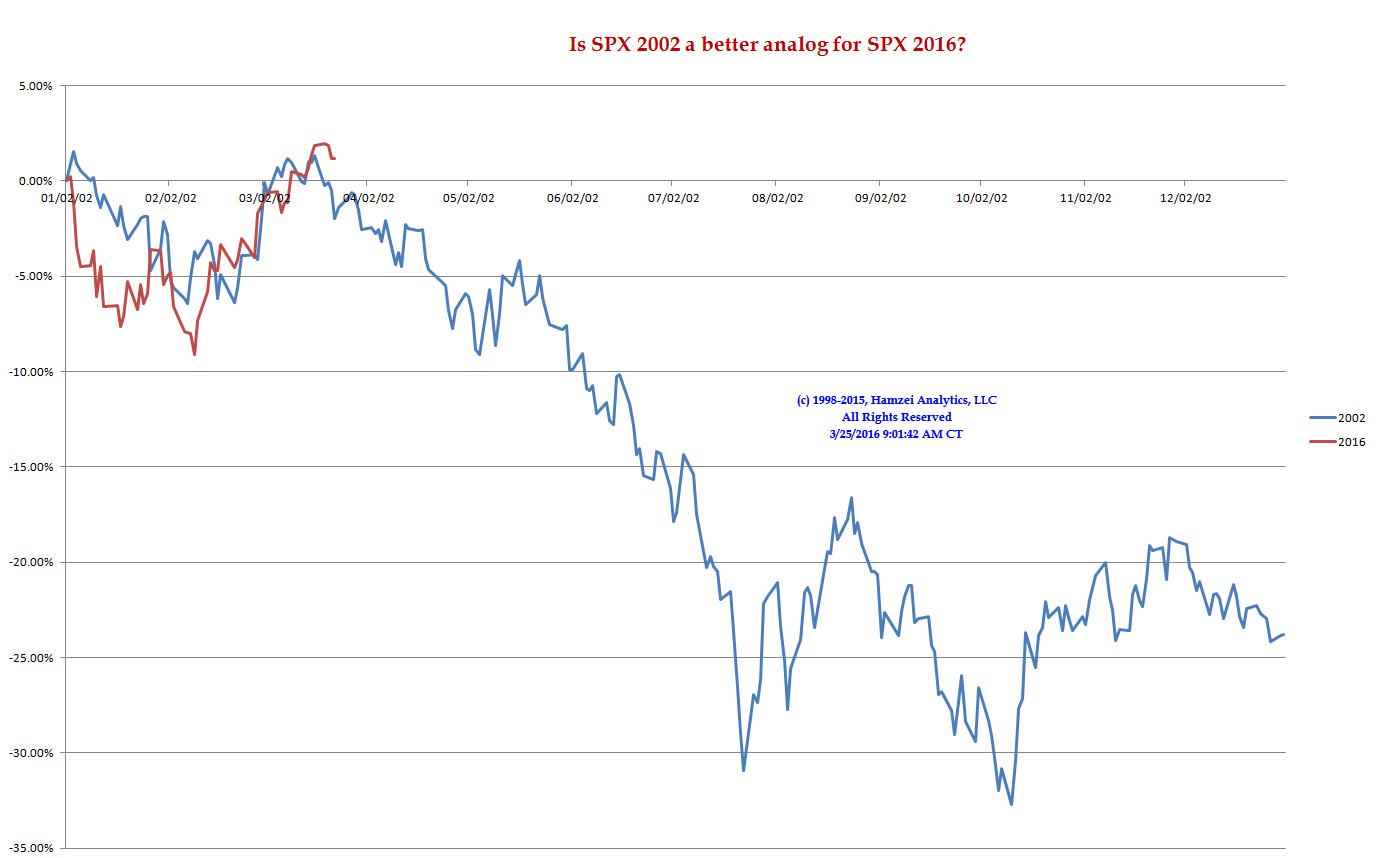
SPX 2002 Analog for SPX 2016
My co-pilot, @Capt_Tiko, is his 3rd week of watching SPX 2002 Analog price action (if he is NOT taking a nap -- this kid is from Chicago & lives for his union breaks...LOL).
Are we going to turn down? Most likely after we hit a new SPX ATH at 2135. The question, as always, becomes what is the catalyst? stay tuned sailor......
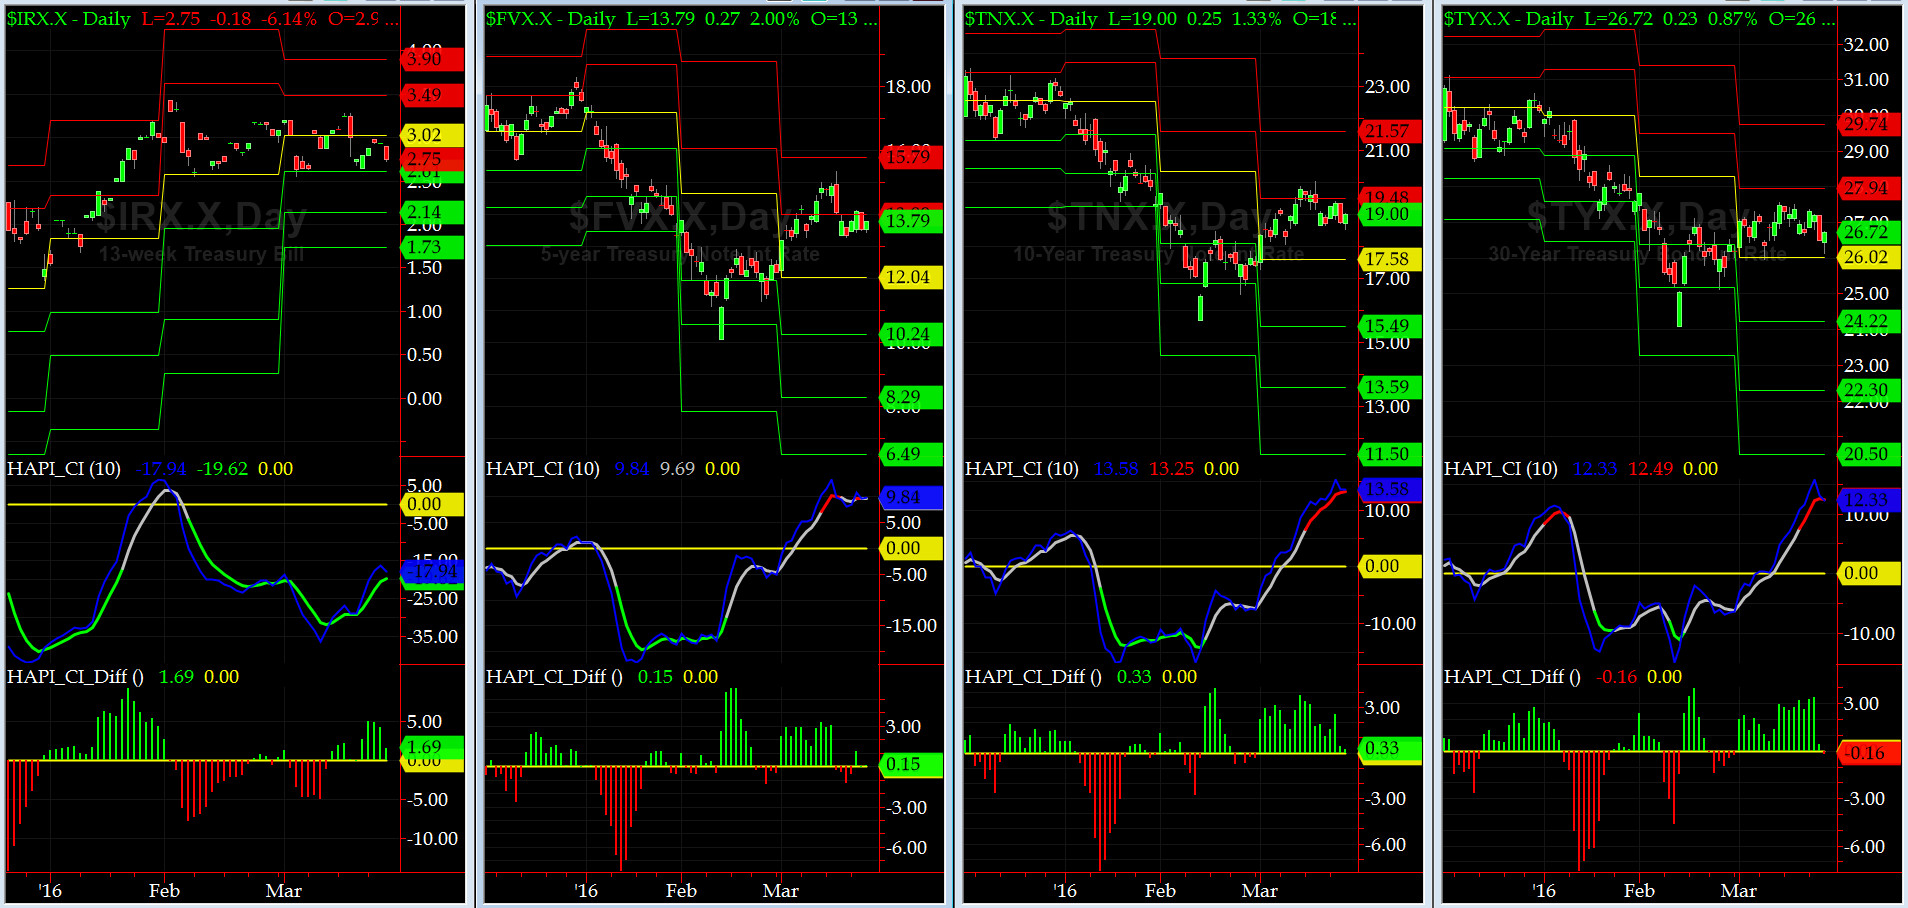
US Treasury T-Notes & T-Bonds Yields Chart
US Treasury Yield Curve went side-ways last week as market prepared for the Easter weekend and then the End-of-Quarter window dressing.
Fari Hamzei
|


 Proactive Market Timing


