|
Saturday, April 9, 2016 1445ET
Market Timing Charts, Analysis & Commentary for Issue #138
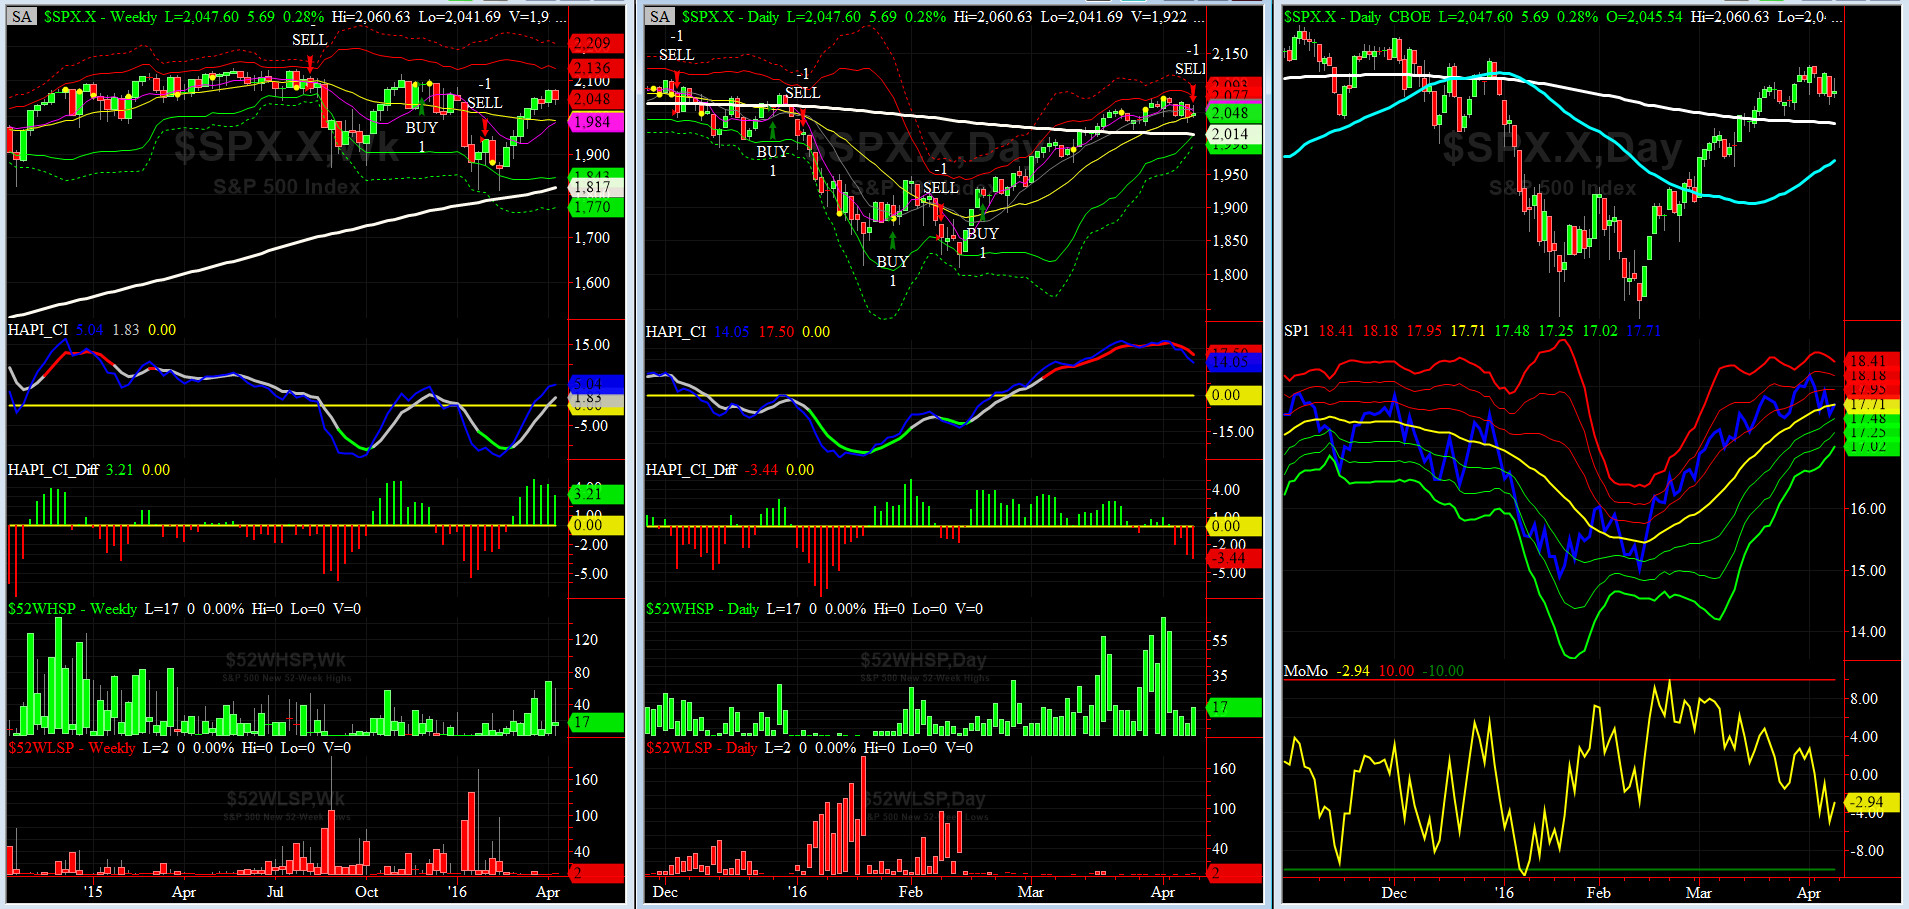
Timer Charts of S&P-500 Cash Index (SPX) + NASDAQ-100 Cash Index (NDX)
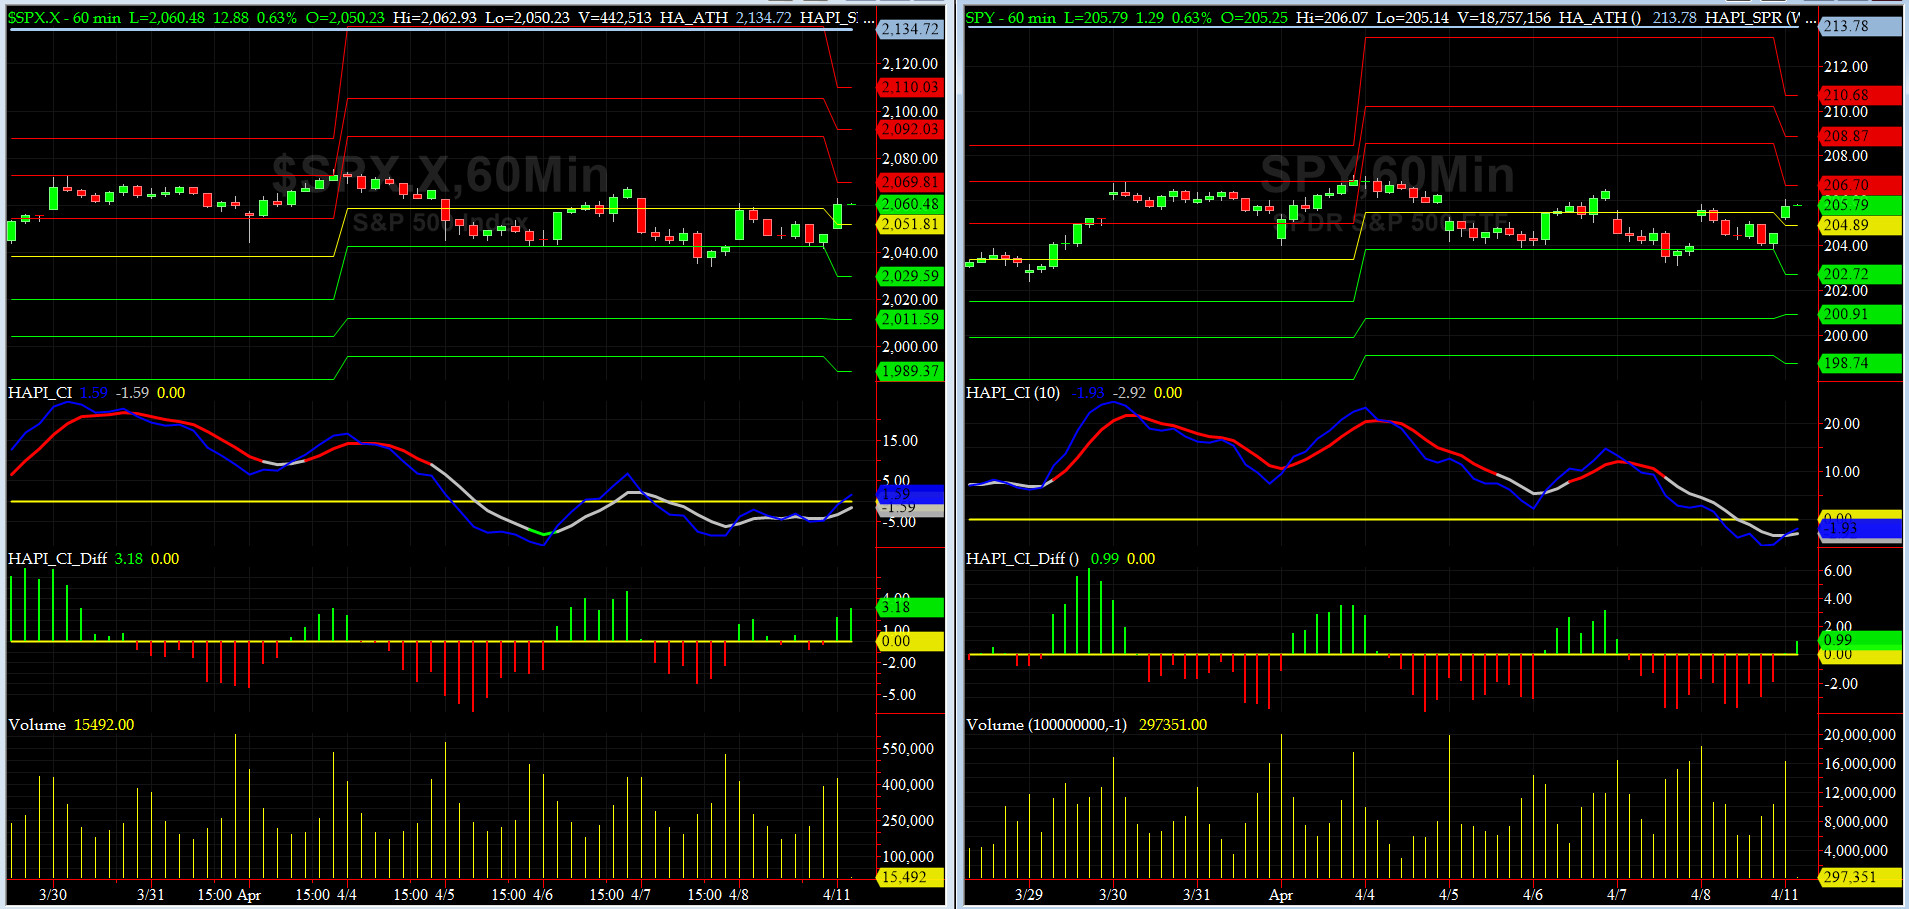
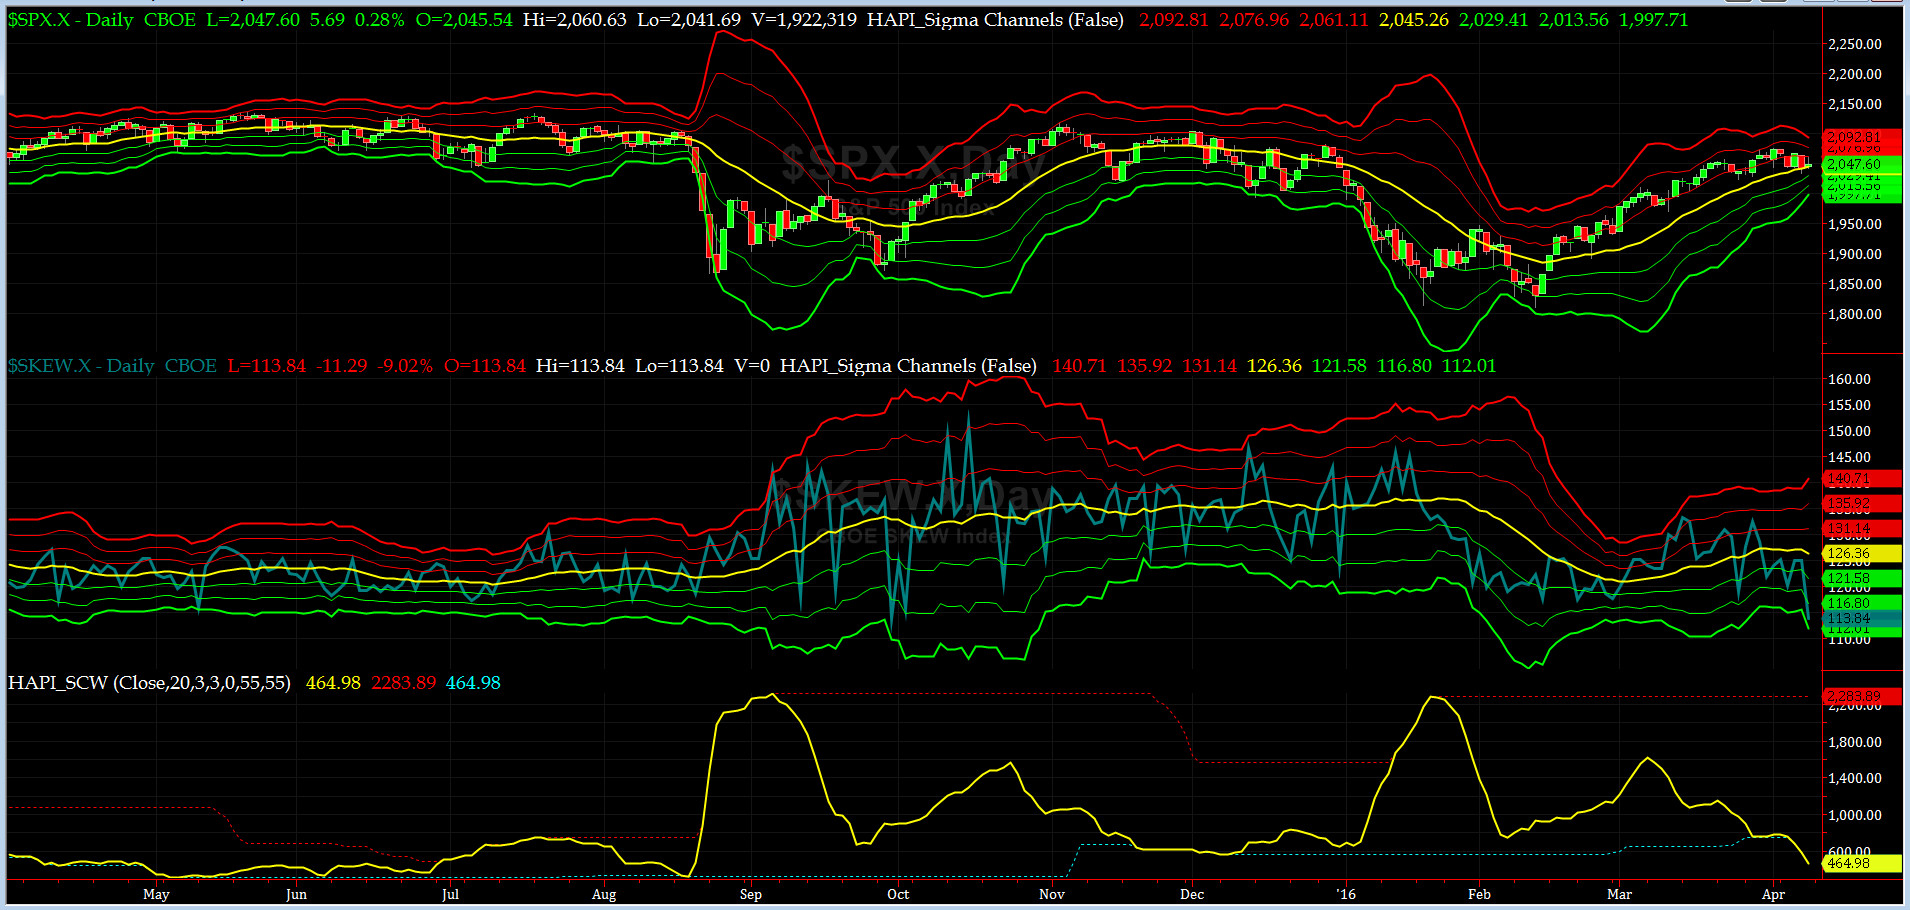
Most recent S&P-500 Cash Index (SPX): 2047.60 down -25.18 (down 1.2%) for the week ending on Friday, April 8th, 2016, which closed about near its zero sigma.
SPX ALL TIME INTRADAY HIGH = 2134.72 (reached on Wednesday, May 20th, 2015)
SPX ALL TIME CLOSING HIGH = 2130.82 (reached on Thursday, May 21st, 2015)
Current DAILY +2 Sigma SPX = 2077 with WEEKLY +2 Sigma = 2142
Current DAILY 0 Sigma (20 day MA) SPX = 2045 with WEEKLY 0 Sigma = 1992
Current DAILY -2 Sigma SPX = 2014 with WEEKLY -2 Sigma = 1841
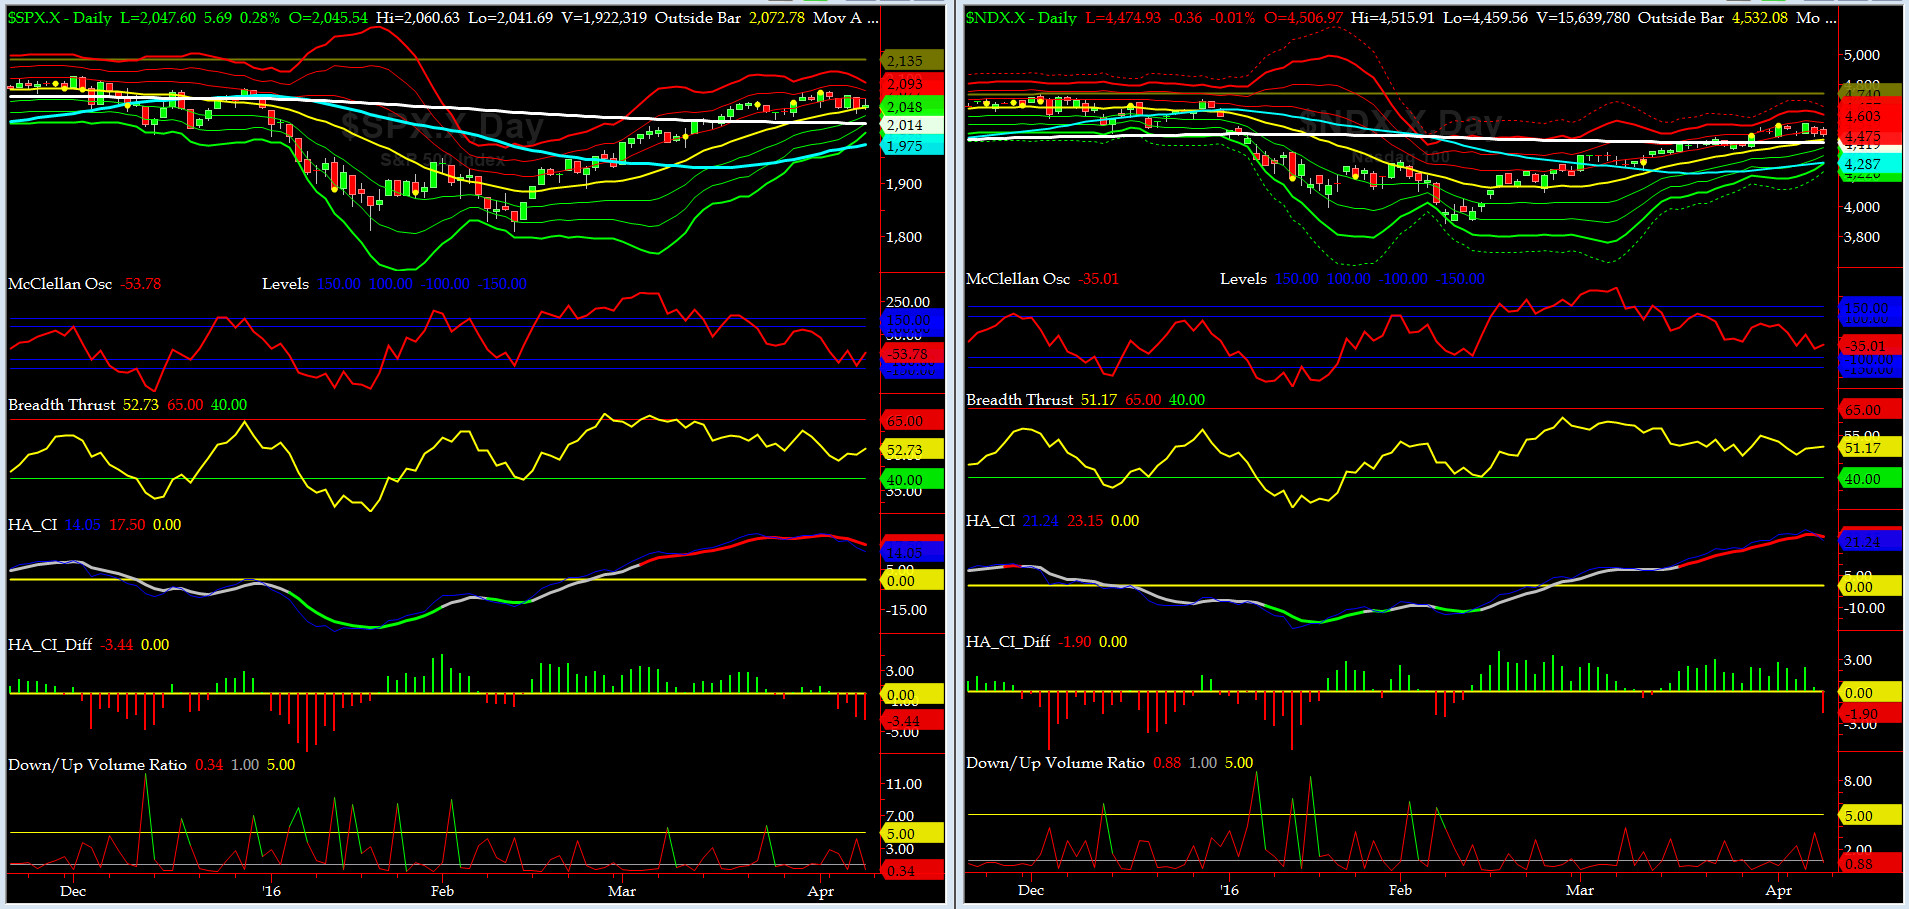
NYSE McClellan Oscillator = -54 (-150 is start of the O/S area; around -275 to -300 area or lower, we go into the �launch-pad� mode, over +150, we are in O/B area)
NYSE Breadth Thrust = 52.73 (40 is considered as oversold and 65 as overbought)
On Friday, after a sizable gap-up in crude, the big boys sold voraciously almost every name during RTH. Now SPX is sitting at 0 sigma with vols collapsing. This won't stand for long. There is a talk of market participants worrying about the Q1 Earnings Season, which will start with AA reporting Monday in after hours.
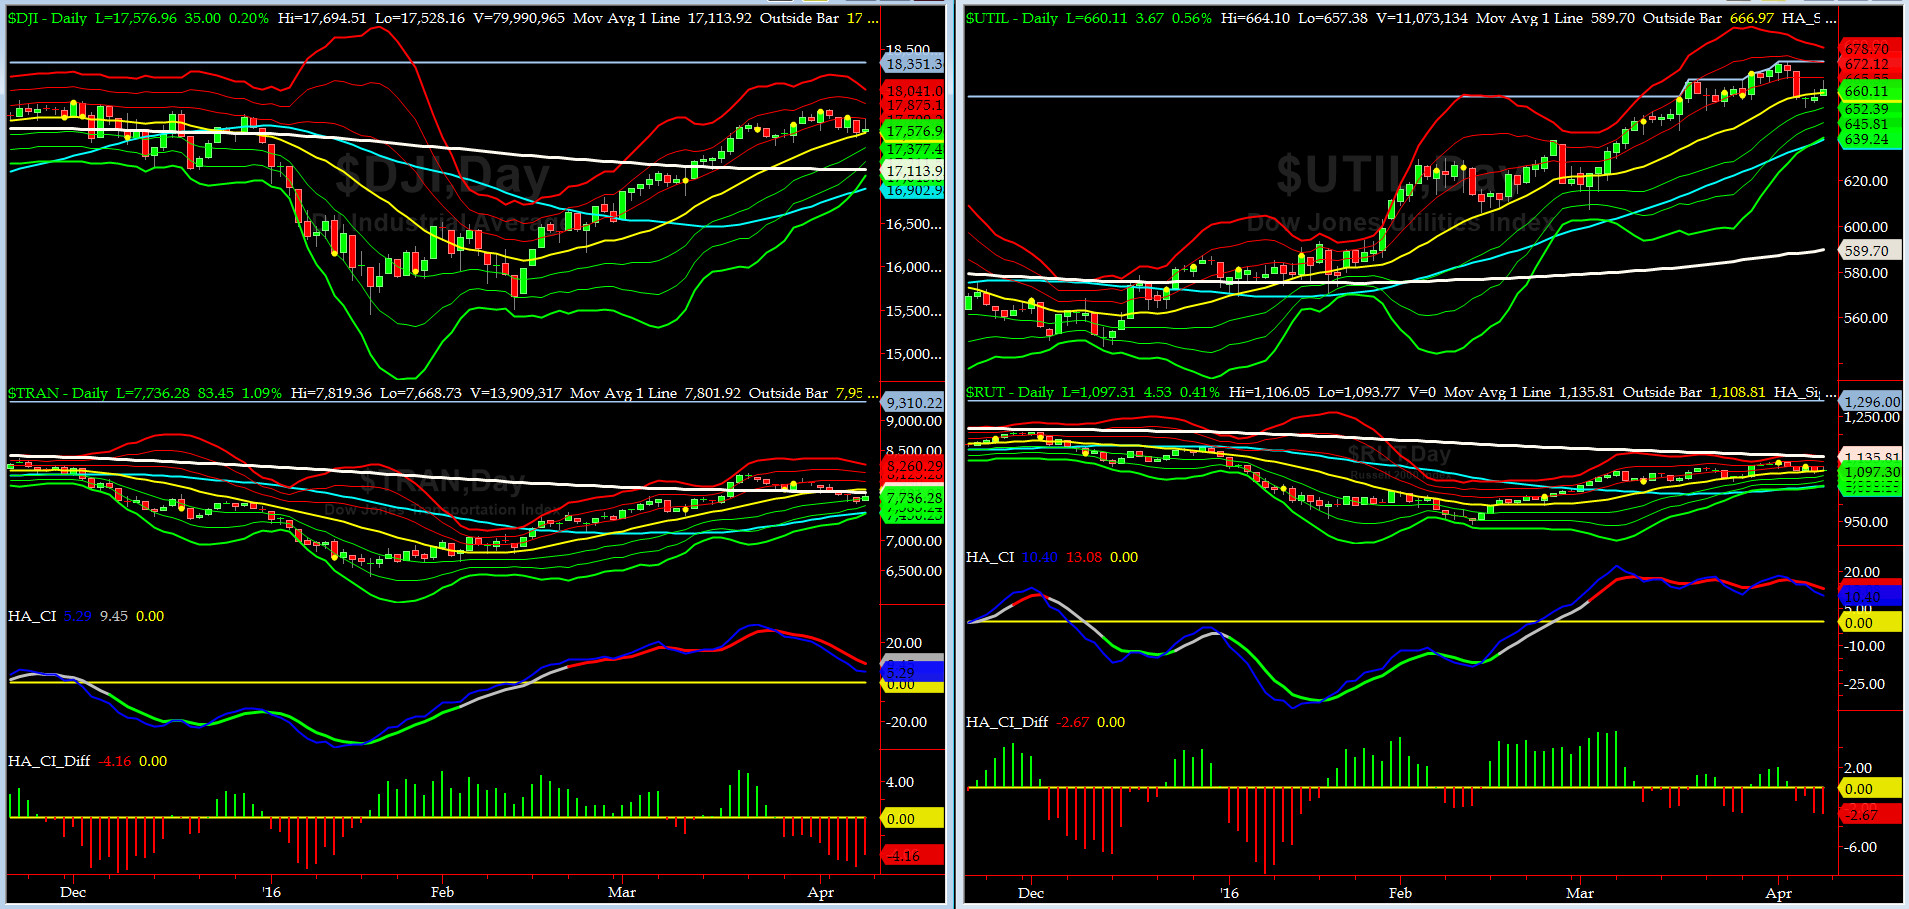
Canaries [in the Coal Mine] Chart for DJ TRAN & RUT Indices
200-Day MA DJ TRAN = 7802 or 0.8% above DJ TRAN (max observed in last 5 yrs = 20.2%, min = -20.3%)
200-Day MA RUT = 1136 or 3.4% above RUT (max observed in last 5 yrs = 21.3%, min = -22.6%)
DJ Transports (proxy for economic conditions 6 to 9 months hence), as discussed here for warranting a closer watch, dropped below its 200 day MA and now it is at its -1 sigma. While, in the past, we have gone up in SPX with DJ TRAN trading downward, it is normally a bad omen for SPX. We shall continue to keep a close watch on this very important index.
Russell 2000 Small Caps (proxy for RISK ON/OFF) is now only up 4.4% over its 50day MA & RISK is heading sideways to down.
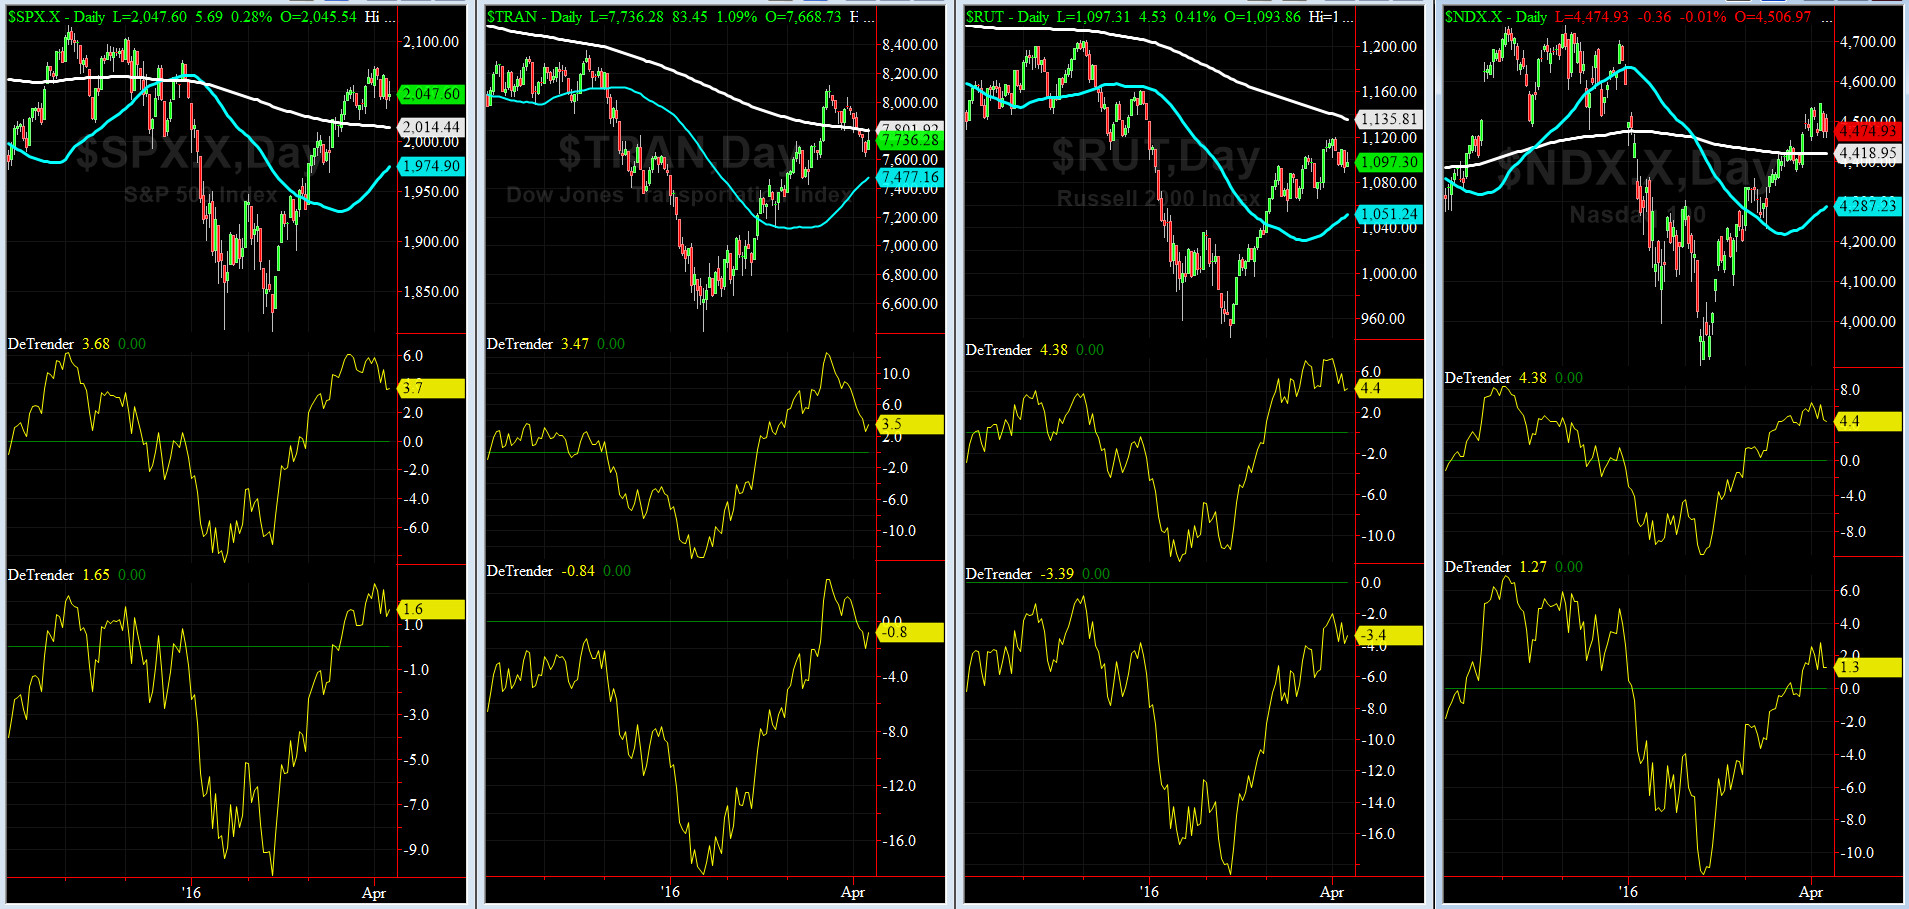
DeTrenders Charts for SPX, NDX, TRAN & RUT Indices
50-Day MA SPX = 1975 or +3.7% below SPX (max observed in last 5 yrs = +8.6%, min = -9.3%)
200-Day MA SPX = 2014 or +1.6% below SPX (max observed in last 5 yrs = 15.2%, min = -14%)
Only TWO of our Eight DeTrenders are negative now (DJ TRAN & RUT 200DTs).
HA_SP1_momo Chart
WEEKLY Timing Model = on a SELL Signal since Friday 1/29/16 CLOSE
DAILY Timing Model = on a SELL Signal since Friday 4/8/16 CLOSE
Max SPX 52wk-highs reading last week = 60 (over 120-140, the local maxima is in)
Max SPX 52wk-Lows reading last week = 2 (over 40-60, the local minima is in)
HA_SP1 = finally broke its zero sigma this week
HA_Momo = -2.9 (reversals most likely occur above +10 or below -10)
NOTE: Looks like the developing divergences between our HA_momo and HA_SP1 that we have discussed here, may start to work itself into a mild (?) retracement.
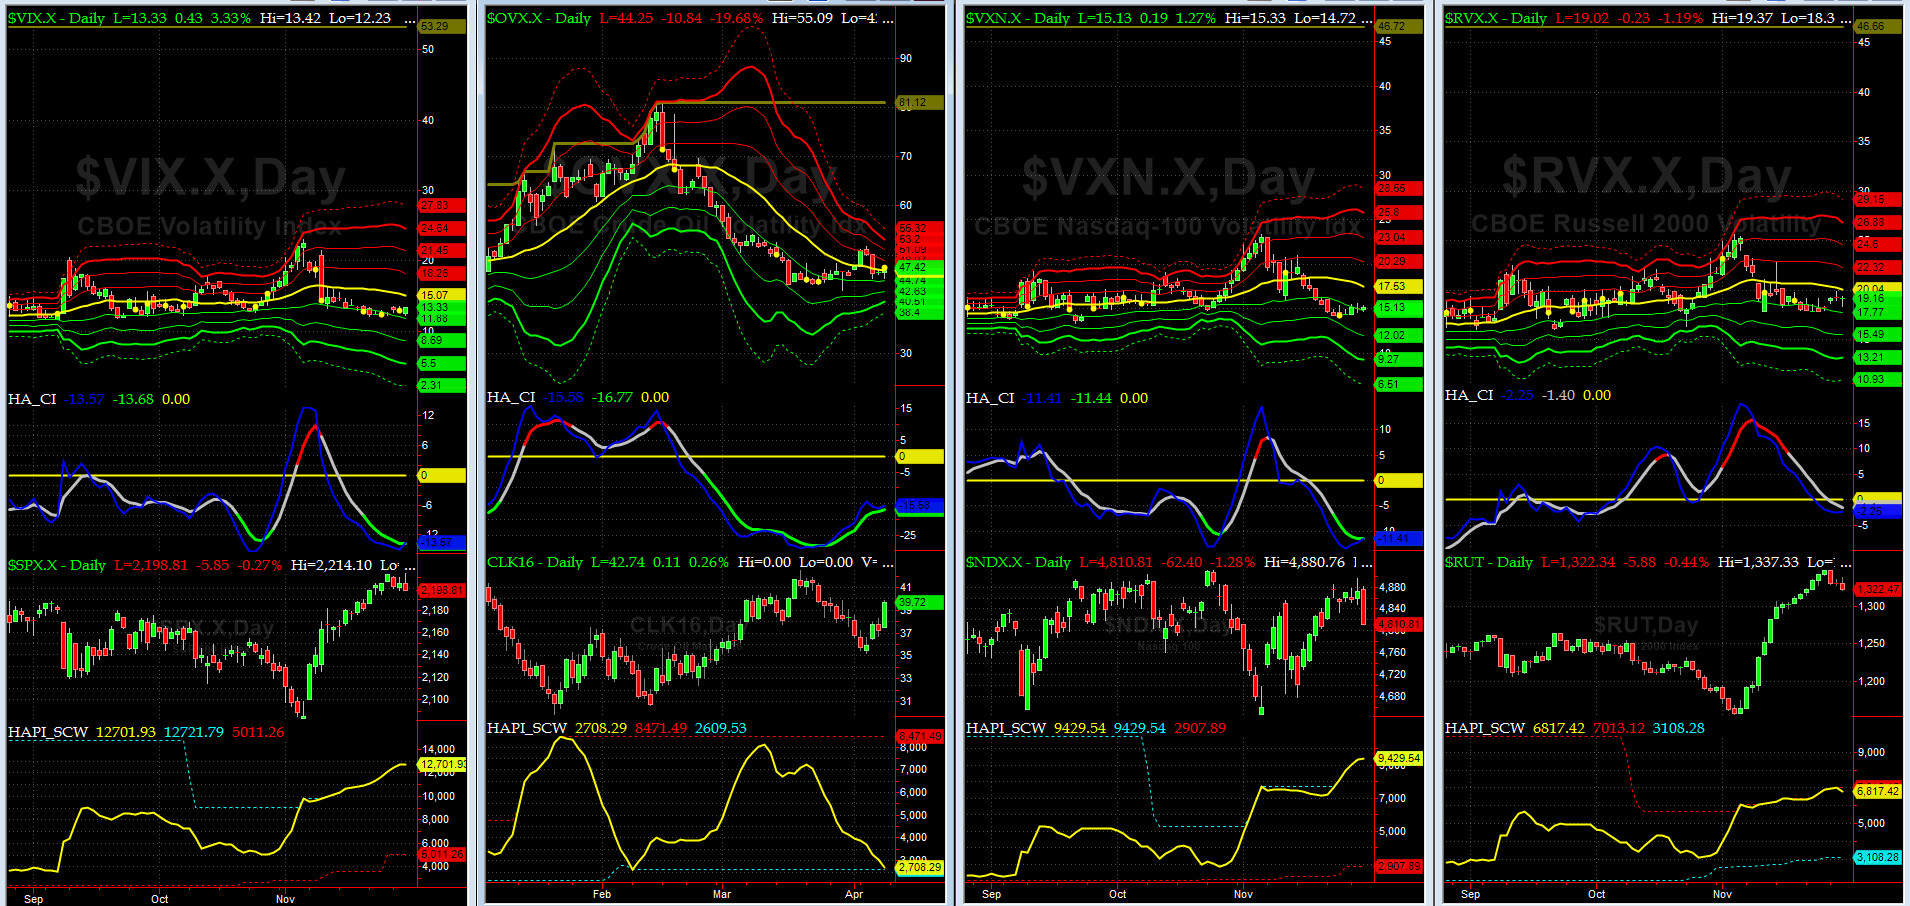
Vol of the Vols Chart
VIX = 15.4 is now at its zero sigma (remember it�s the VIX�s vol pattern (its sigma channels) that matters, and not the level of VIX itself (this is per Dr. Robert Whaley, a great mentor and the inventor of original VIX, now called VXO. VIX usually peaks around a test of its +4 sigma).
We were dead wrong re VIX Funeral. Look at its DAILY CI CROSS. Free Soup for All Da Bears.
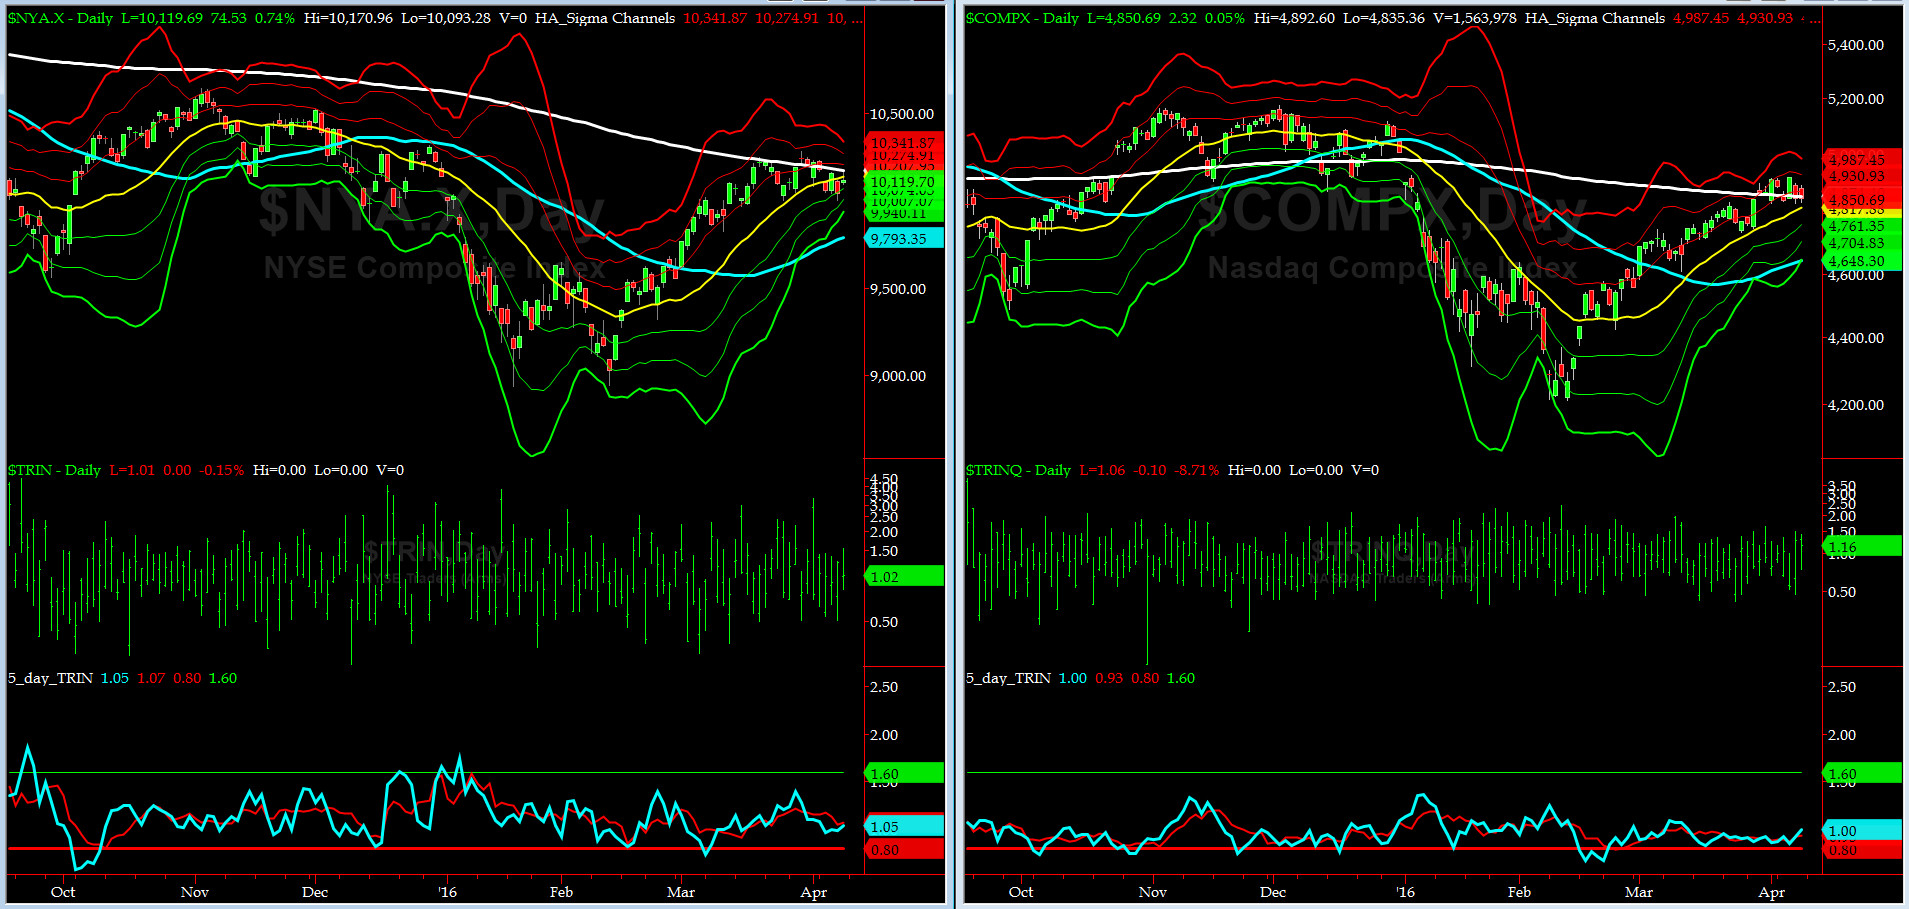
5-day TRIN & TRINQ Charts
The 5-day TRIN (for NYSE) is still showing a NEUTRAL reading here but the 5-day TRINQ (for NASDAQ) is rising from a near a SELL signal to a NEUTRAL reading.
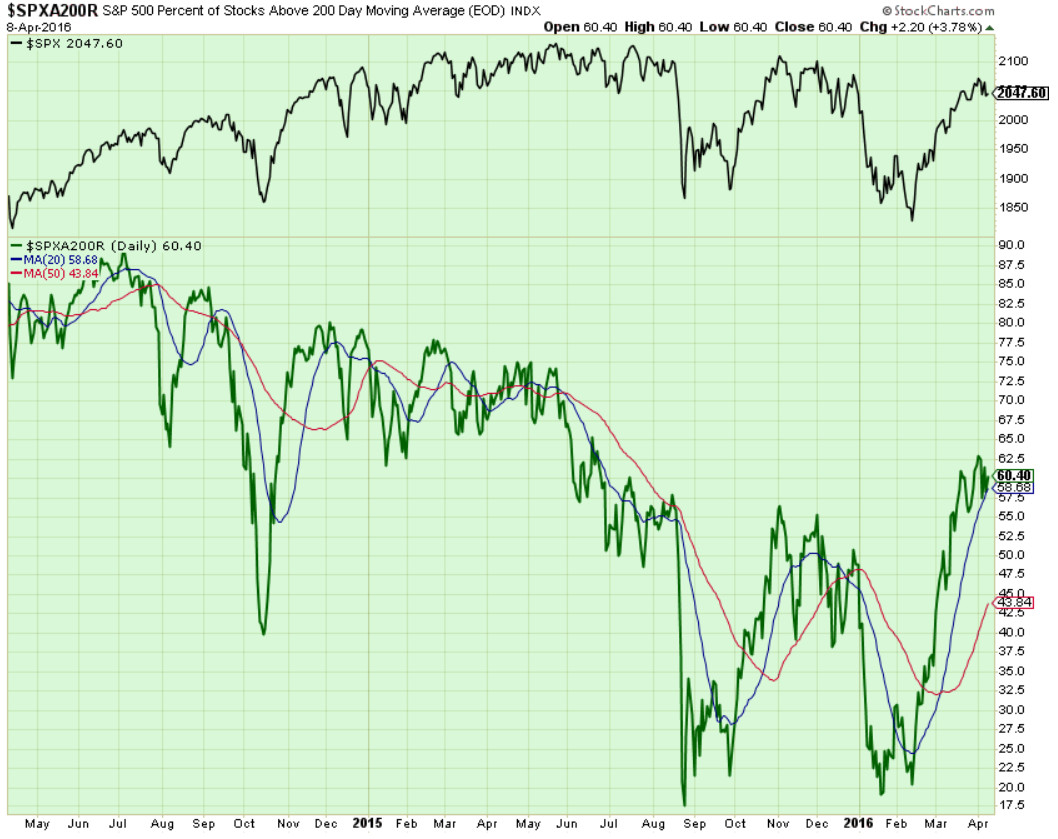
Components of SPX above their respective 200day MA Chart
This past week, this scoring indicator never got past 63%, and now it's about to break its 20 day MA at 58%. Next target is the 55% - 45% zone.
SPX SKEW (Tail Risk) Chart
SPX SKEW (Tail Risk) = 114 and near its -3 sigma (normal = 120-125, range 100-150)
All Quiet on the Mid-Western Front? Yes, but most likely, that will be temporary, ioho. This reminds us of SKEW action in early Sept last year.
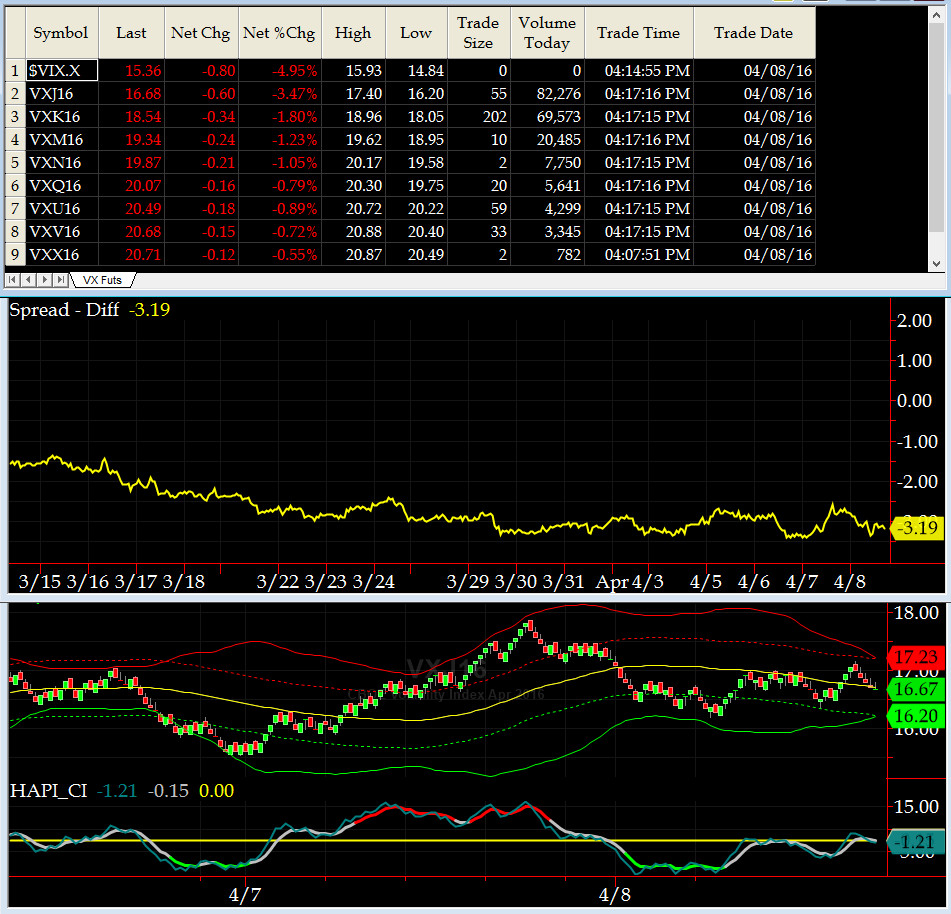
3-month VIX Futures Spread(VX) Chart
Our 3-month VIX Futures Spread (LONG APR16 & SHORT JUL16) closed Friday at about -3.2. This reading is a warning sign for resistance in SPX.
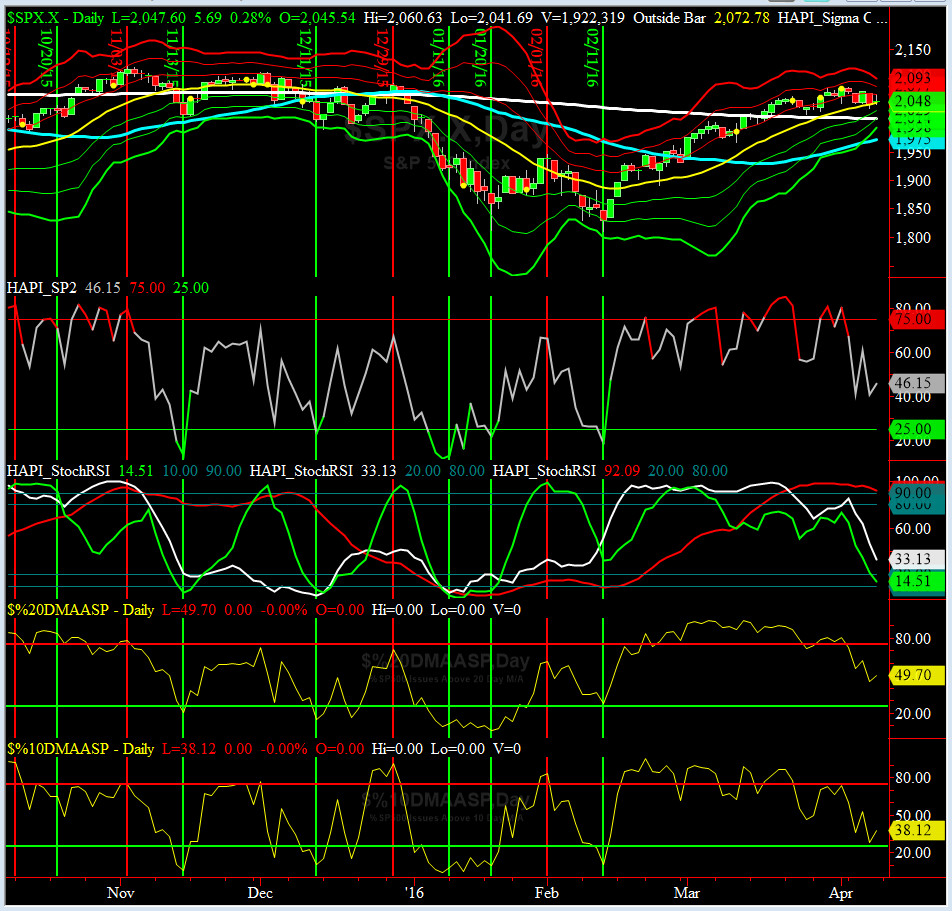
HA_SP2 Chart
HA_SP2 = 46.1 (Buy signal <= 25, Sell Signal >= 75)
At ~46, this prop indicator is back to NEUTRAL zone.
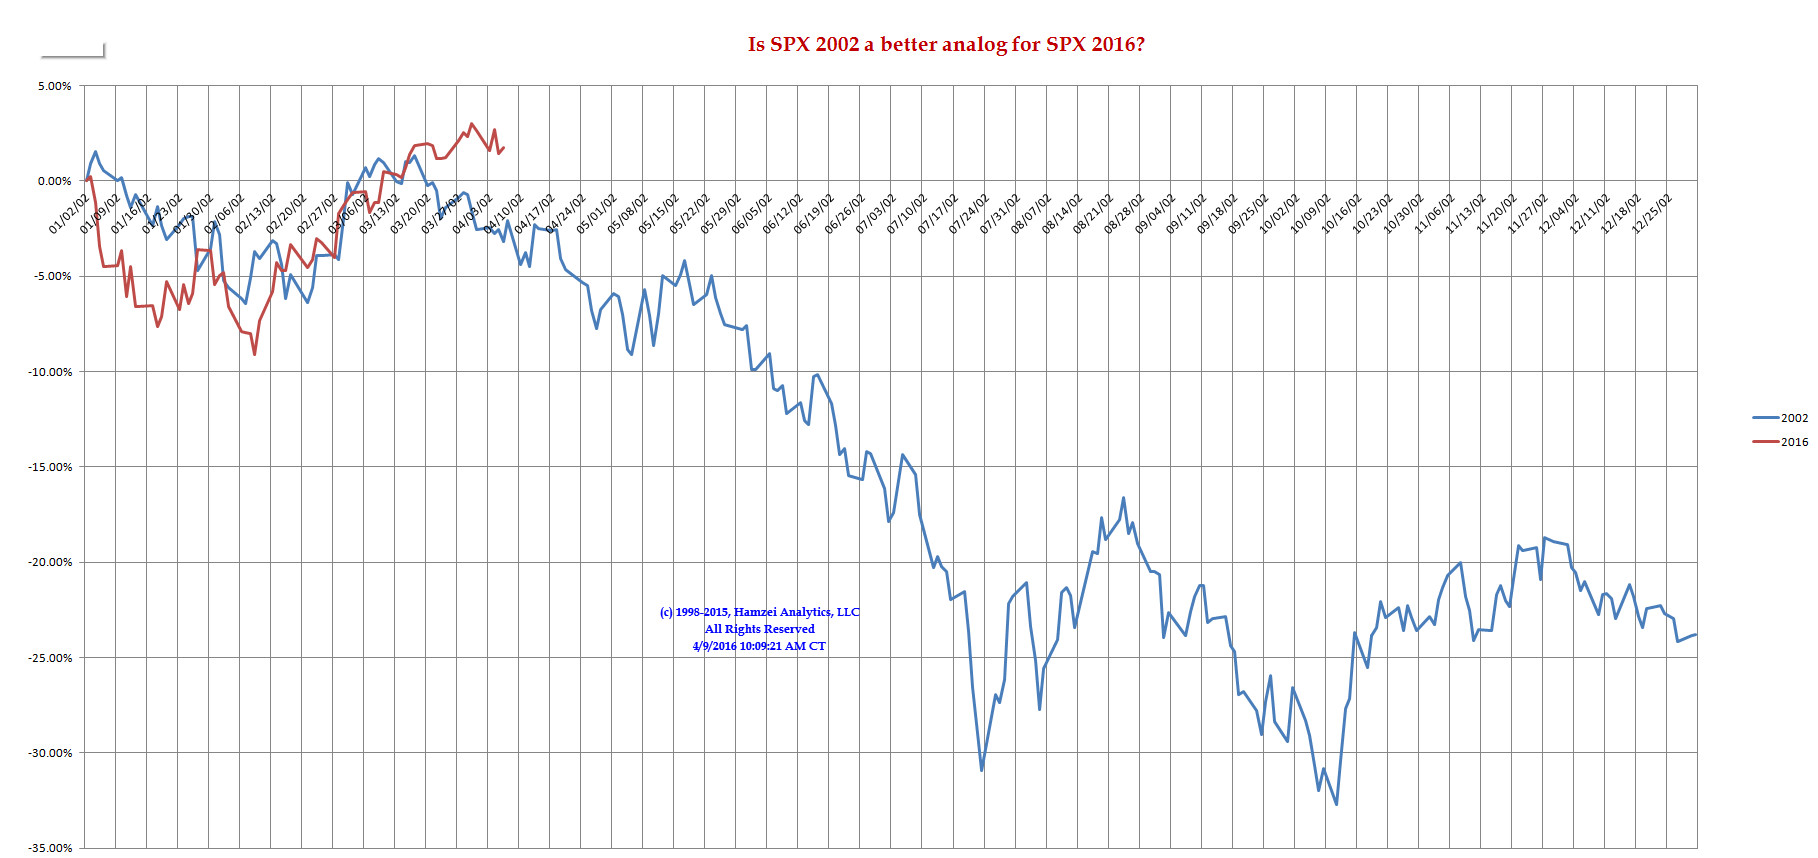
SPX 2002 Analog for SPX 2016
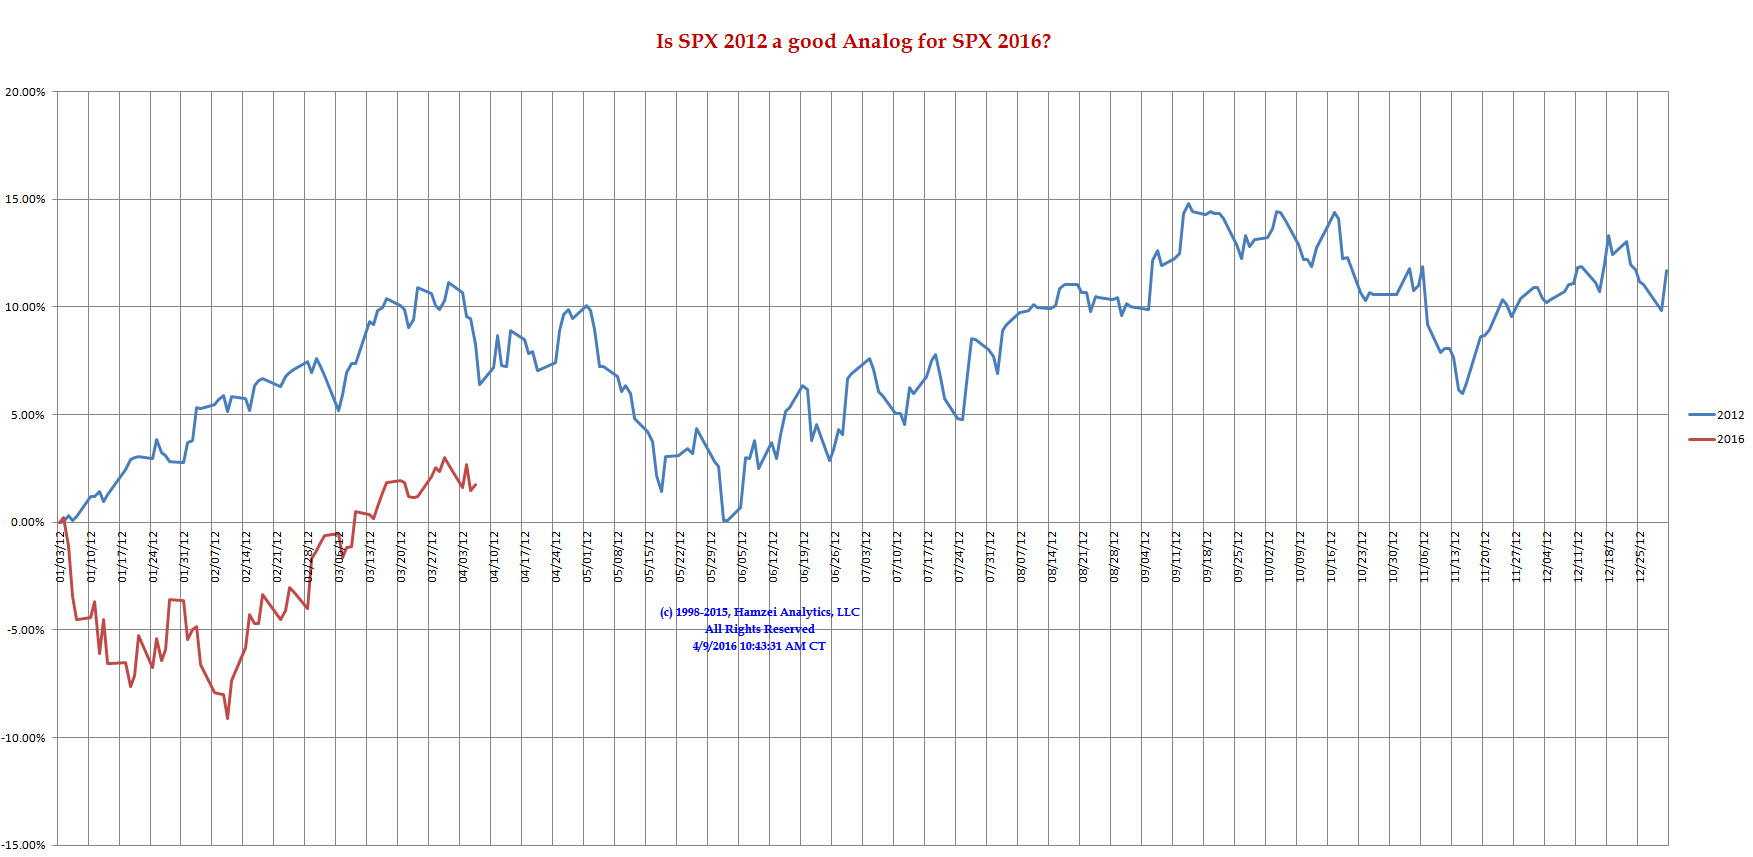
SPX 2012 Analog for SPX 2016
We are back to watching 2002 + 2012 Analog Charts again. Keep in mind, early in the year, one has to follow many analogs.
Is SPX going to turn down? We now think so. The issue is for how long and how far. What is the catalyst? Crude [& DJ TRAN] price action(s), US Elections, Global Terrorism & worry about Q1 2016 Earnings Reports......
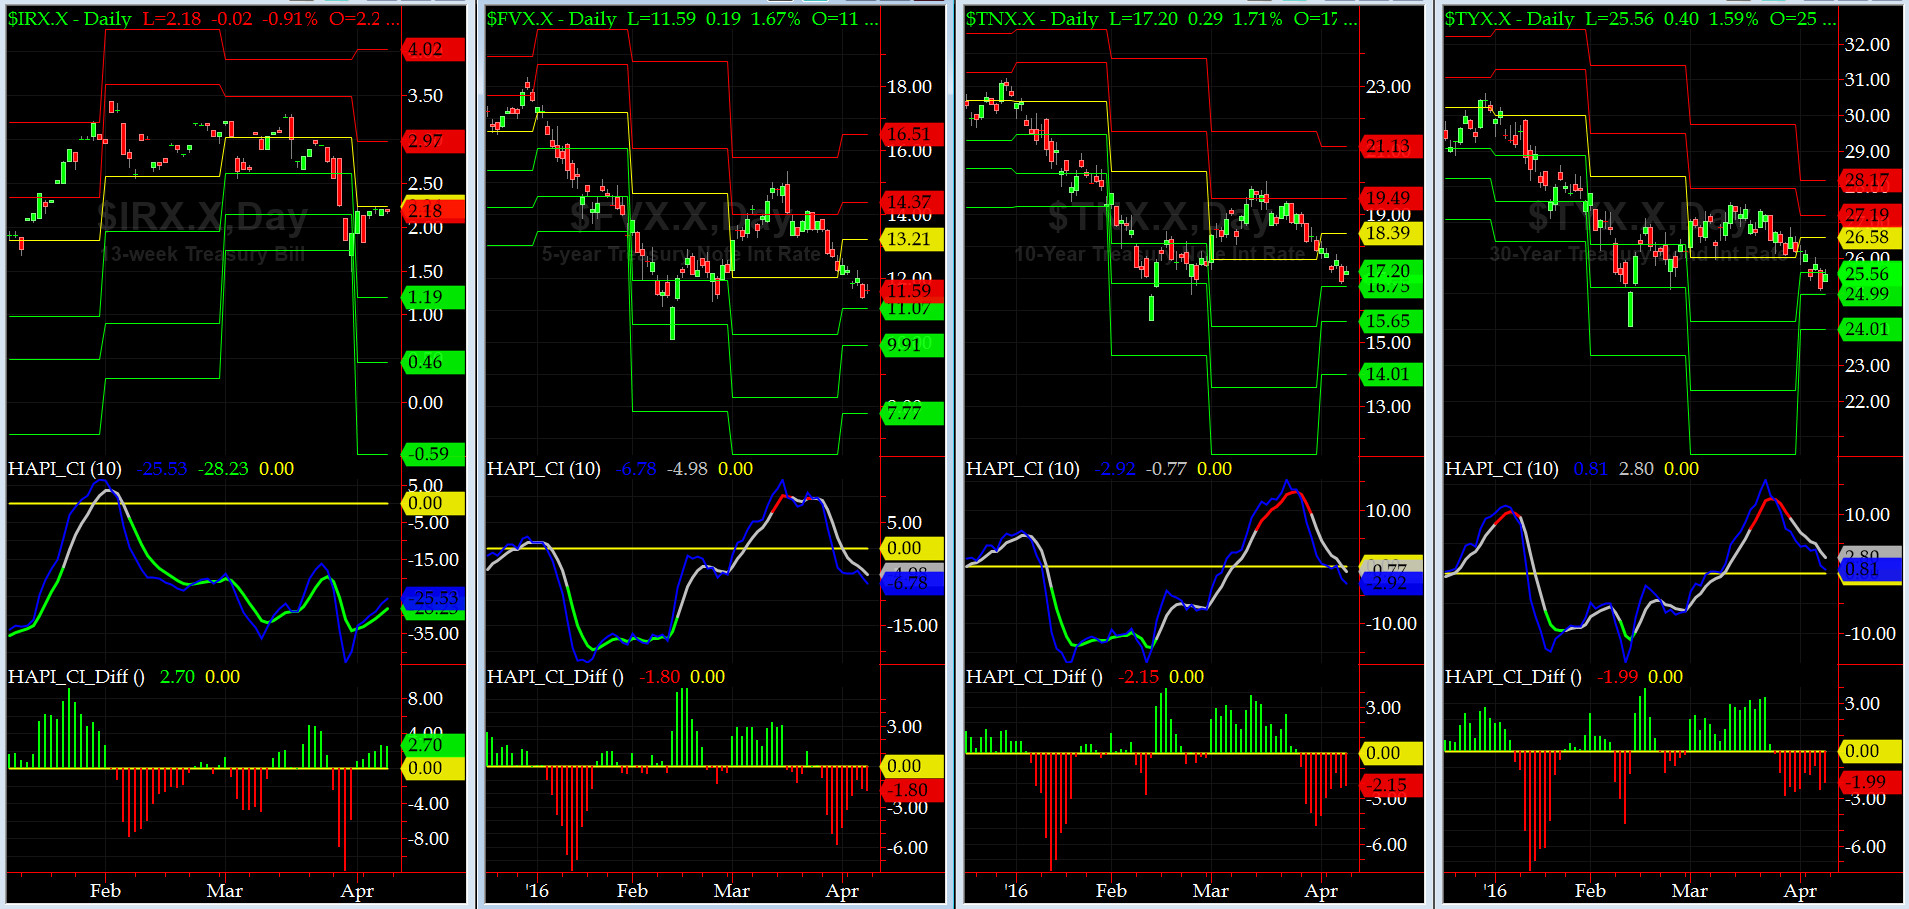
US Treasury T-Notes & T-Bonds Yields Chart
US Treasury Yield Curve again continued to retreat this past week nearly its MONTHLY Support1 for FIVE and TEN Year Notes and SUPPORT 2 for THIRTY Year Bonds. Ioho, Equity Players are getting a tad more defensive.
Fari Hamzei
|


 Proactive Market Timing