|
Sunday, April 16, 2016 2200ET
Market Timing Charts, Analysis & Commentary for Issue #139
Timer Charts of S&P-500 Cash Index (SPX) + NASDAQ-100 Cash Index (NDX)
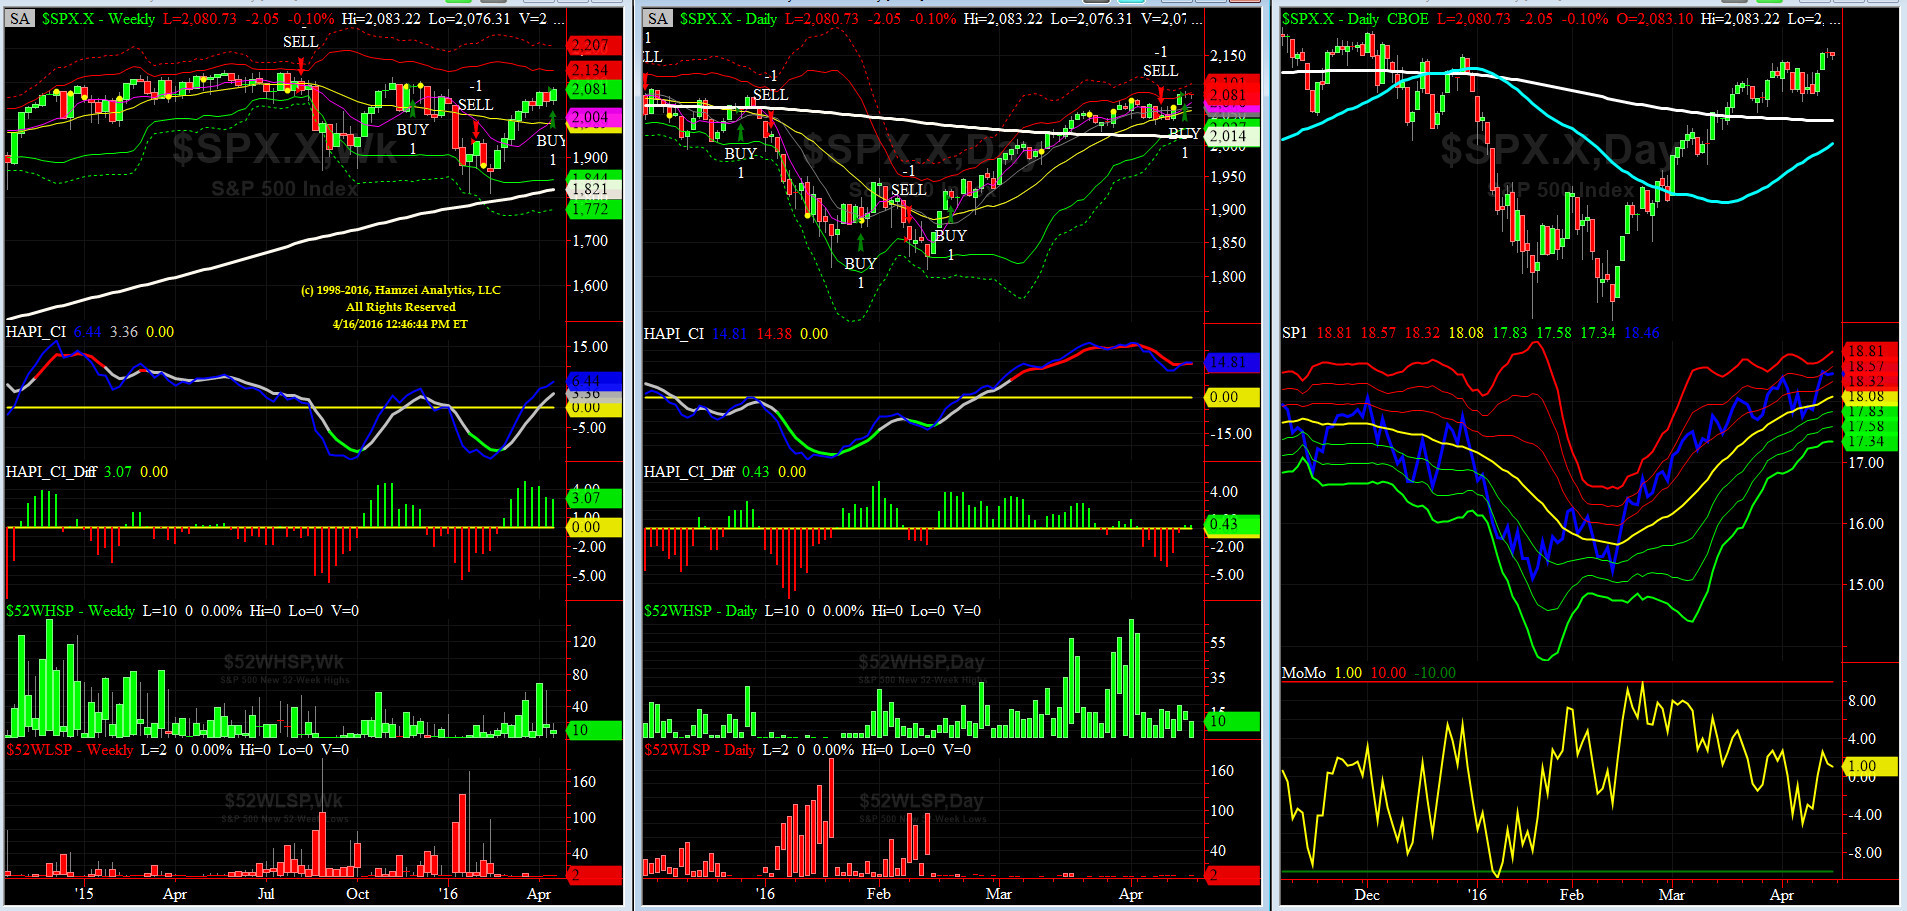
Most recent S&P-500 Cash Index (SPX): 2080.73 up +33.13 (up 1.6%) for the week ending on Thursday, April 15th, 2016, which closed about near its +2 sigma.
SPX ALL TIME INTRADAY HIGH = 2134.72 (reached on Wednesday, May 20th, 2015)
SPX ALL TIME CLOSING HIGH = 2130.82 (reached on Thursday, May 21st, 2015)
Current DAILY +2 Sigma SPX = 2086 with WEEKLY +2 Sigma = 2134
Current DAILY 0 Sigma (20 day MA) SPX = 2056 with WEEKLY 0 Sigma = 1989
Current DAILY -2 Sigma SPX = 2027 with WEEKLY -2 Sigma = 1844
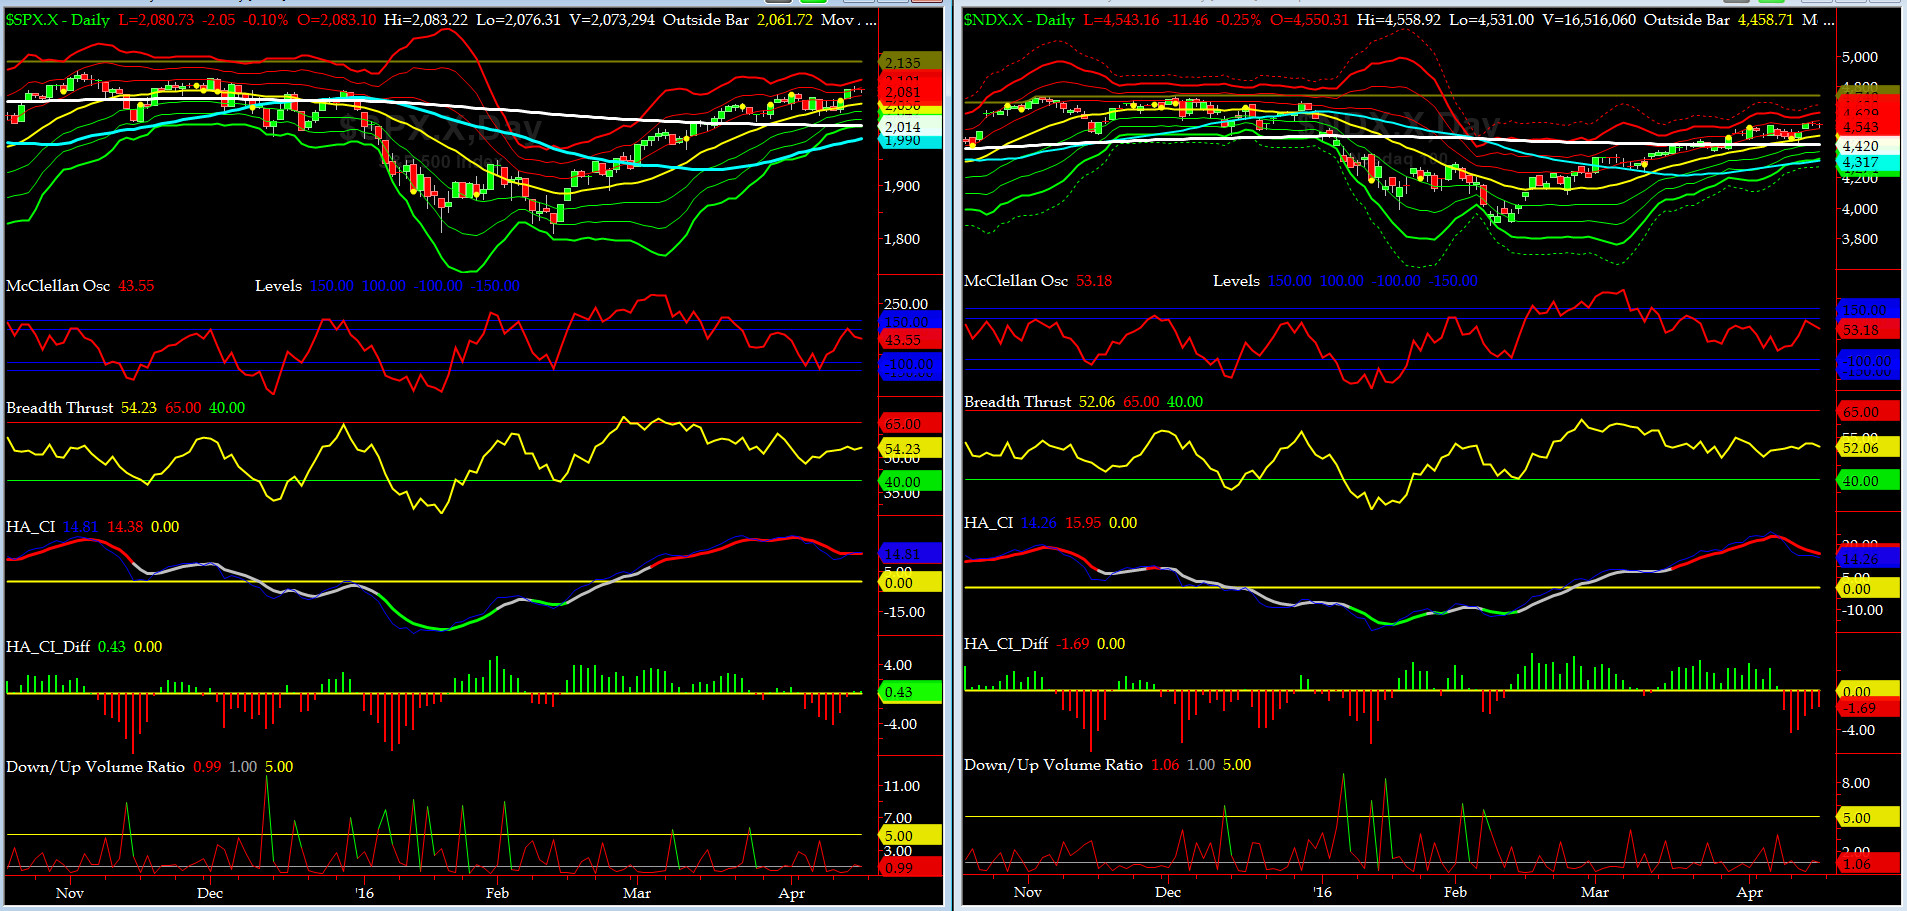
NYSE McClellan Oscillator = +43 (-150 is start of the O/S area; around -275 to -300 area or lower, we go into the �launch-pad� mode, over +150, we are in O/B area)
NYSE Breadth Thrust = 52.2 (40 is considered as oversold and 65 as overbought)
On Wednesday, our beloved Jamie (of "the House of Dimon" fame) hit it out of the ballpark with bases loaded. JPM rallied to +3 sigma. High tide rises all boats including, floating trash (C & BAC). As we move forward into the Q1 Earning Reports, our fav, GOOGL, reports this week and AAPL, next week.
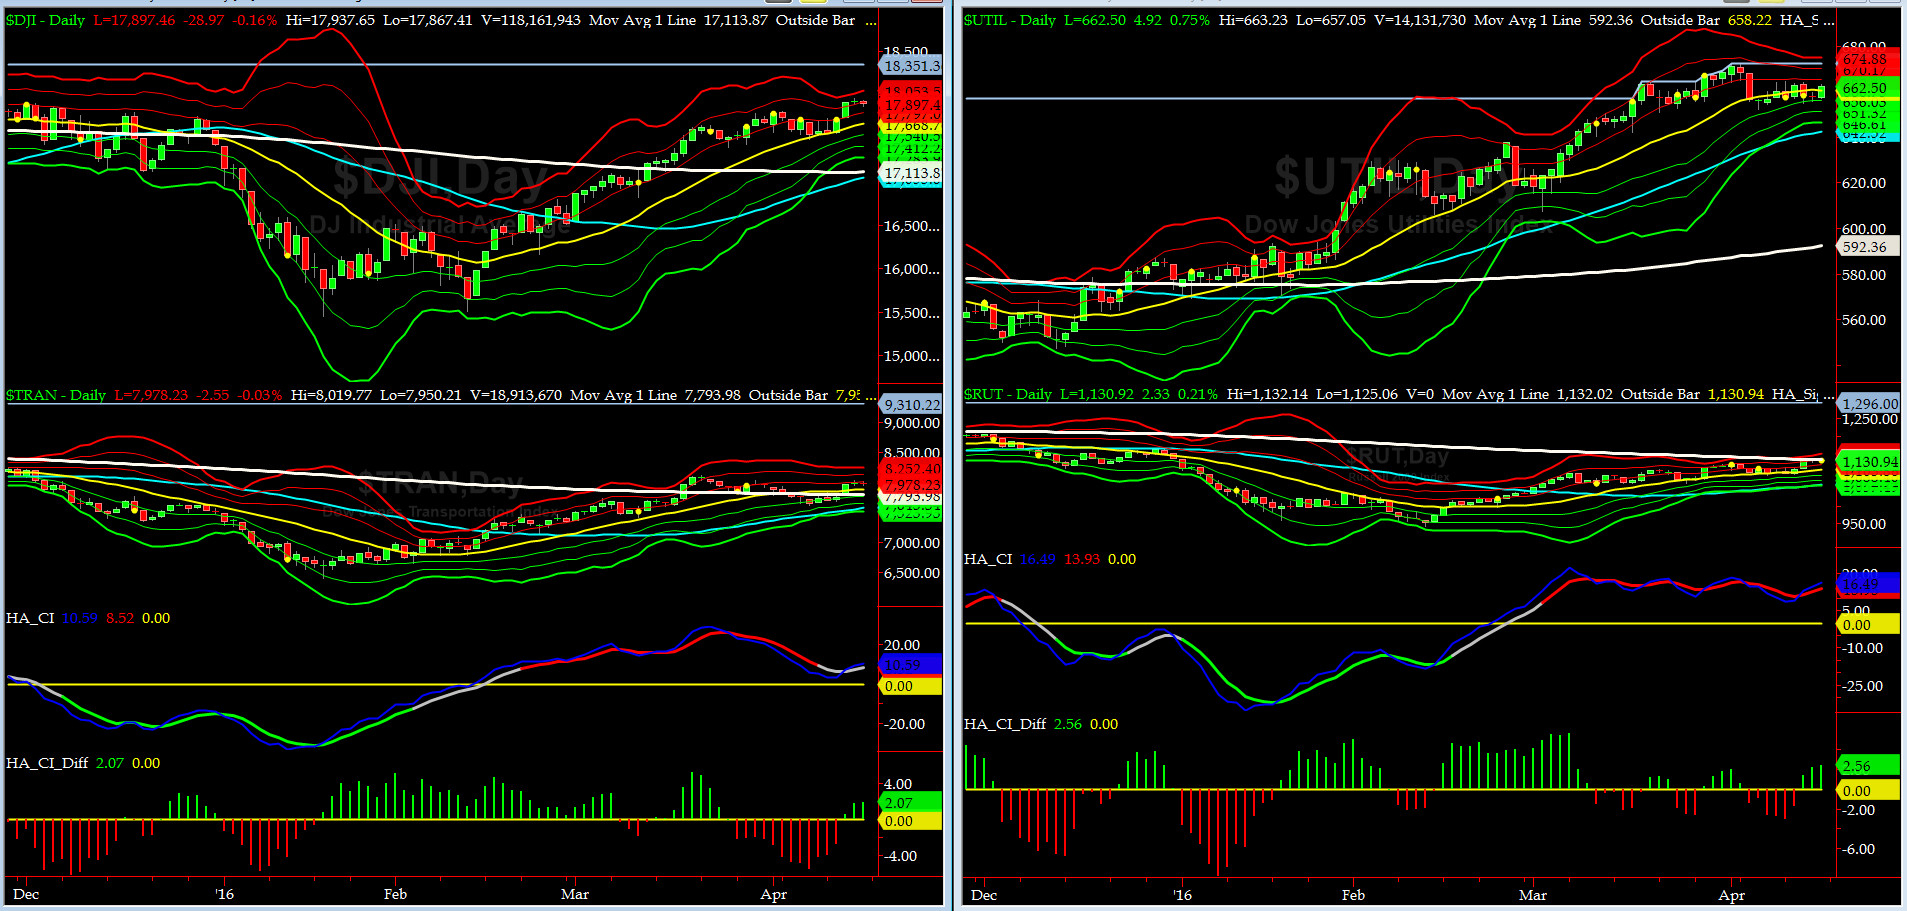
Canaries [in the Coal Mine] Chart for DJ TRAN & RUT Indices
200-Day MA DJ TRAN = 7794 or 2.4% below DJ TRAN (max observed in last 5 yrs = 20.2%, min = -20.3%)
200-Day MA RUT = 1132 or 0.1% above RUT (max observed in last 5 yrs = 21.3%, min = -22.6%)
DJ Transports (proxy for economic conditions 6 to 9 months hence), as discussed here for warranting a closer watch, jumped over its 200 day MA this week and now it is at its +1 sigma. We complained last week that in the past, we have gone up in SPX with DJ TRAN trading downward, and that has been normally a bad omen for SPX. Looks like the Trading Gods over at Houston listened and this week when in synch. Frankly we did not know Trading Gods have a PMT Subscription.
Russell 2000 Small Caps (proxy for RISK ON/OFF) also put in a strong move up, on Wednesday, thanks should go to our dear friend, Jamie Dimon (which also happens to be a Greek warrior).
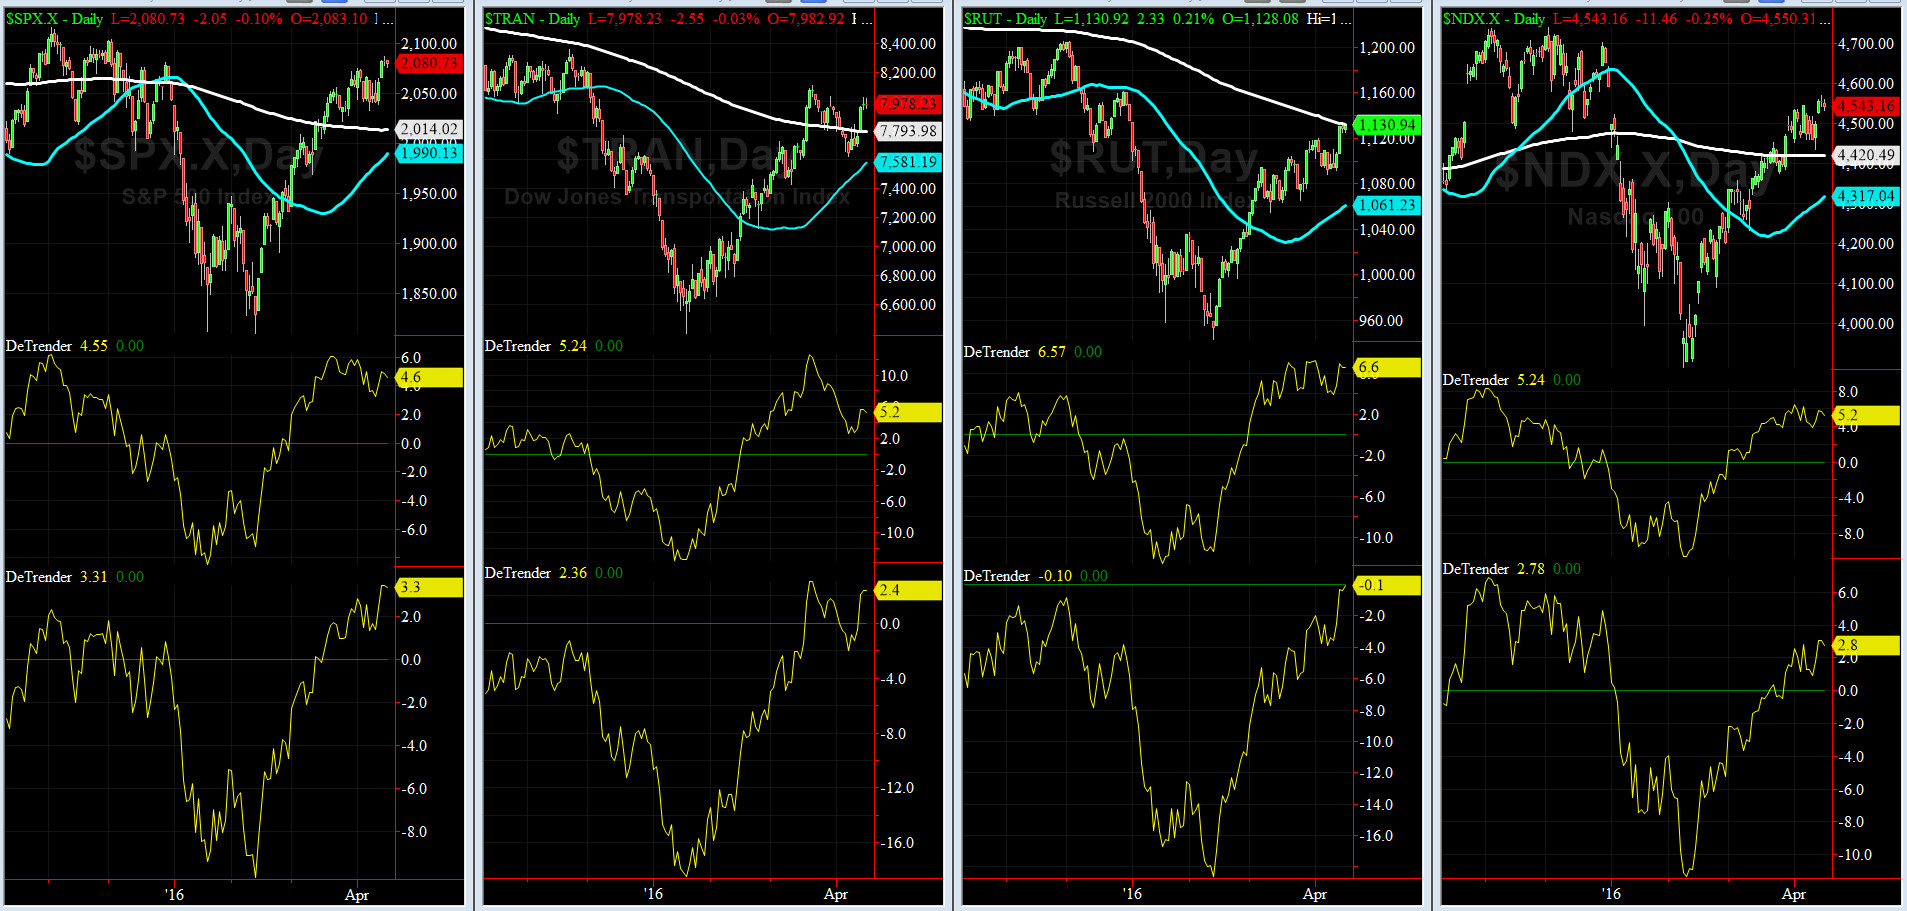
DeTrenders Charts for SPX, NDX, TRAN & RUT Indices
50-Day MA SPX = 1990 or +4.6% below SPX (max observed in last 5 yrs = +8.6%, min = -9.3%)
200-Day MA SPX = 2014 or +3.3% below SPX (max observed in last 5 yrs = 15.2%, min = -14%)
Barely, ONE of our Eight DeTrenders is negative now (RUT 200DTs). Keep in mind, we are seeing some, albeit very soft, bearish divergences between DTs and the prices. Nothing big and too early to be alarmed about for now.
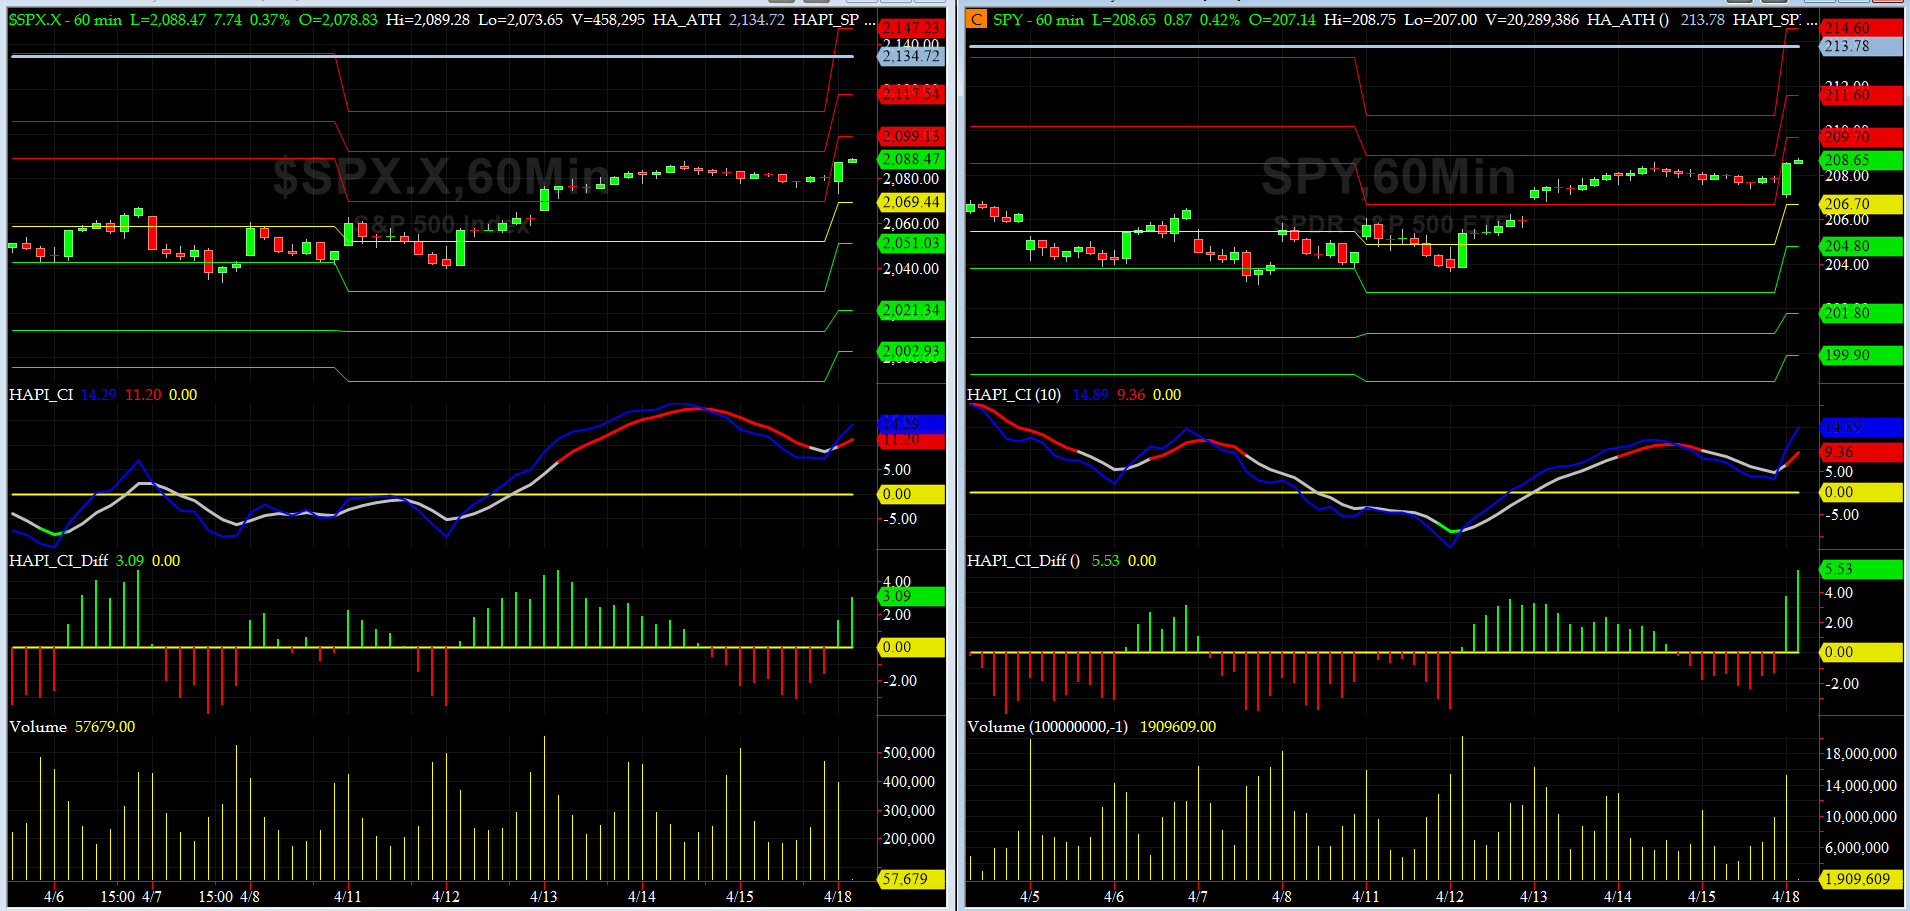
HA_SP1_momo Chart
WEEKLY Timing Model = on a BUY Signal since Friday 4/15/16 CLOSE
DAILY Timing Model = on a BUY Signal since Friday 4/14/16 CLOSE
Max SPX 52wk-highs reading last week = 19 (over 120-140, the local maxima is in)
Max SPX 52wk-Lows reading last week = 2 (over 40-60, the local minima is in)
HA_SP1 = finally in the +1 to +2 sigma channels
HA_Momo = +1(reversals most likely occur above +10 or below -10)
NOTE: The [developing] divergences between our HA_momo and HA_SP1, which we have discussed here, have continued but we have NOT witnessed a translation in price action of SPX YET. stayed tuned? u bet and in the mean time, stock up on more tea, just like our @Capt_Tiko.
Vol of the Vols Chart
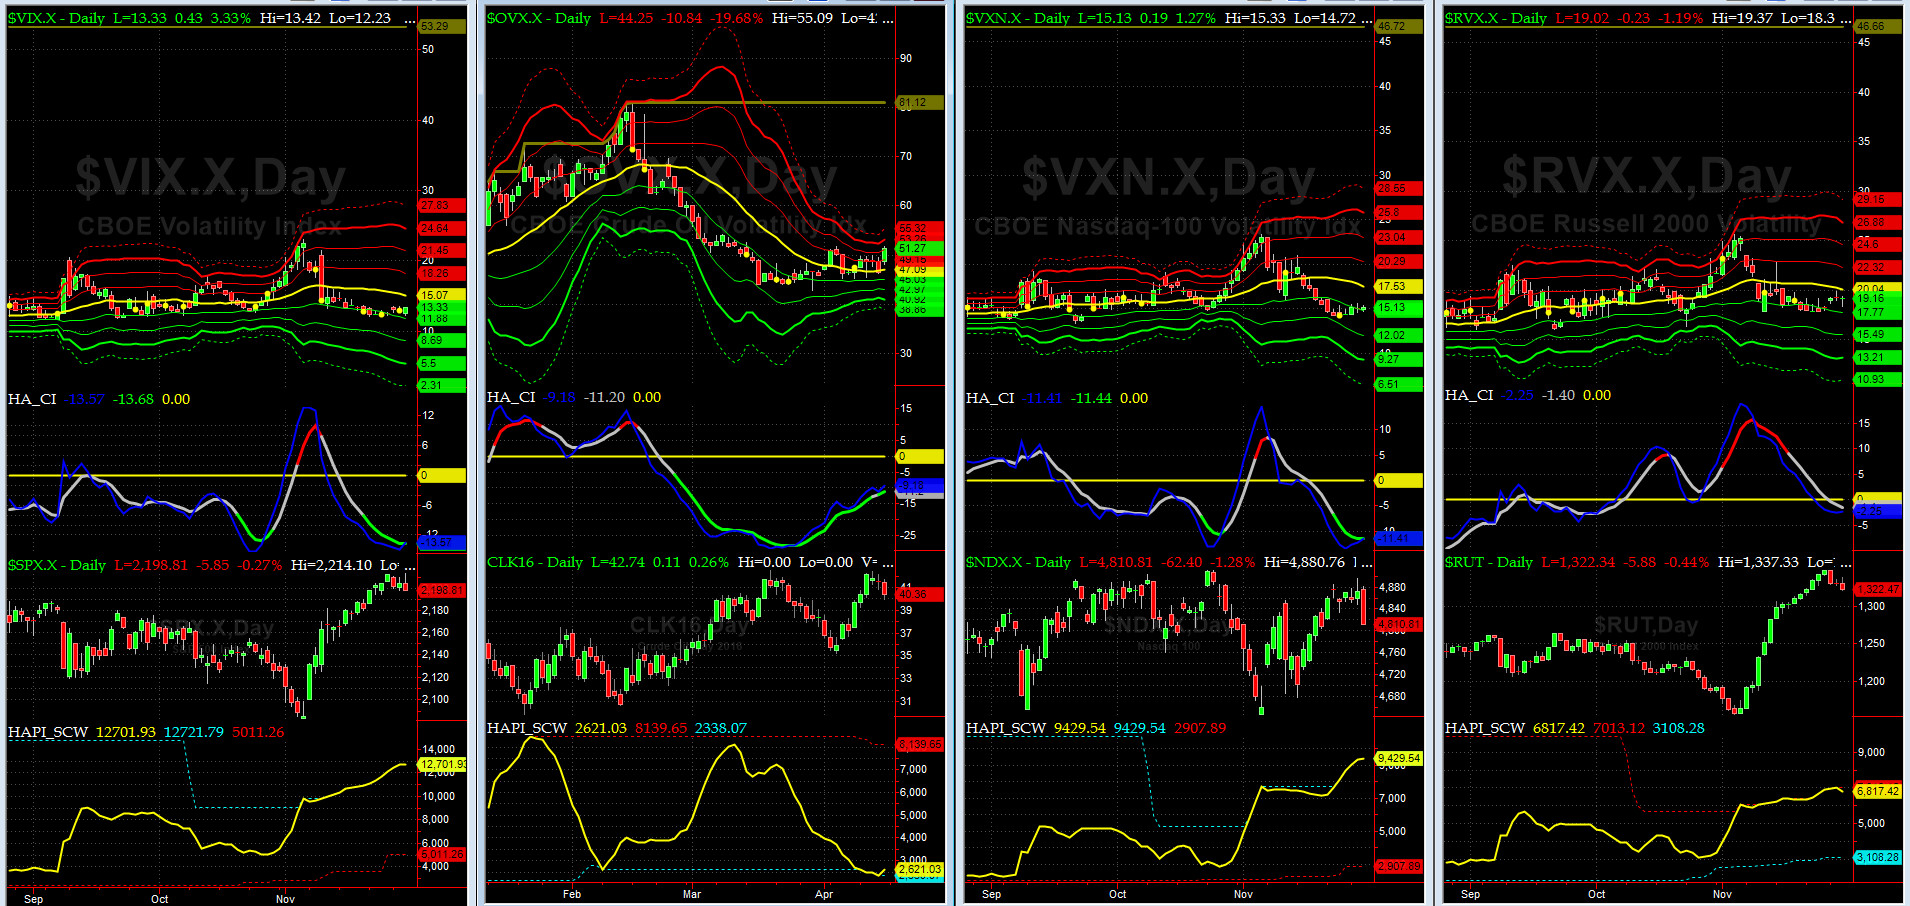
VIX = 13.6 is now at its -1 sigma (remember it�s the VIX�s vol pattern (its sigma channels) that matters, and not the level of VIX itself (this is per Dr. Robert Whaley, a great mentor and the inventor of original VIX, now called VXO. VIX usually peaks around a test of its +4 sigma).
VIX looks "dazed and confused" here, in LedZepp parlance.
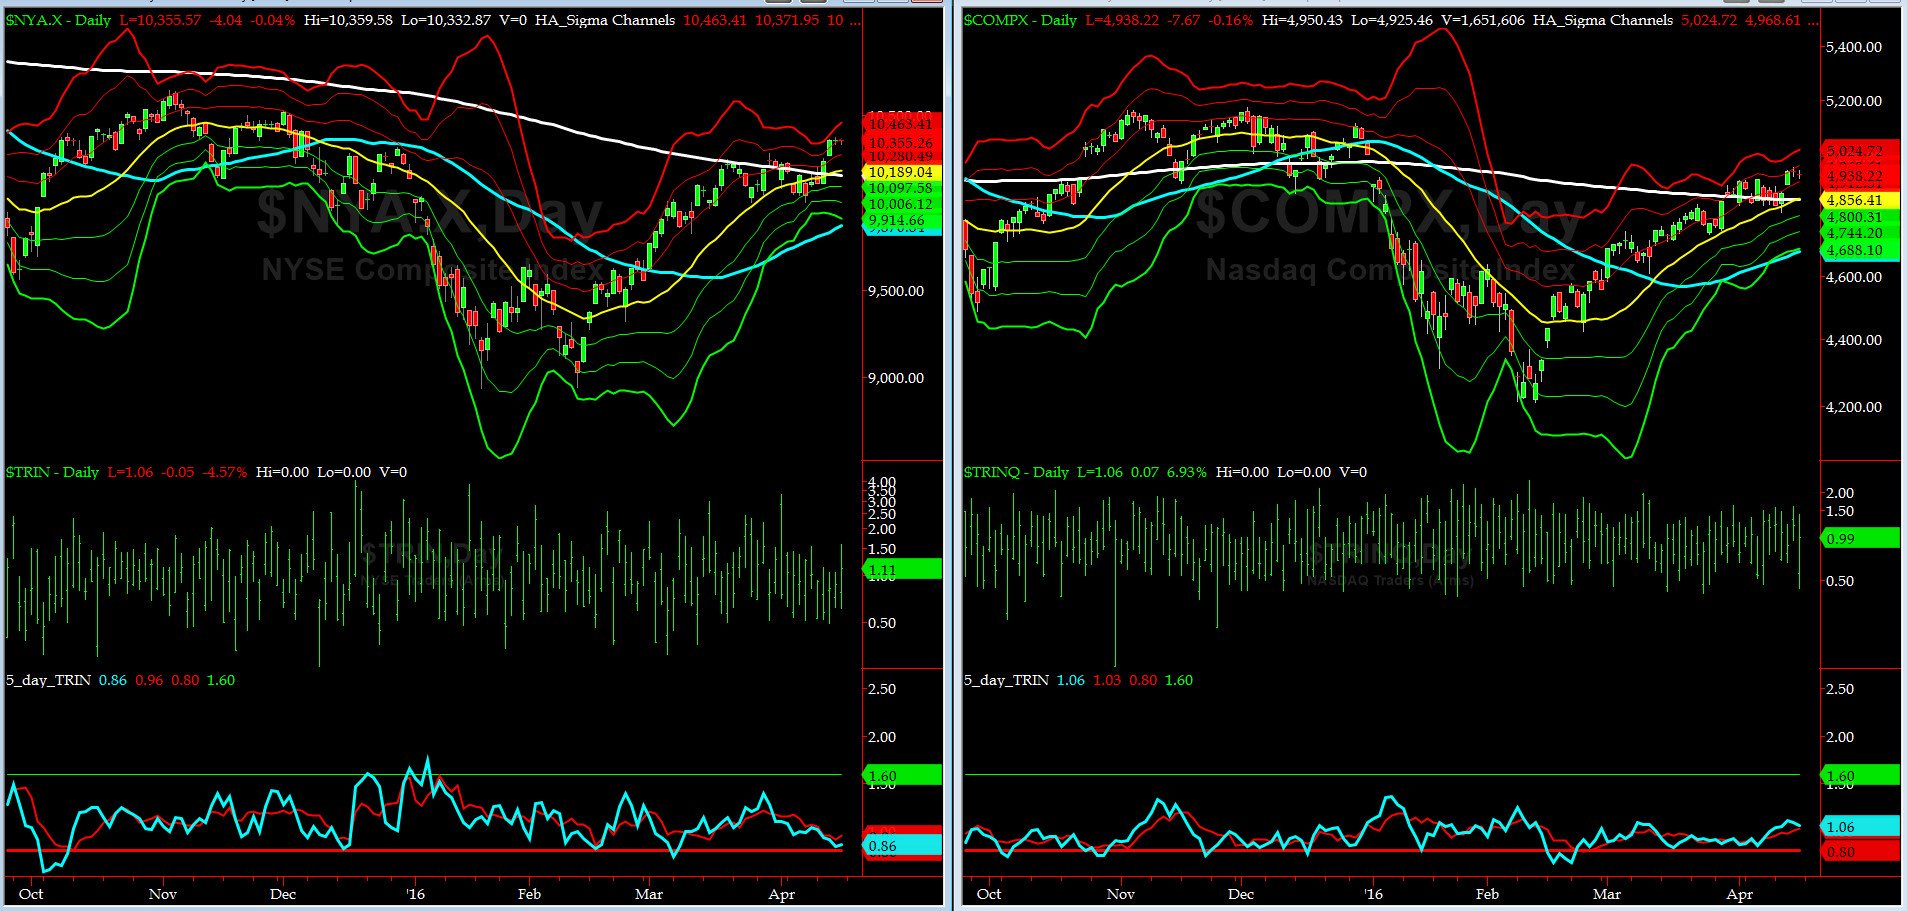
5-day TRIN & TRINQ Charts
The 5-day TRIN (for NYSE) touches SELL Signal territory on Thursday while the 5-day TRINQ (for NASDAQ) remains NEUTRAL.
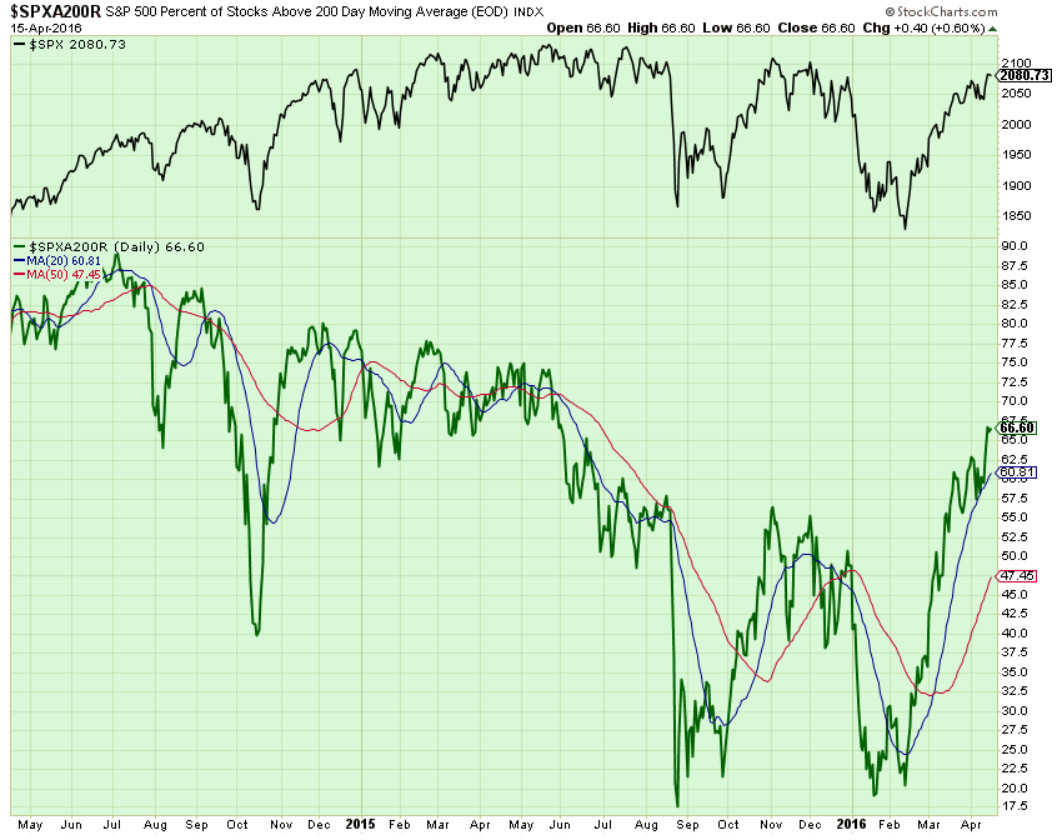
Components of SPX above their respective 200day MA Chart
This past week, this scoring indicator rose to 66% and put in a very BULLISH pattern with next target is the 72% to 75% zone.

SPX SKEW (Tail Risk) Chart
SPX SKEW (Tail Risk) = 123 and near its 0 sigma (normal = 120-125, range 100-150)
All Quiet on the Mid-Western Front? QuietER? Yes, but most likely, that will be temporary, ioho. This reminds us of SKEW action in early Sept last year.
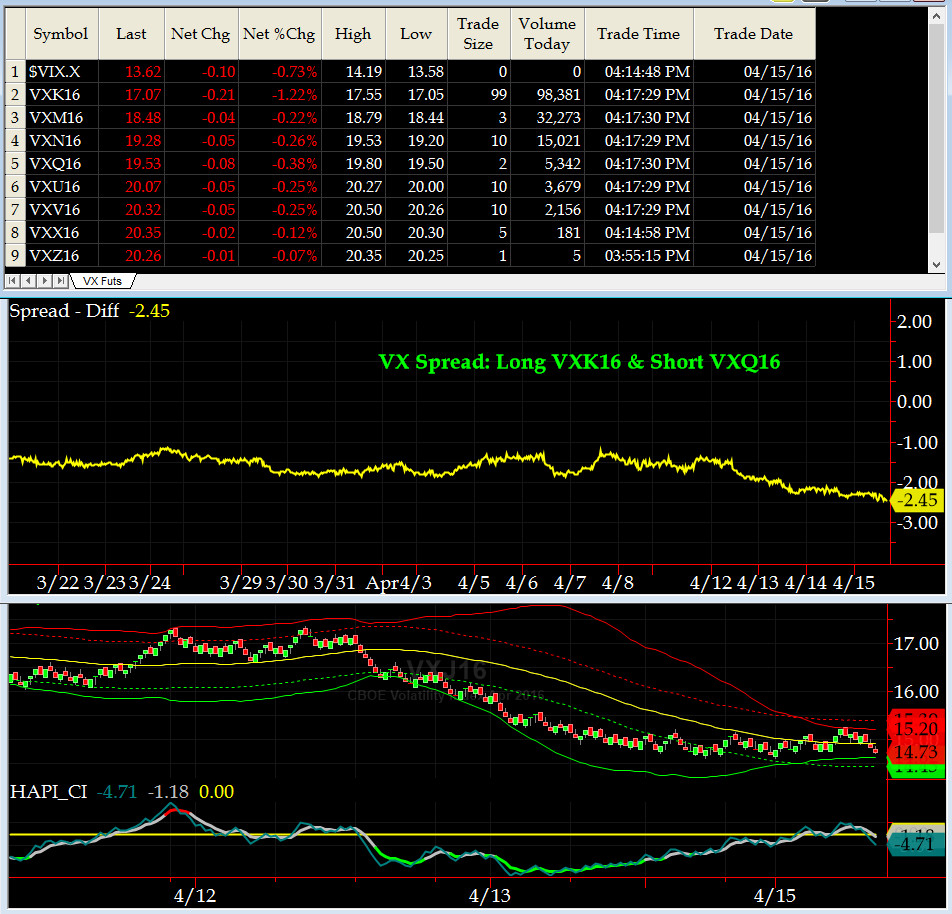
3-month VIX Futures Spread(VX) Chart
Our 3-month VIX Futures Spread (LONG MAY16 & SHORT AUG16) closed Friday at about -2.45. This reading continues, albeit, a lesser warning sign for resistance in SPX.
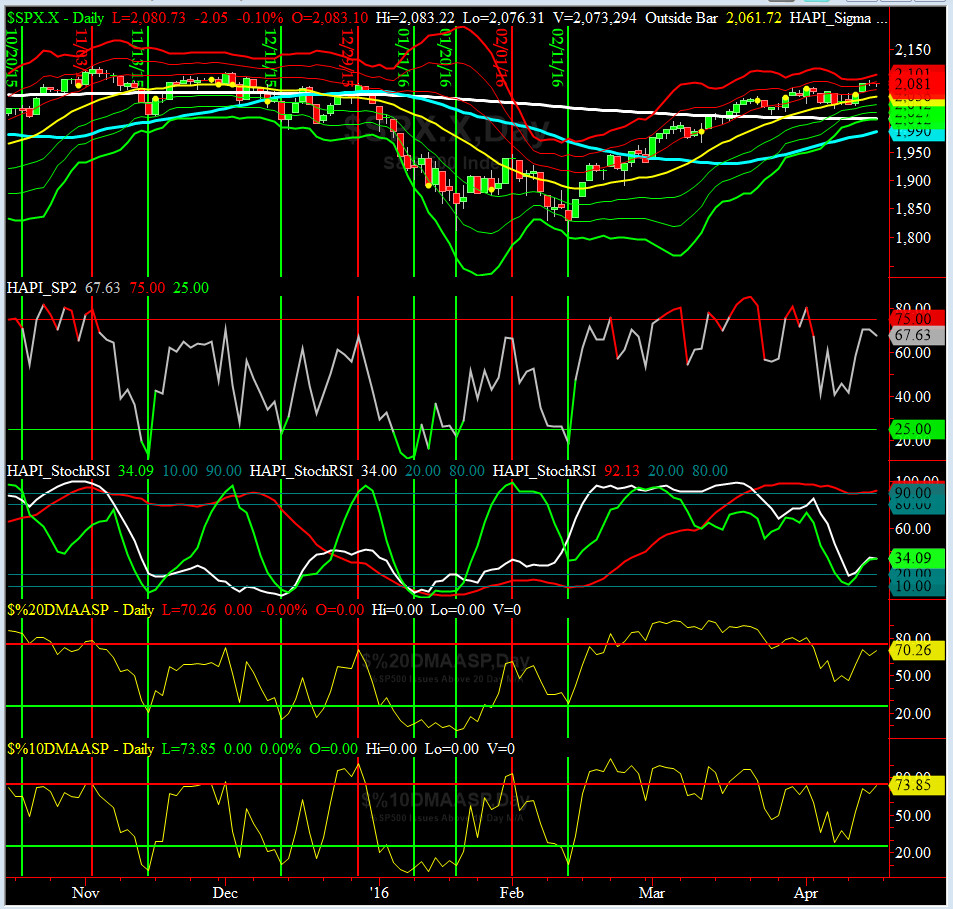
HA_SP2 Chart
HA_SP2 = 67.6.1 (Buy signal <= 25, Sell Signal >= 75)
At ~67, this prop indicator is above NEUTRAL zone but it is not OverBought yet.
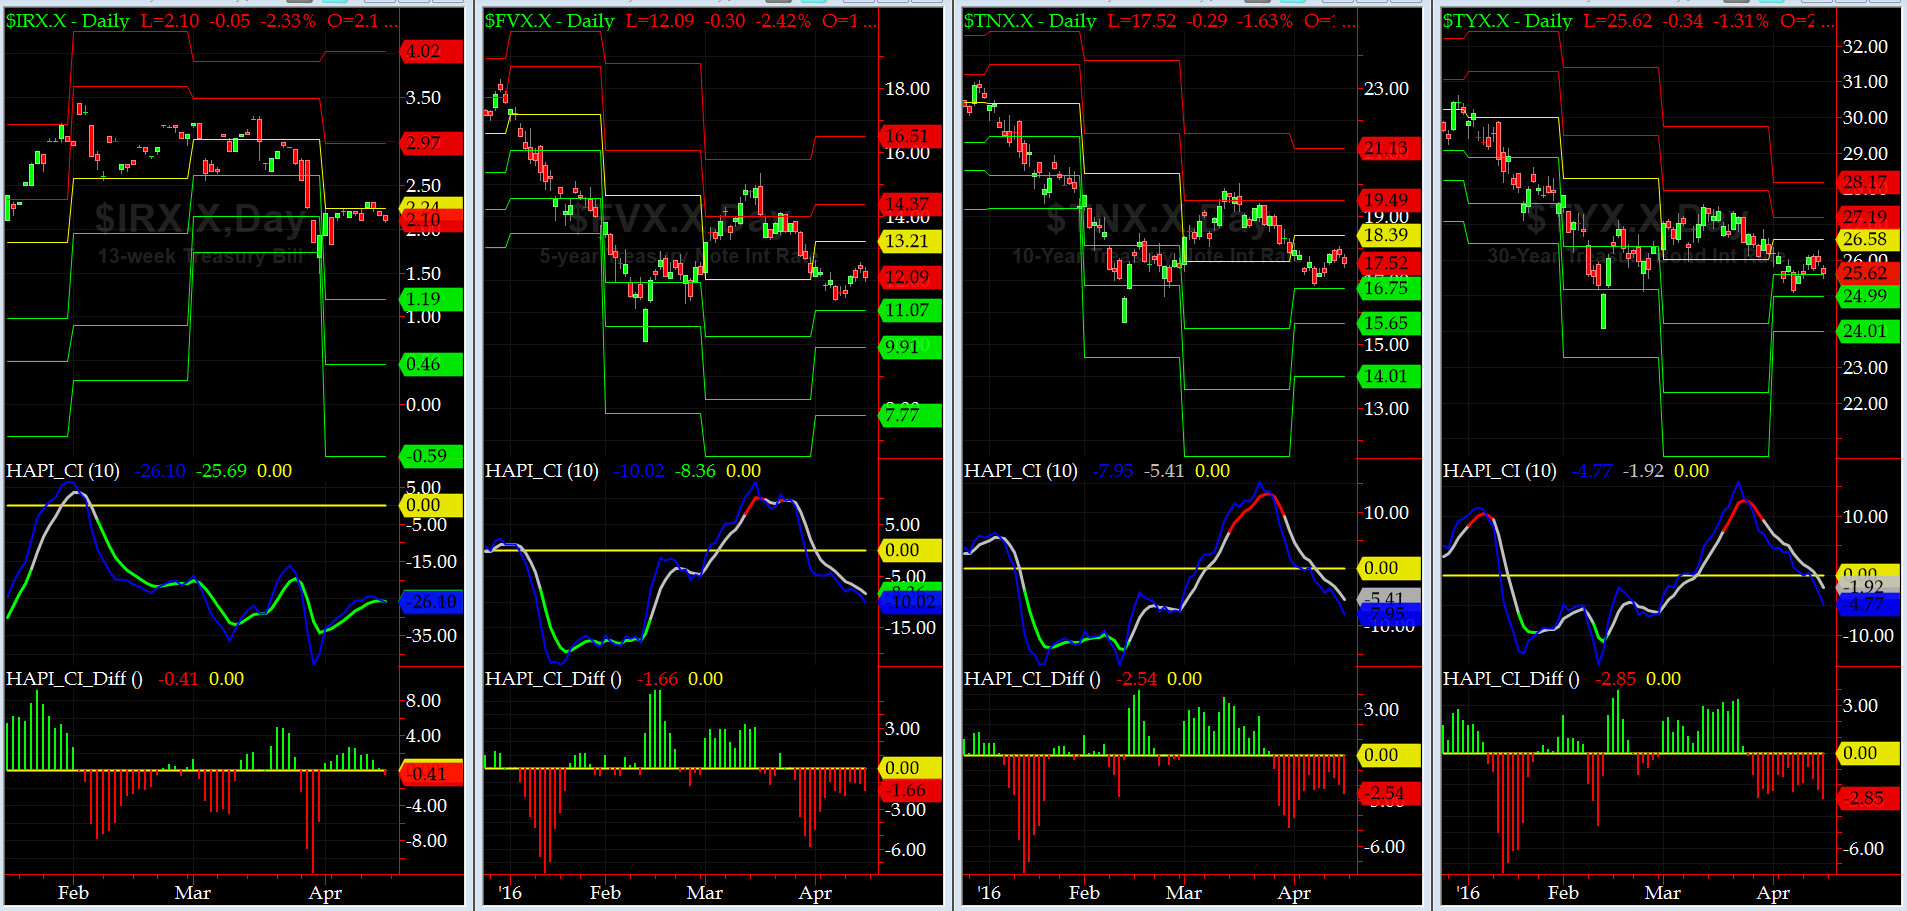
US Treasury T-Notes & T-Bonds Yields Chart
US Treasury Yield Curve showed no particular bias this past week and we witnessed its Sausage Ops (the Romans must have arrived at the gates of the Bond Market). This shall not stand either.
Fari Hamzei
|


 Proactive Market Timing