|
Saturday, June 4, 2016 2230ET
Market Timing Charts, Analysis & Commentary for Issue #145
Timer Charts of S&P-500 Cash Index (SPX) + NASDAQ-100 Cash Index (NDX)
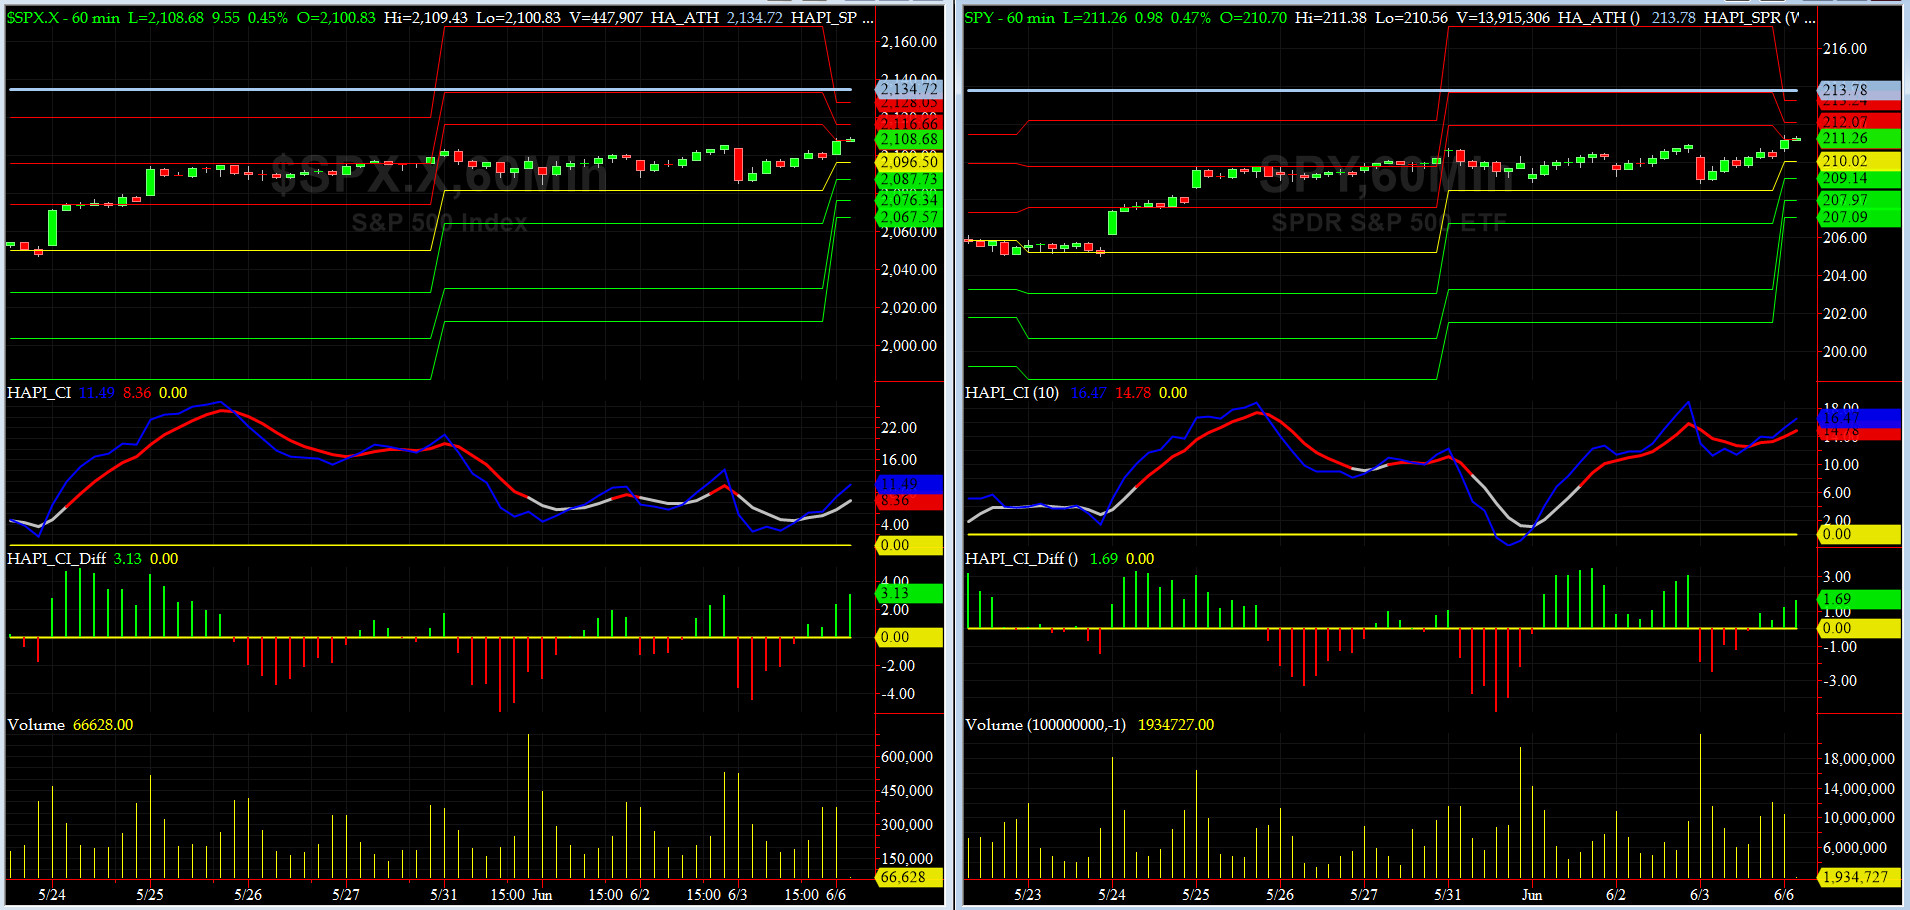
Most recent S&P-500 Cash Index (SPX): 2099.13 up +0.07 (flat) for the week ending on Friday, June 4th, 2016, which closed above its +1 sigma.
SPX ALL TIME INTRADAY HIGH = 2134.72 (reached on Wednesday, May 20th, 2015)
SPX ALL TIME CLOSING HIGH = 2130.82 (reached on Thursday, May 21st, 2015)
Current DAILY +2 Sigma SPX = 2115 with WEEKLY +2 Sigma = 2162
Current DAILY 0 Sigma (20 day MA) SPX = 2072 with WEEKLY 0 Sigma = 2014
Current DAILY -2 Sigma SPX = 2029 with WEEKLY -2 Sigma = 1866
NYSE McClellan Oscillator = +71 (-150 is start of the O/S area; around -275 to -300 area or lower, we go into the �launch-pad� mode, over +150, we are in O/B area)
NYSE Breadth Thrust = 64 (40 is considered as oversold and 65 as overbought)
Last 3 trading days, we have gapped down and then buying has come in and we have closed fairly close to highs of each day. Monday AuntieJanet is scheduled to give an important speech to WAC of Philly.
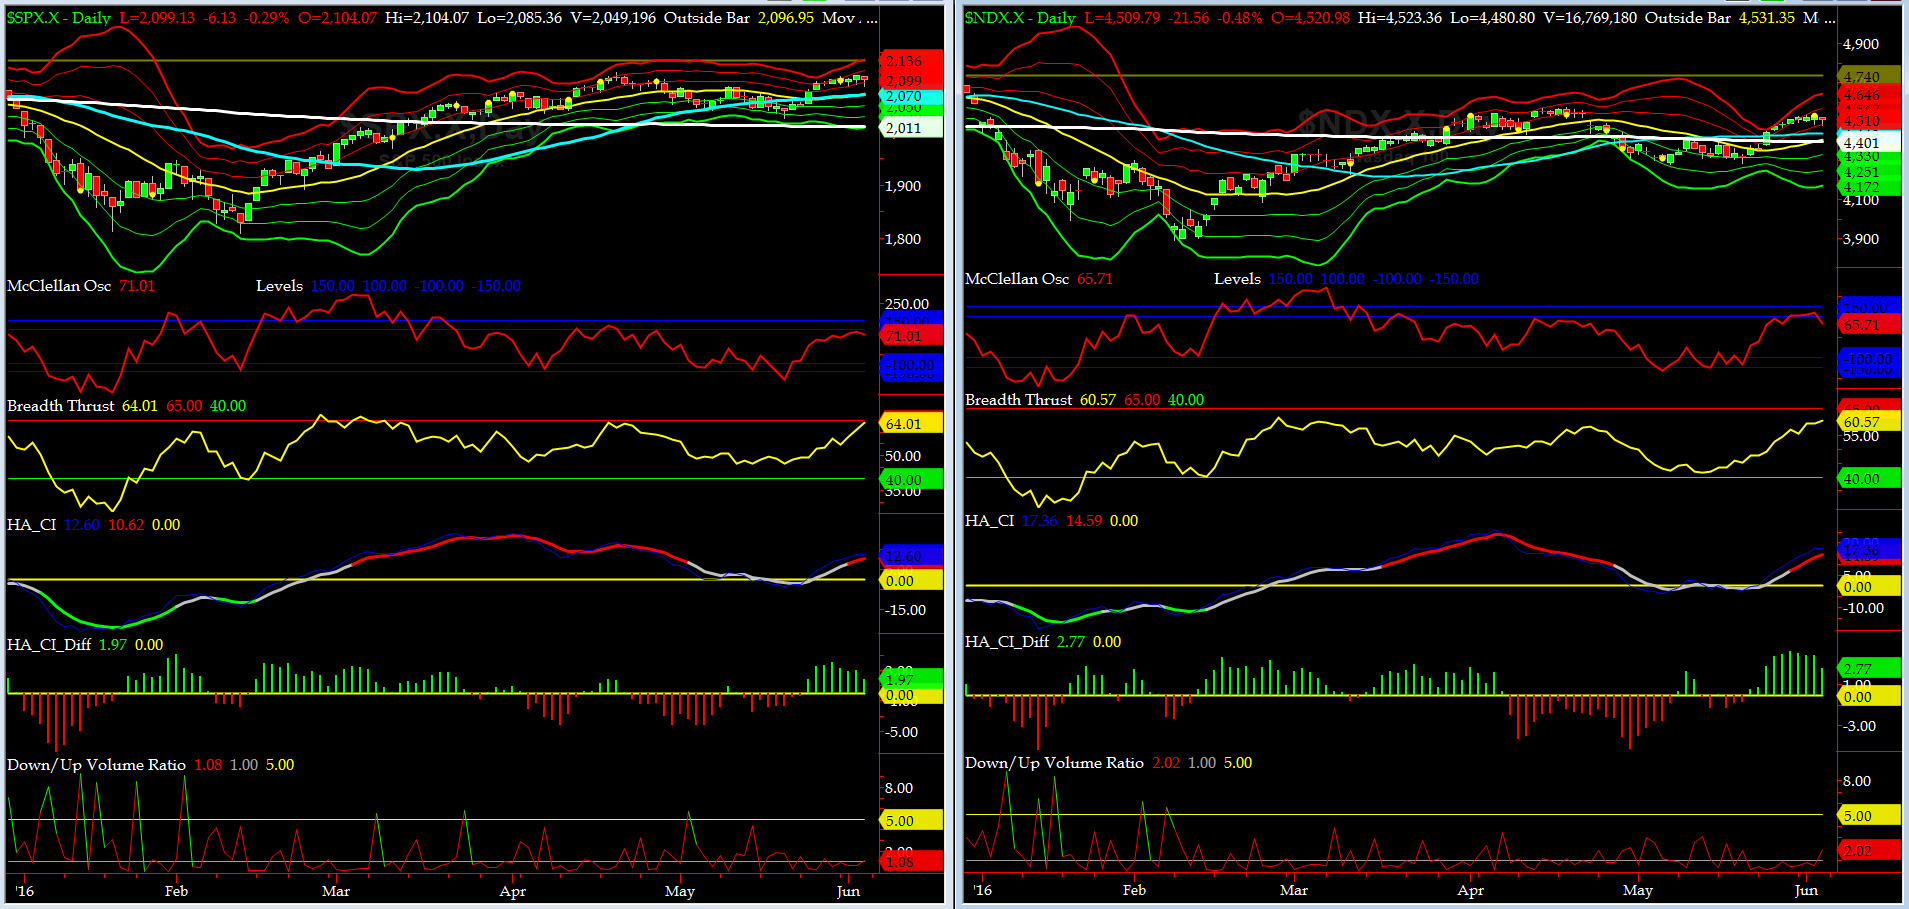
Canaries [in the Coal Mine] Chart for DJ TRAN & RUT Indices
200-Day MA DJ TRAN = 7715 or 0.6% below DJ TRAN (max observed in last 5 yrs = 20.2%, min = -20.3%)
200-Day MA RUT = 1113 or 3.2% below RUT (max observed in last 5 yrs = 21.3%, min = -22.6%)
DJ Transports (proxy for economic conditions 6 to 9 months hence) was very flat this past week.
Russell 2000 Small Caps (proxy for RISK ON/OFF) rallied further.....yes, the RISK IS ON......... watch for 1195-1200 area.
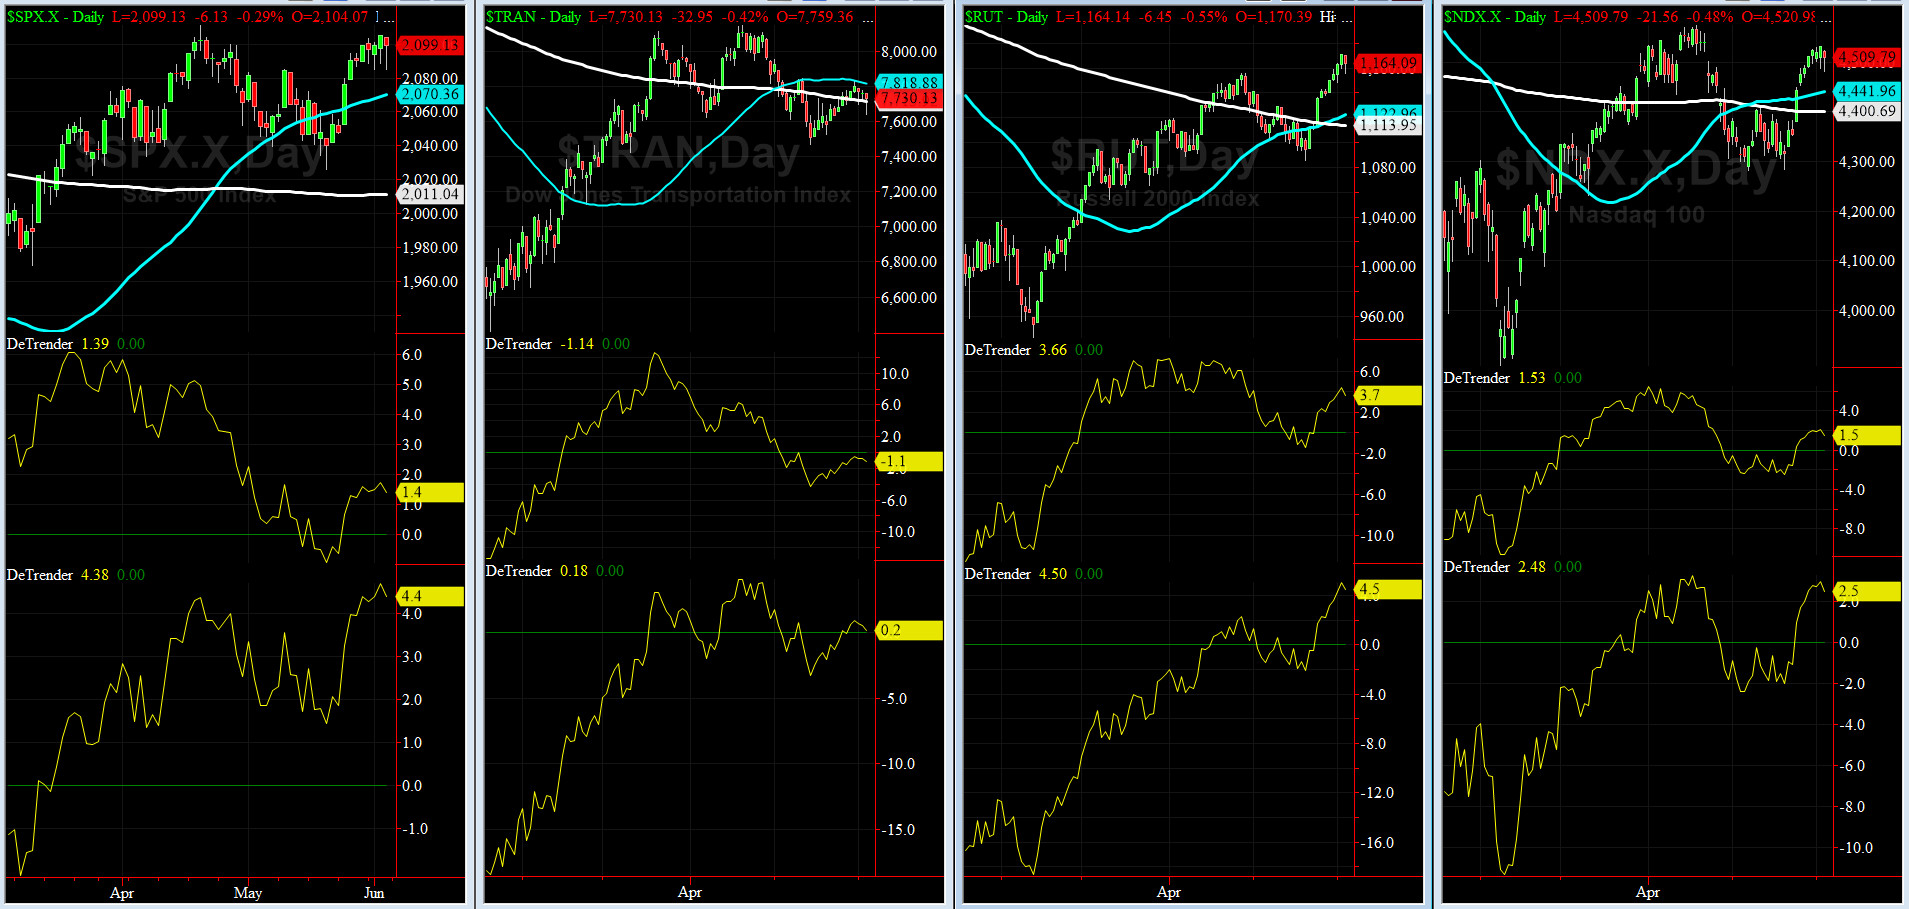
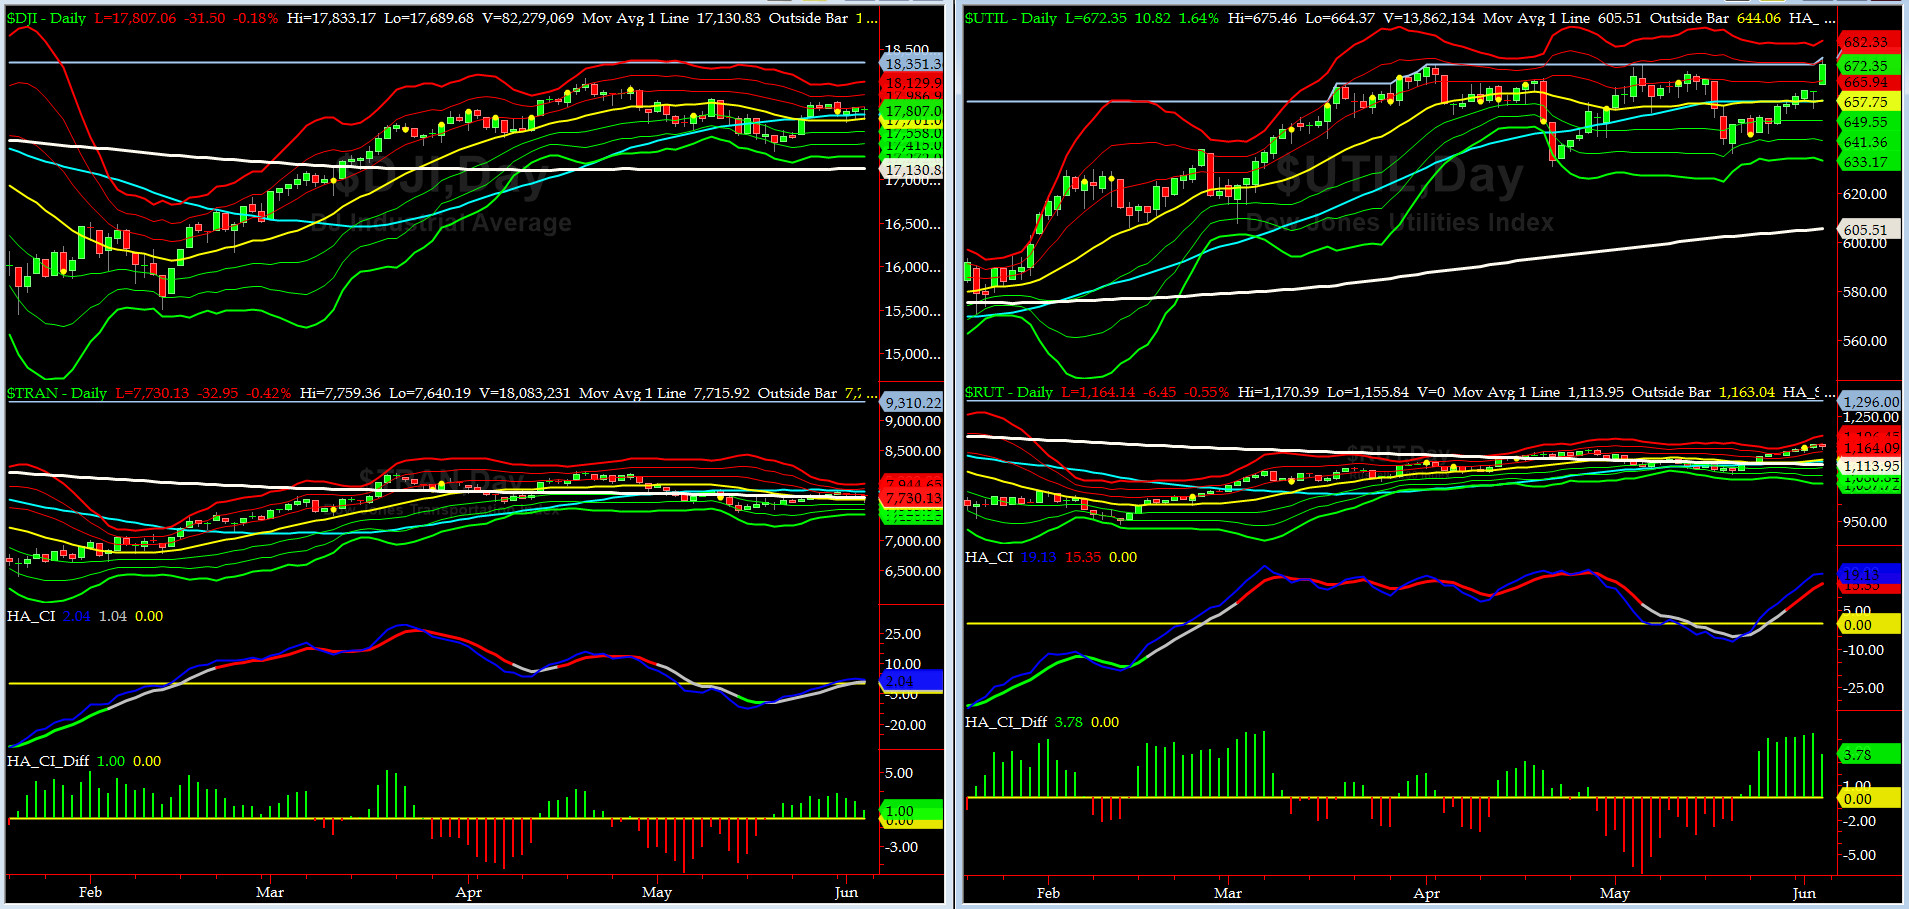
DeTrenders Charts for SPX, NDX, TRAN & RUT Indices
50-Day MA SPX = 2070 or 1.4% below SPX (max observed in last 5 yrs = +8.6%, min = -9.3%)
200-Day MA SPX = 2011 or 4.4% below SPX (max observed in last 5 yrs = 15.2%, min = -14%)
This week, SEVEN of our Eight DeTrenders again remained POSITIVE. DeTrender for RUT is worth watching this week.
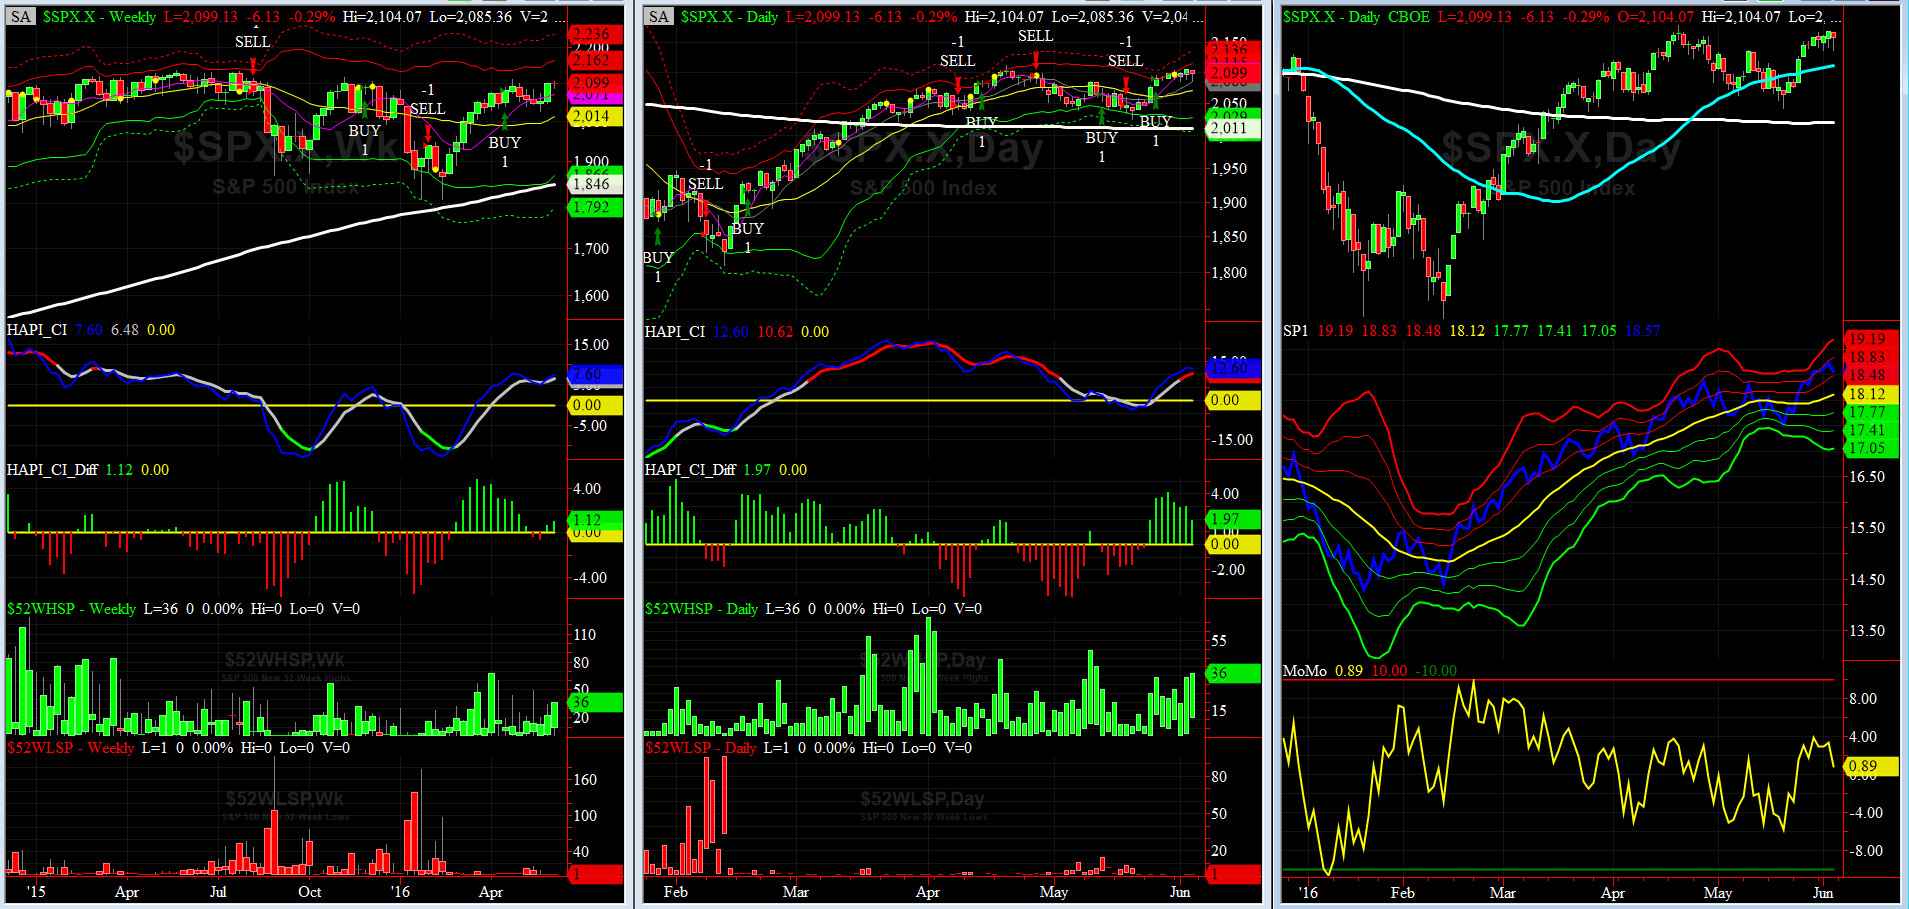
HA_SP1_momo Chart
WEEKLY Timing Model = on a BUY Signal since Friday 4/15/16 CLOSE
DAILY Timing Model = on a BUY Signal since Wednesday 5/25/16 CLOSE
Max SPX 52wk-highs reading last week = 36 (over 120-140, the local maxima is in)
Max SPX 52wk-Lows reading last week = 1 (over 40-60, the local minima is in)
HA_SP1 = at about its +1.5 sigma channels
HA_Momo = +0.9(reversals most likely occur above +10 or below -10)
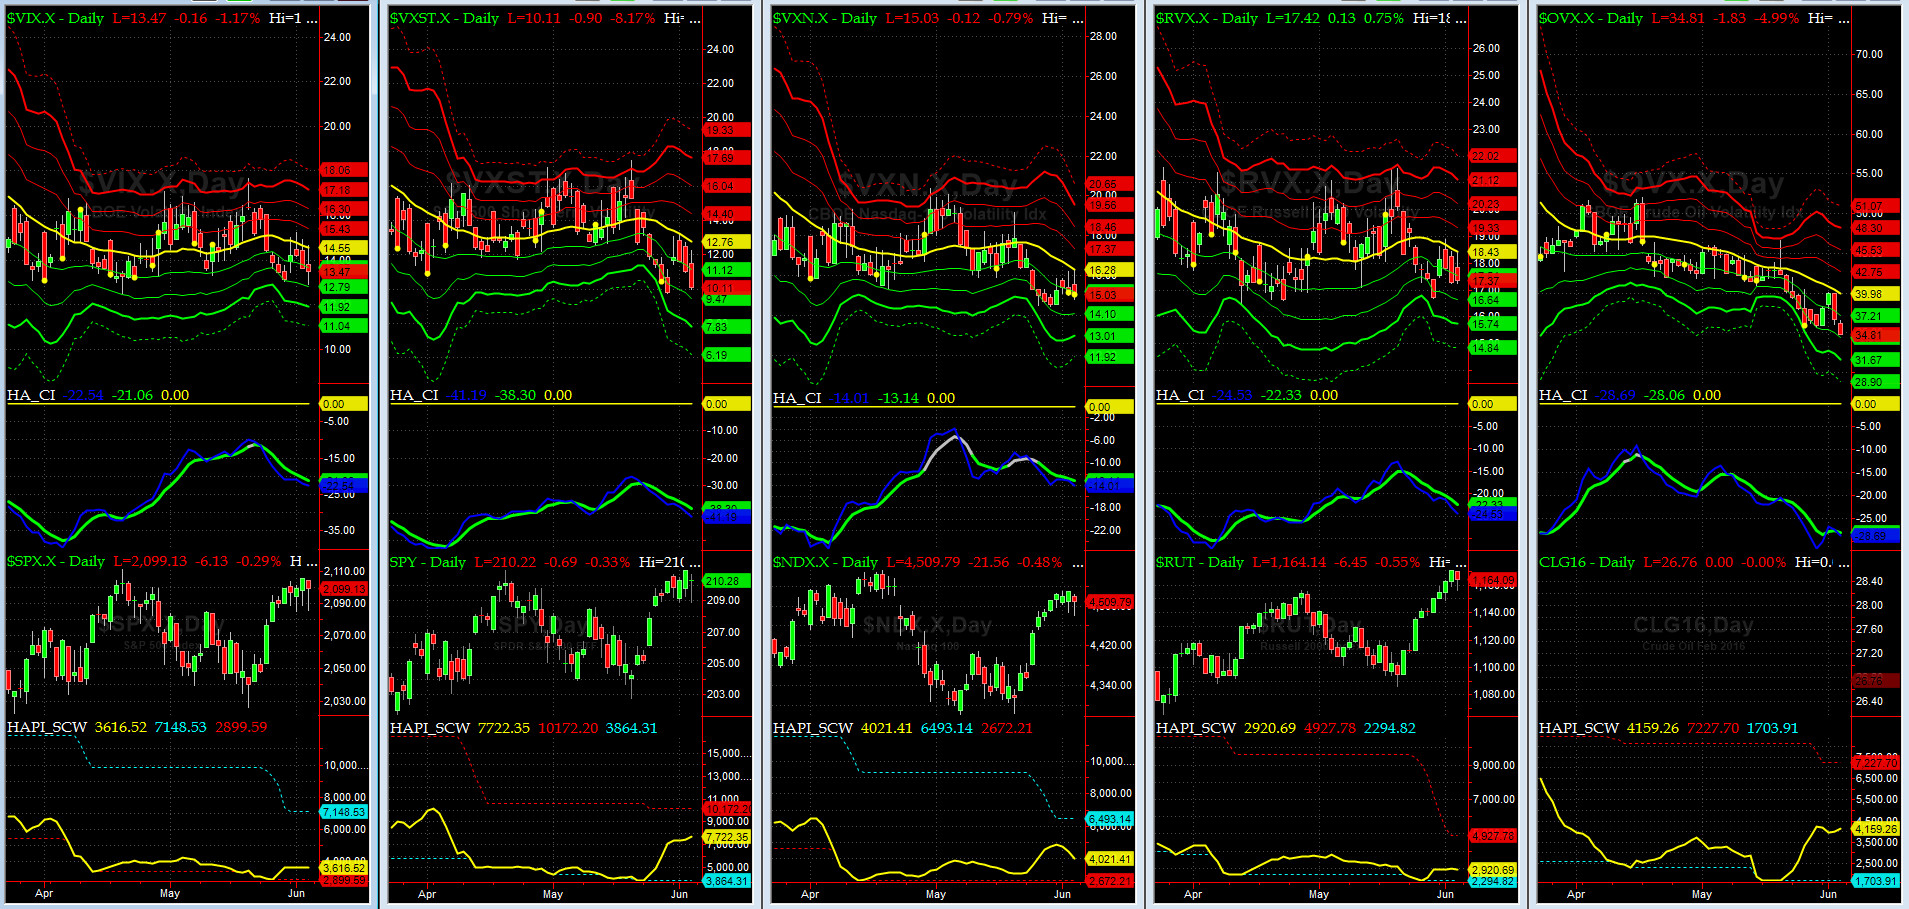
Vol of the Vols Chart
VIX = 13.5 is now at -1 sigma (remember it�s the VIX�s vol pattern (its sigma channels) that matters, and not the level of VIX itself (this is per Dr. Robert Whaley, a great mentor and the inventor of original VIX, now called VXO). VIX usually peaks around a test of its +4 sigma).
These days we are most focused on OVX (Crude Oil Vol). Continues to head south with no support in sight.
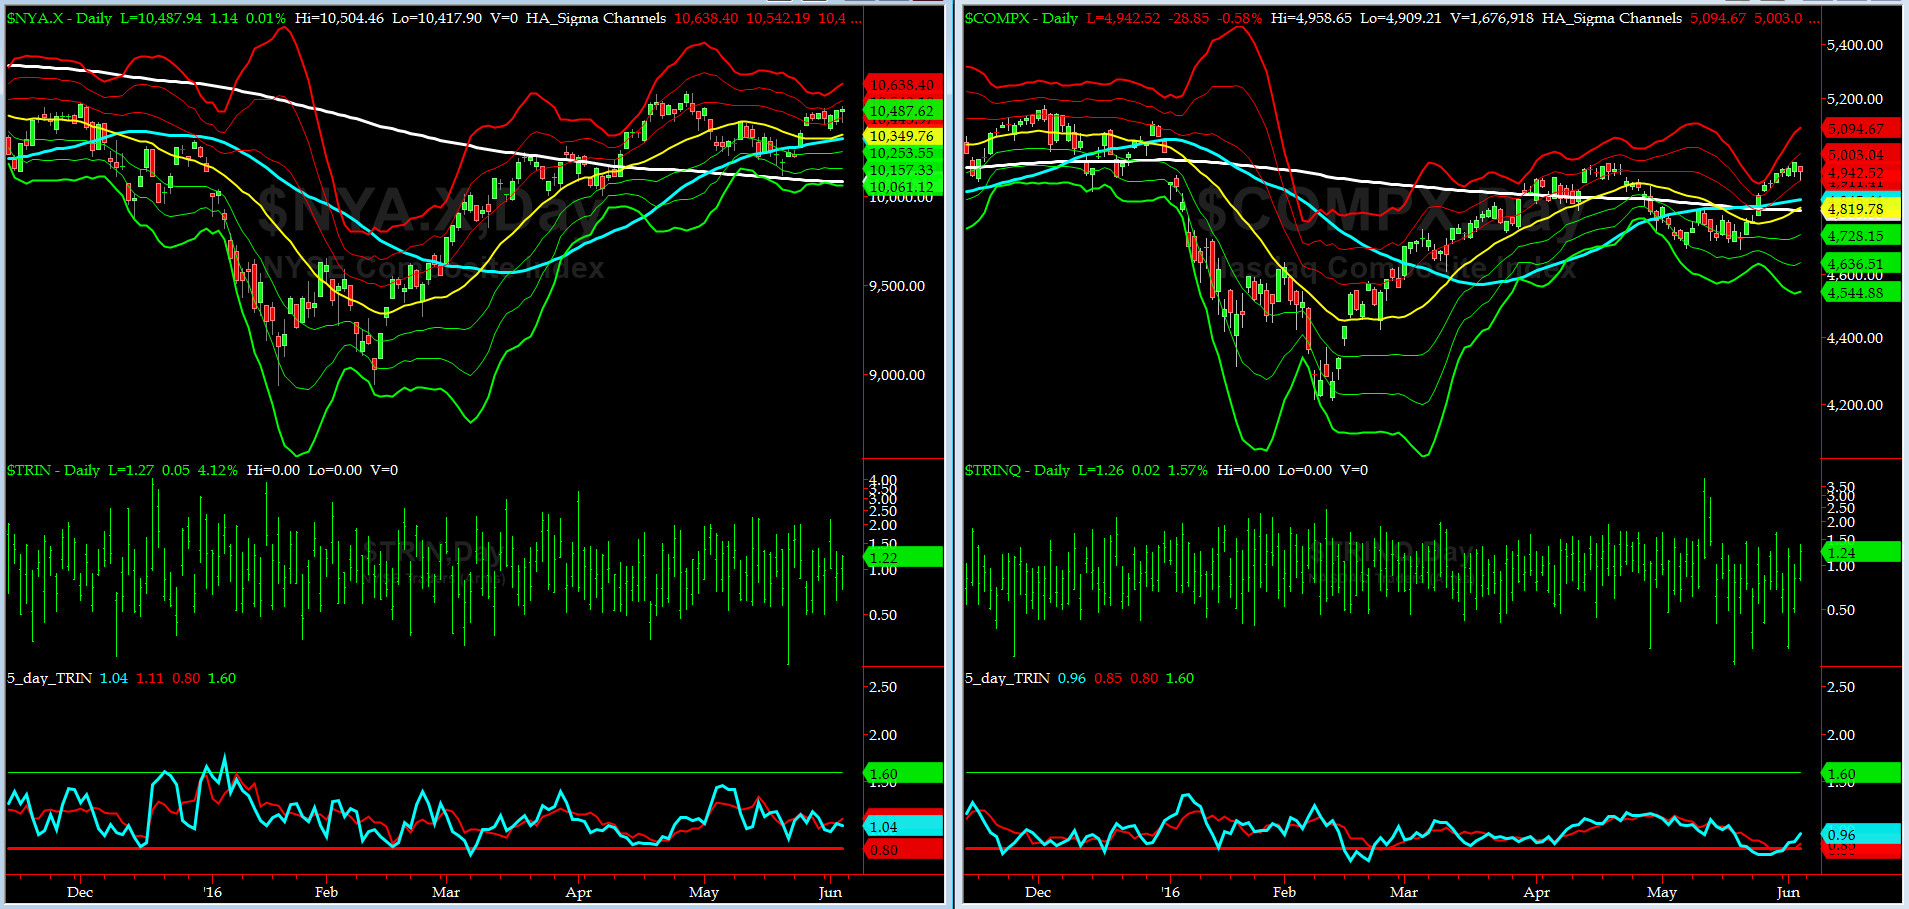
5-day TRIN & TRINQ Charts
NO SIGNAL HERE........
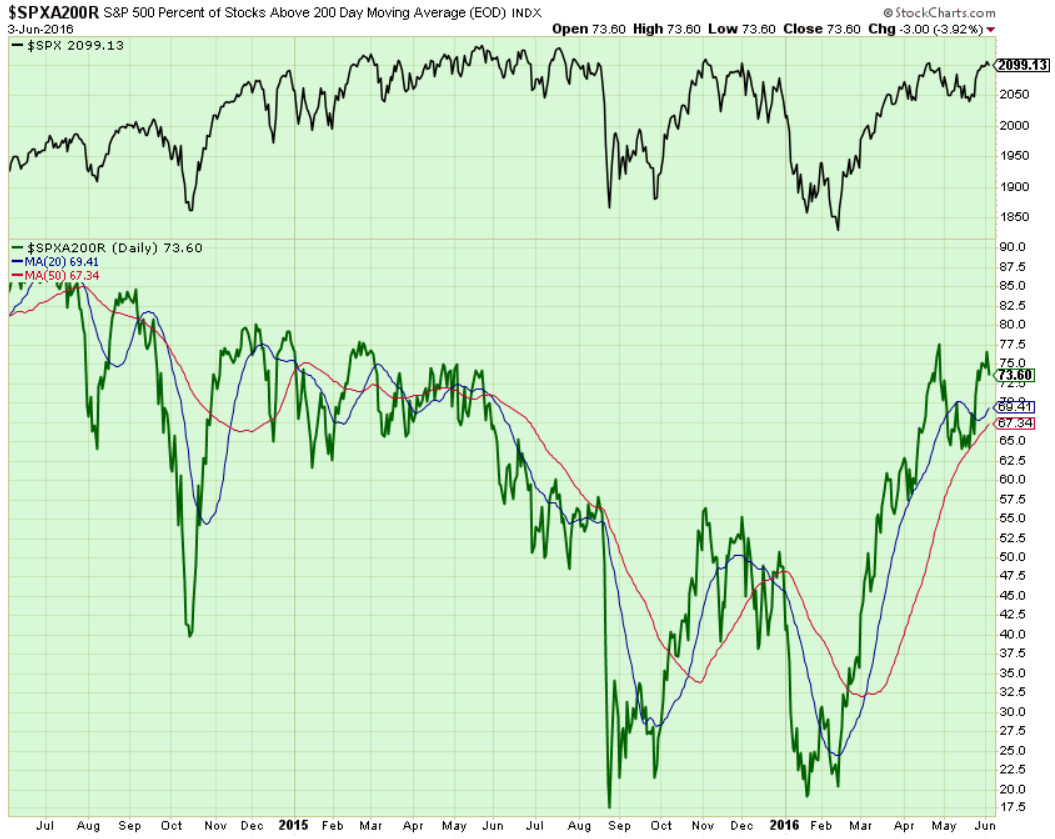
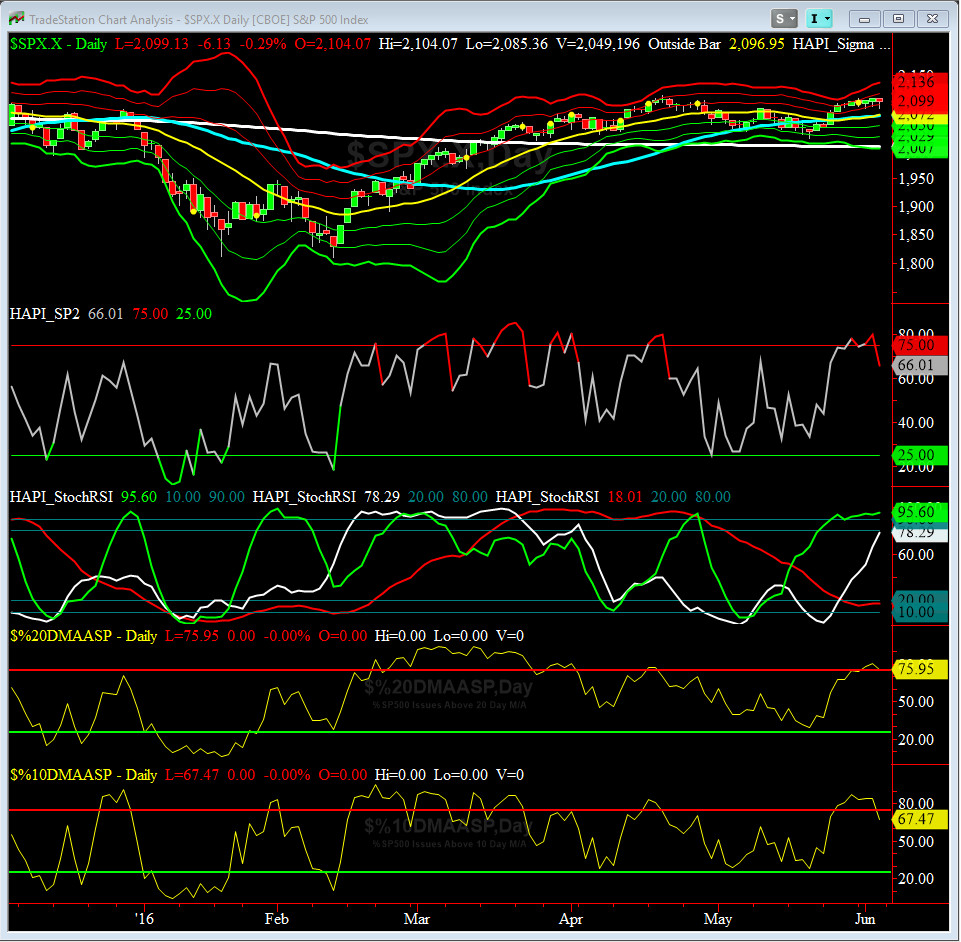
Components of SPX above their respective 200day MA Chart
This scoring indicator is stuck at 75%. What is next? Most likely a bit of easing off before we head up higher again.
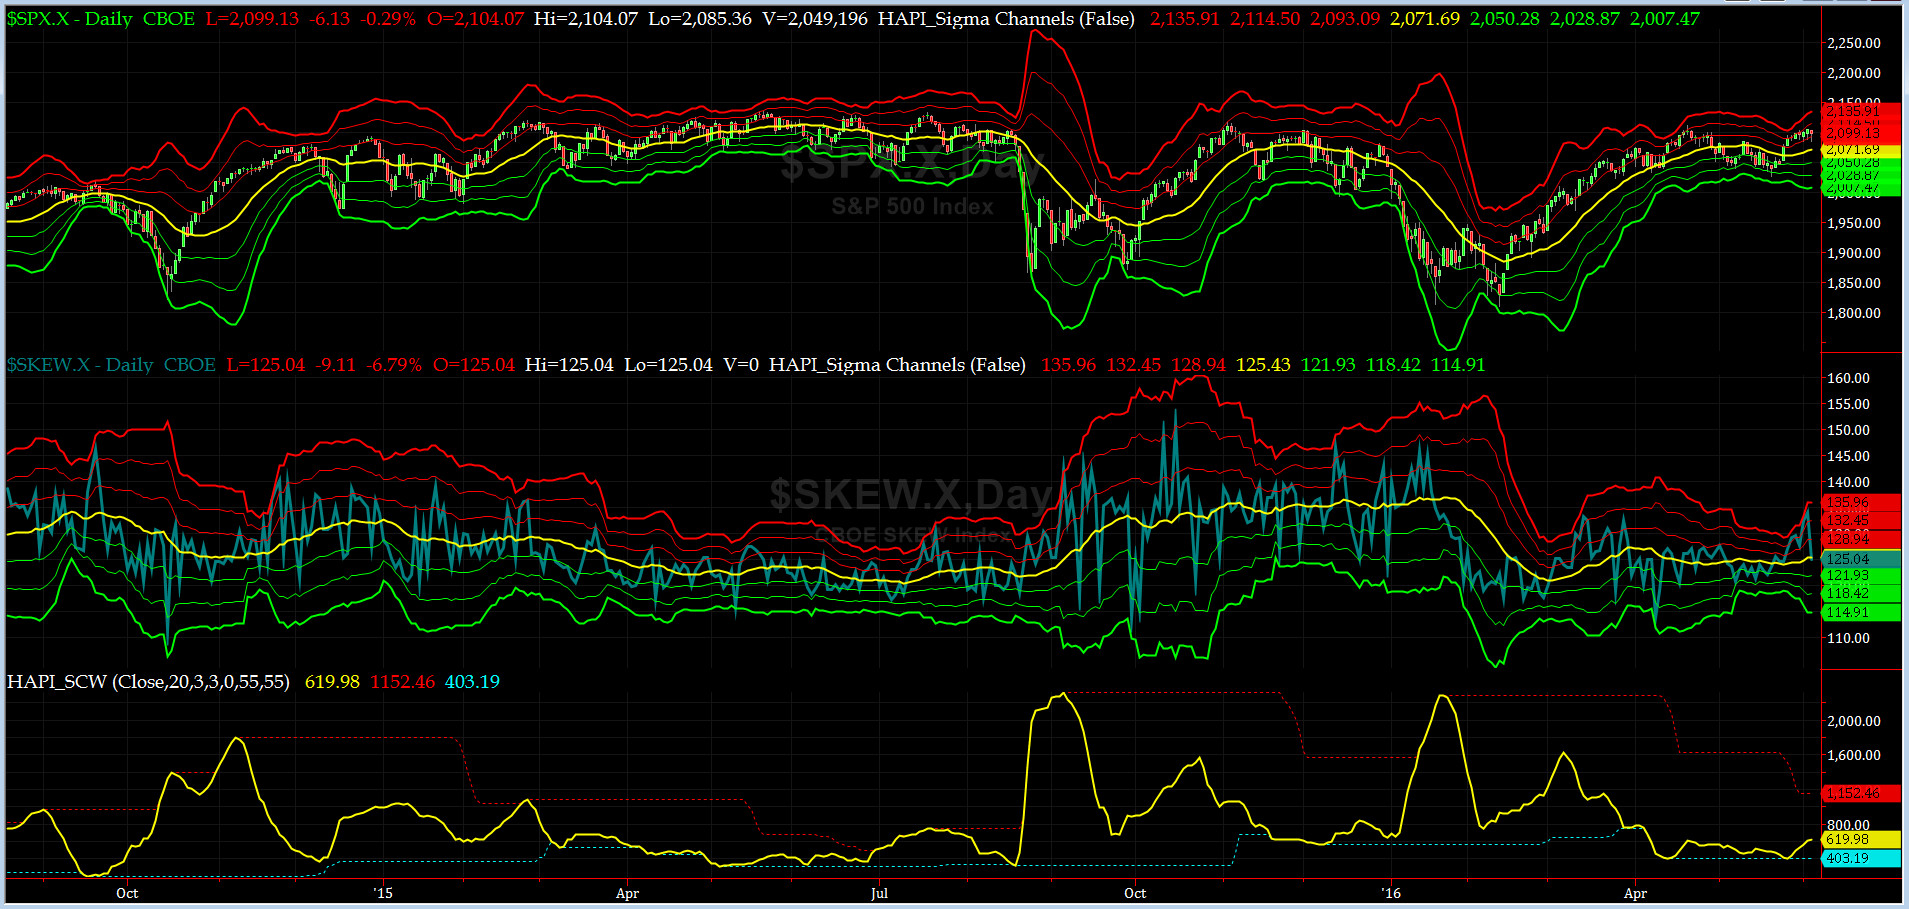
SPX SKEW (Tail Risk) Chart
SPX SKEW (Tail Risk) = back down to 125 and very near its zero sigma again (normal = 120-125, range 100-150)
All Quiet on the Mid-Western Front? YES, of course our vision is tinted by BLS Data and the words of wisdom bestowed upon us by the High Priestess of the Temple (AuntieJ) and her herd of Fed Govs who seems these days to give more interviews than Sec Clinton + TheDonald combined.
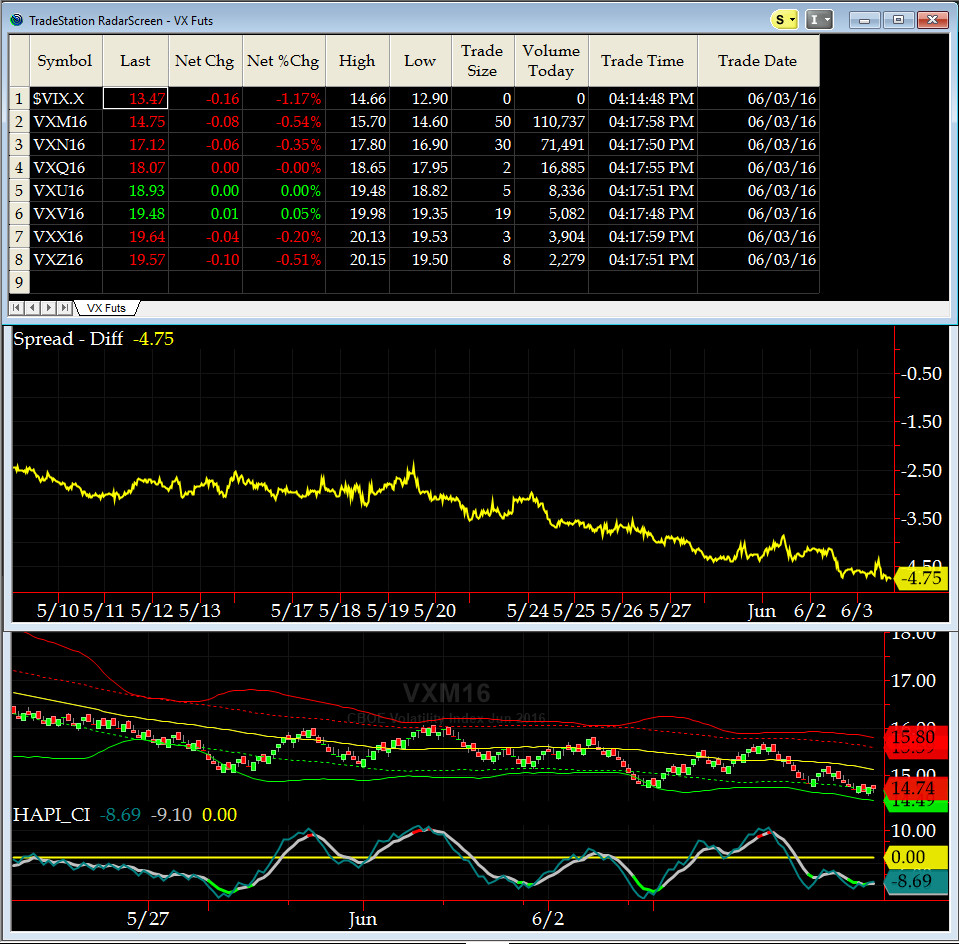
3-month VIX Futures Spread(VX) Chart
Our 4-month VIX Futures Spread (LONG JUN16 & SHORT OCT16) closed at -4.7 on Friday. Market continues to be near a local maxima.
HA_SP2 Chart
HA_SP2 = 66 (Buy signal <= 25, Sell Signal >= 75)
At ~66, this prop indicator says, again, we are NOT OverBought. LONGS should take some more chips off the table.
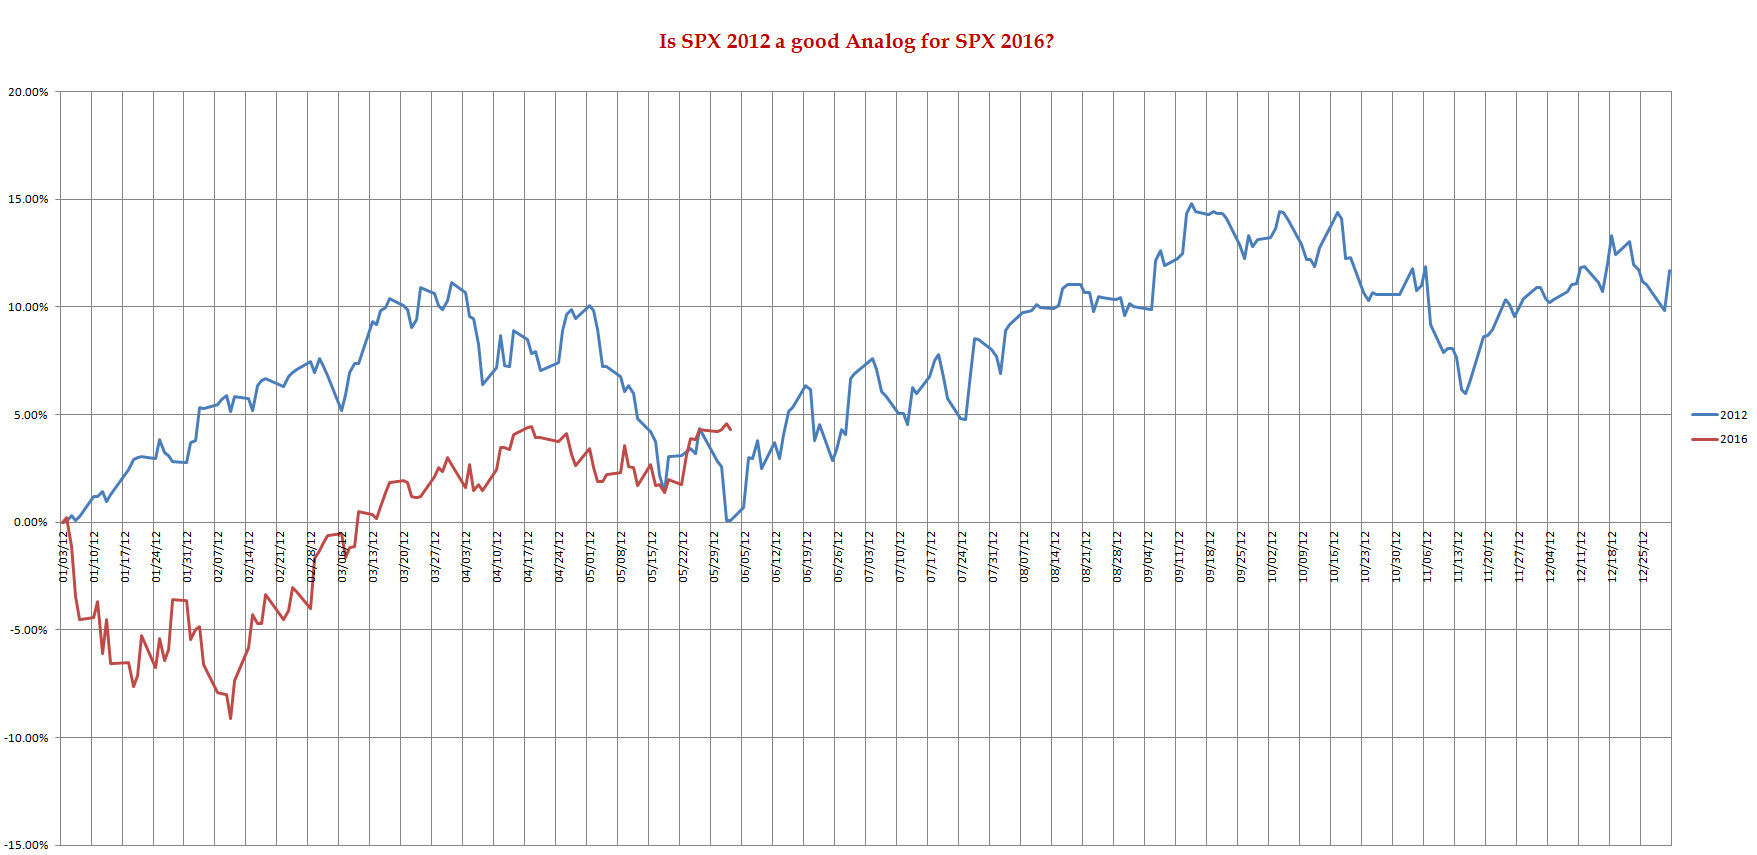
SPX 2012 Analog for SPX 2016
We have not found any analog (for 2016) we like so far, but then again, as Rumi reminds us: "Night is Young...."
Having stated that and based on this Analog, it looks to us that we could have a pause before another march up. What is puzzling to us about this analog (and partially based on our review of corporate credit landscape (both investment grade and junk, specially from the energy patch), we expect a challenging summer in equities).
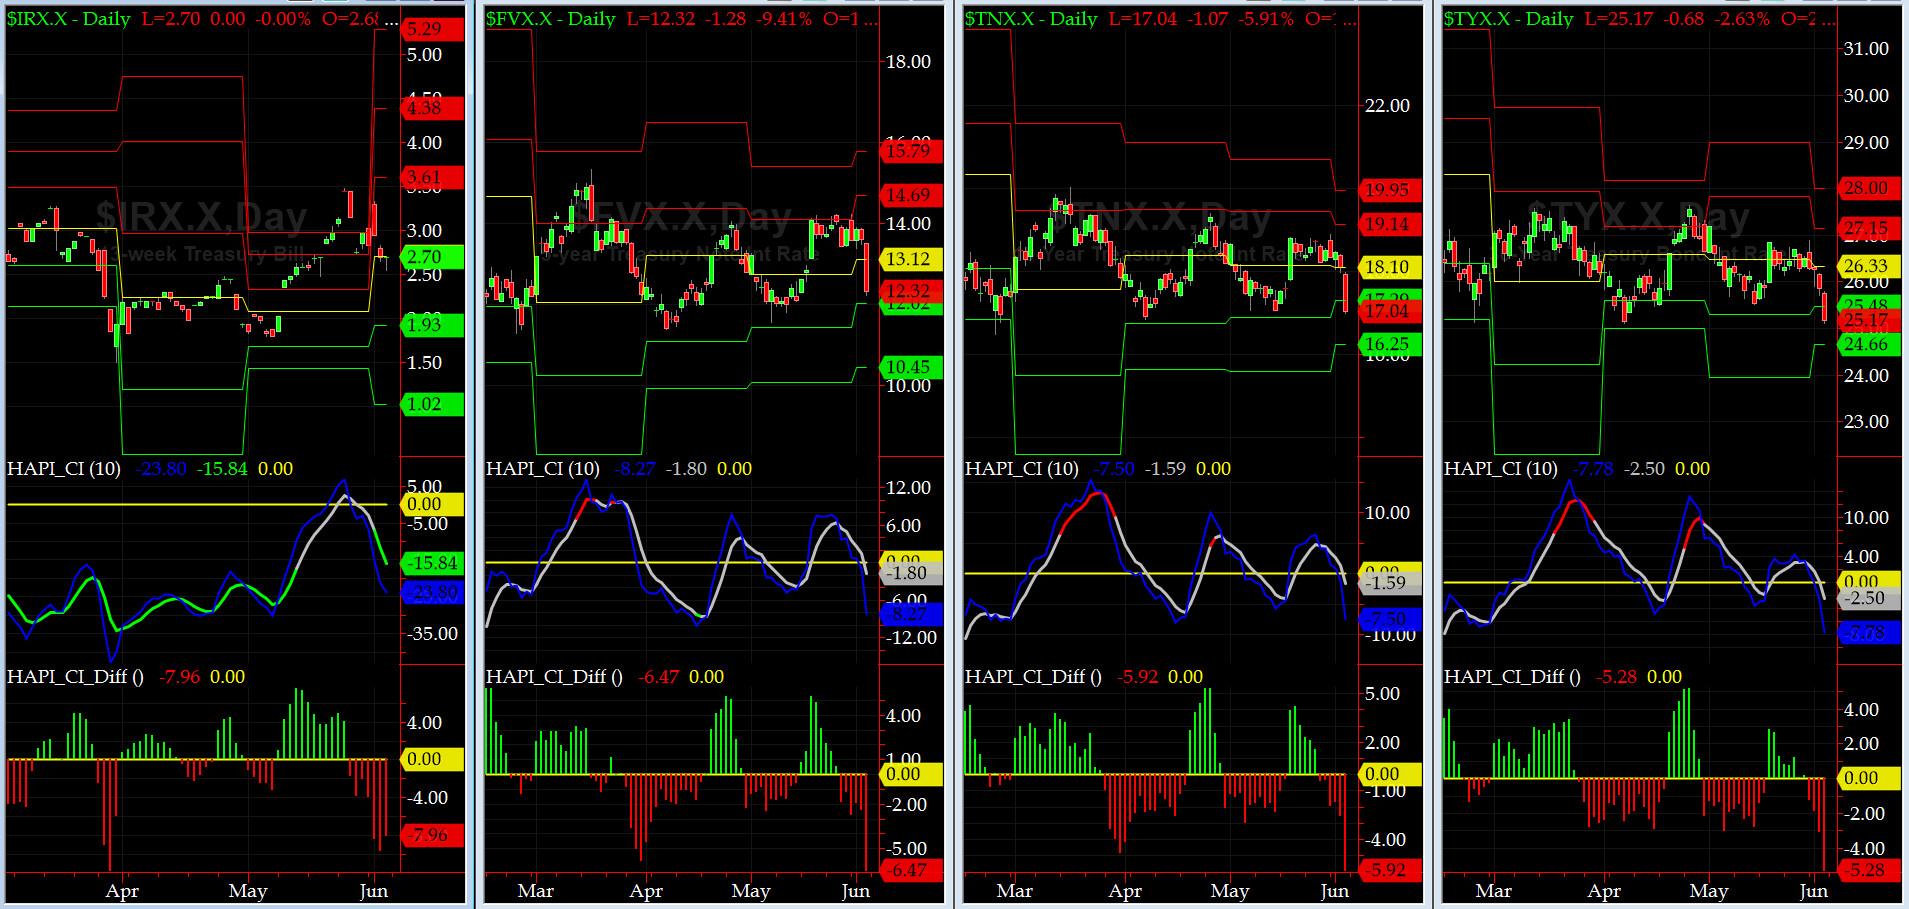
US Treasury T-Notes & T-Bonds Yields Chart
Mainly on Friday, but we also witnessed some on Thursday too, US Treasury Yield Curve got whacked as Treasury PRICES marched higher due very poor May NFP. The lower long end rates should help housing further.
Fari Hamzei
|


 Proactive Market Timing