
|
 |
 |
 |
 |
 |
 |
 |
 |
 Proactive Market Timing Proactive Market Timing
|
|
|
Most Recent PMT vs SPX Performance Chart

|
|
|
|
Tuesday, June 14, 2016, 2215ET
Updating a select number of Market Timing Charts
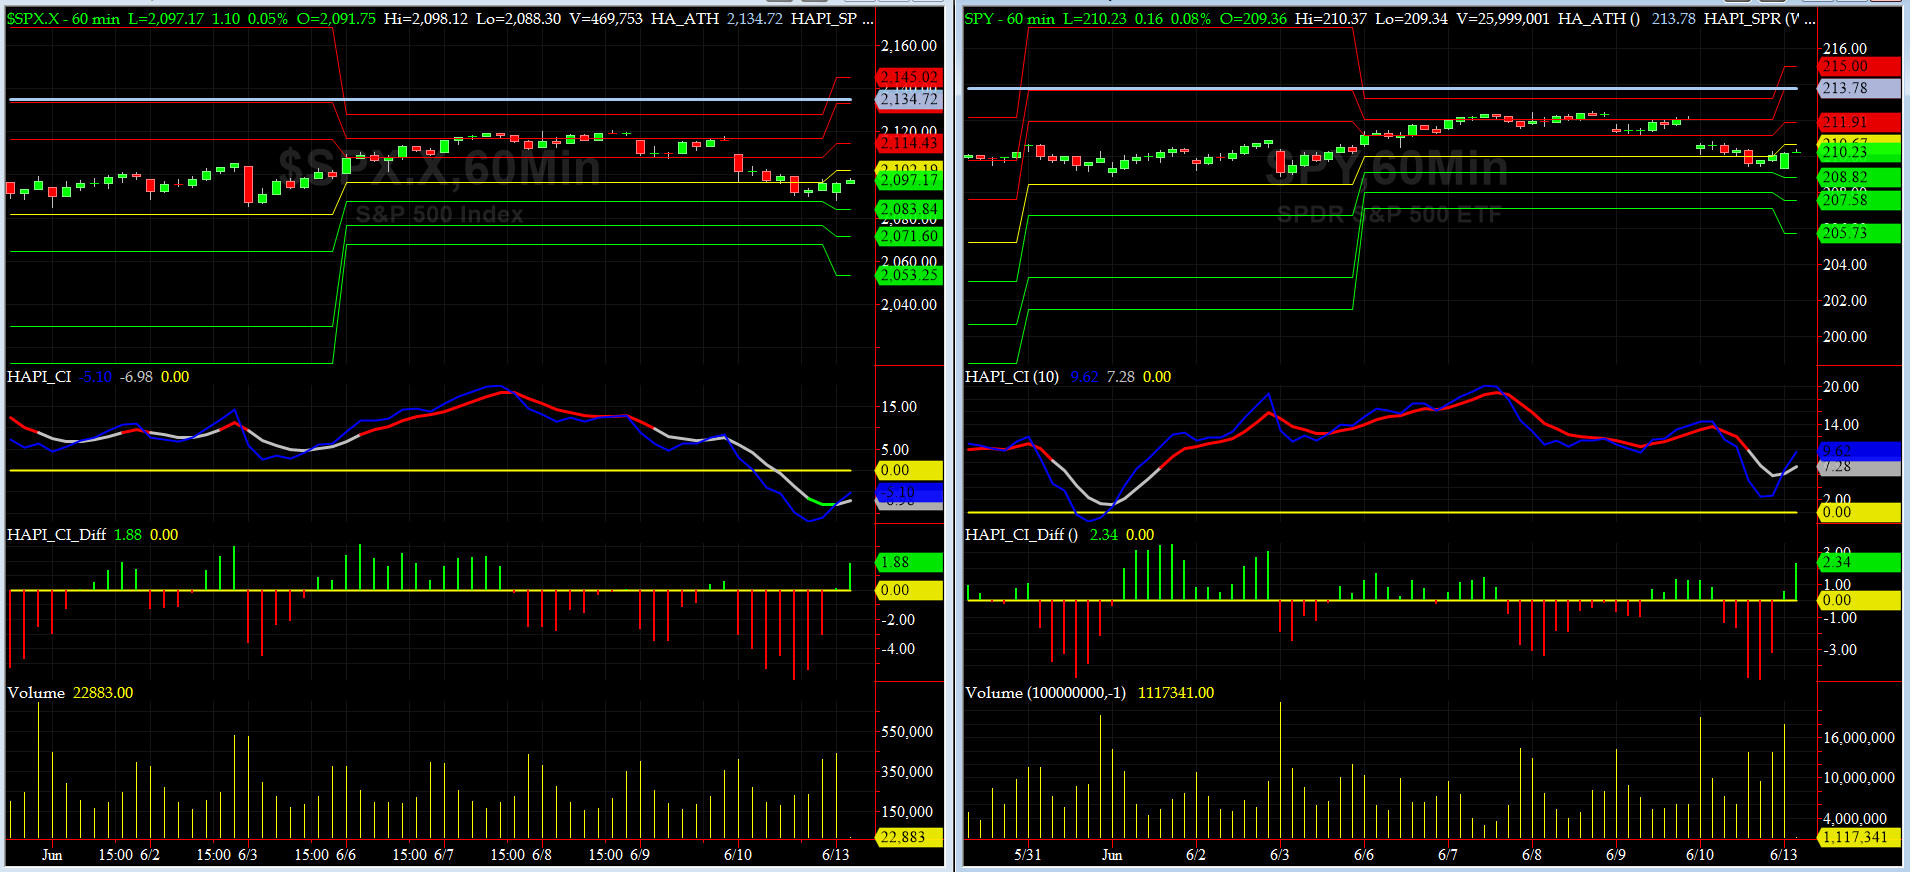
HA_SP1_momo Chart
Notice our DAILY Timing Model went SHORT SPX on the Close.
HA_SP2 Chart
HA_SP2 = 24.9 (Buy signal <= 25, Sell Signal >= 75)
At ~25 after reaching 81 last Wednesday, this indicator is heading into OverSold territory.
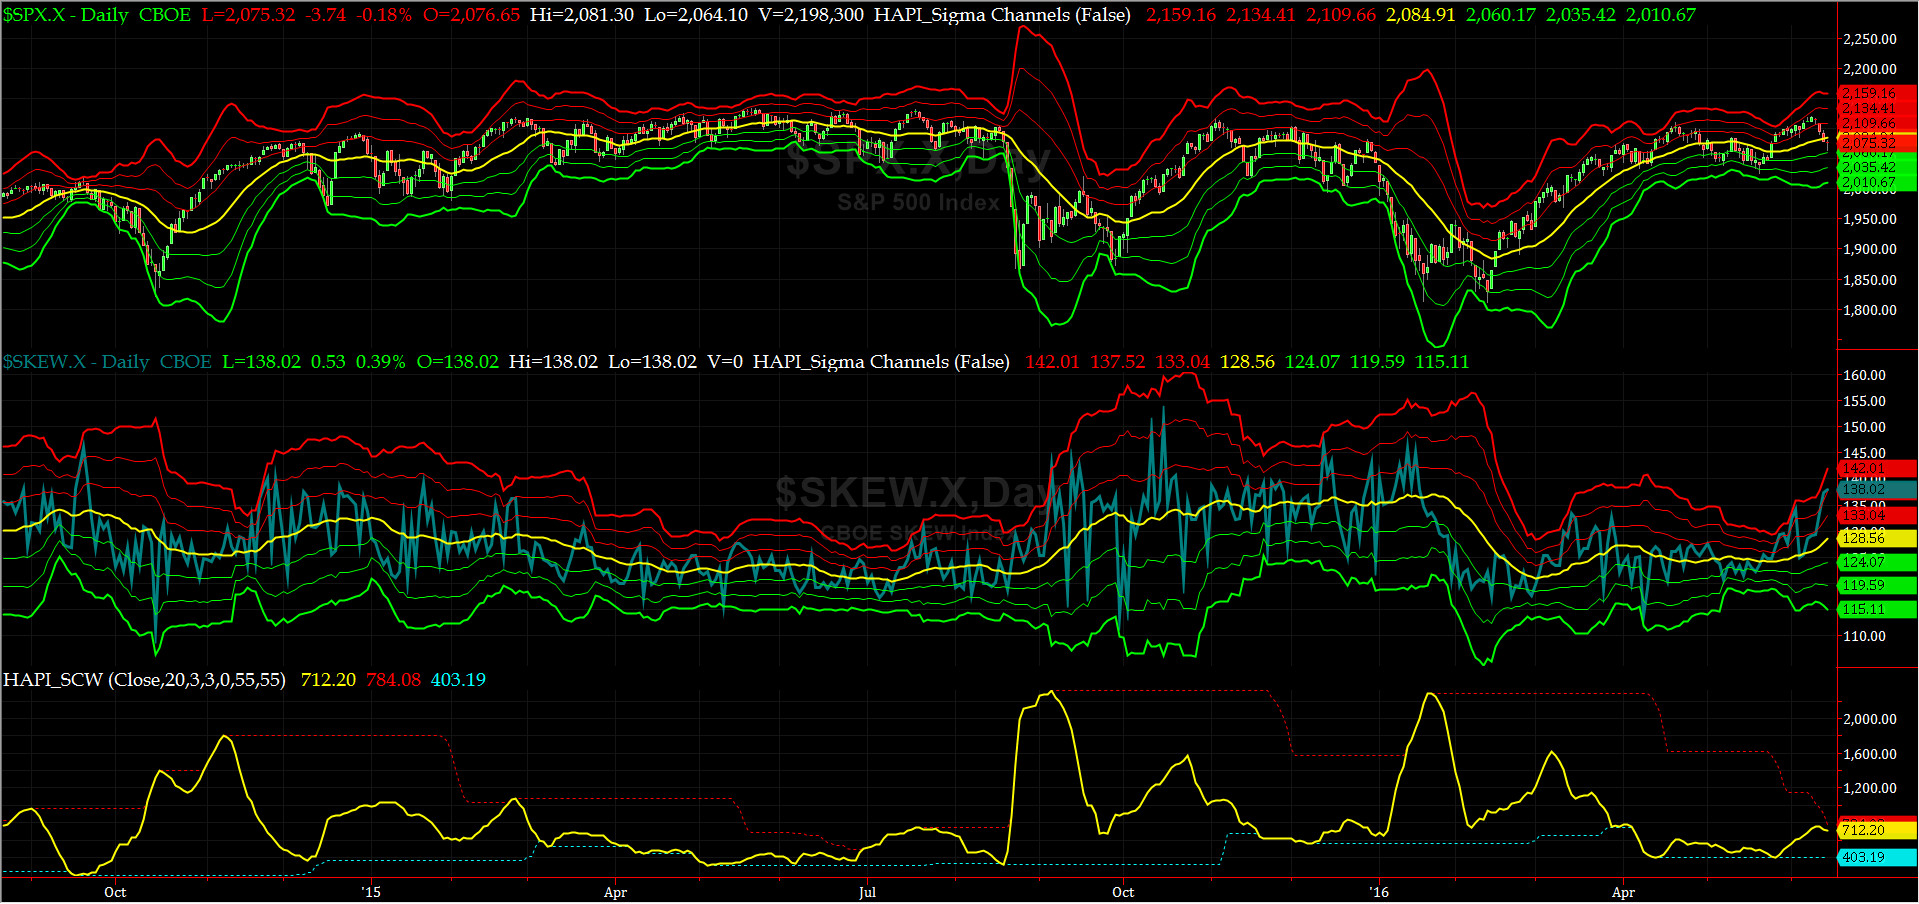
SPX SKEW (Tail Risk) Chart
SPX SKEW (Tail Risk) = 138 continued to rise to above its +2 sigma (normal = 120-125, range 100-150)
This is @Capt_Tiko's favorite chart (you need the best Albacore Tuna out there to properly visualize TailRisk).
All Quiet on the Mid-Western Front? We don't think so any more as SKEW's sigma channels are widening faster now. Pay attention Sailors, this is not Air National Guard.
Fari Hamzei
|
|
|
|
|
|
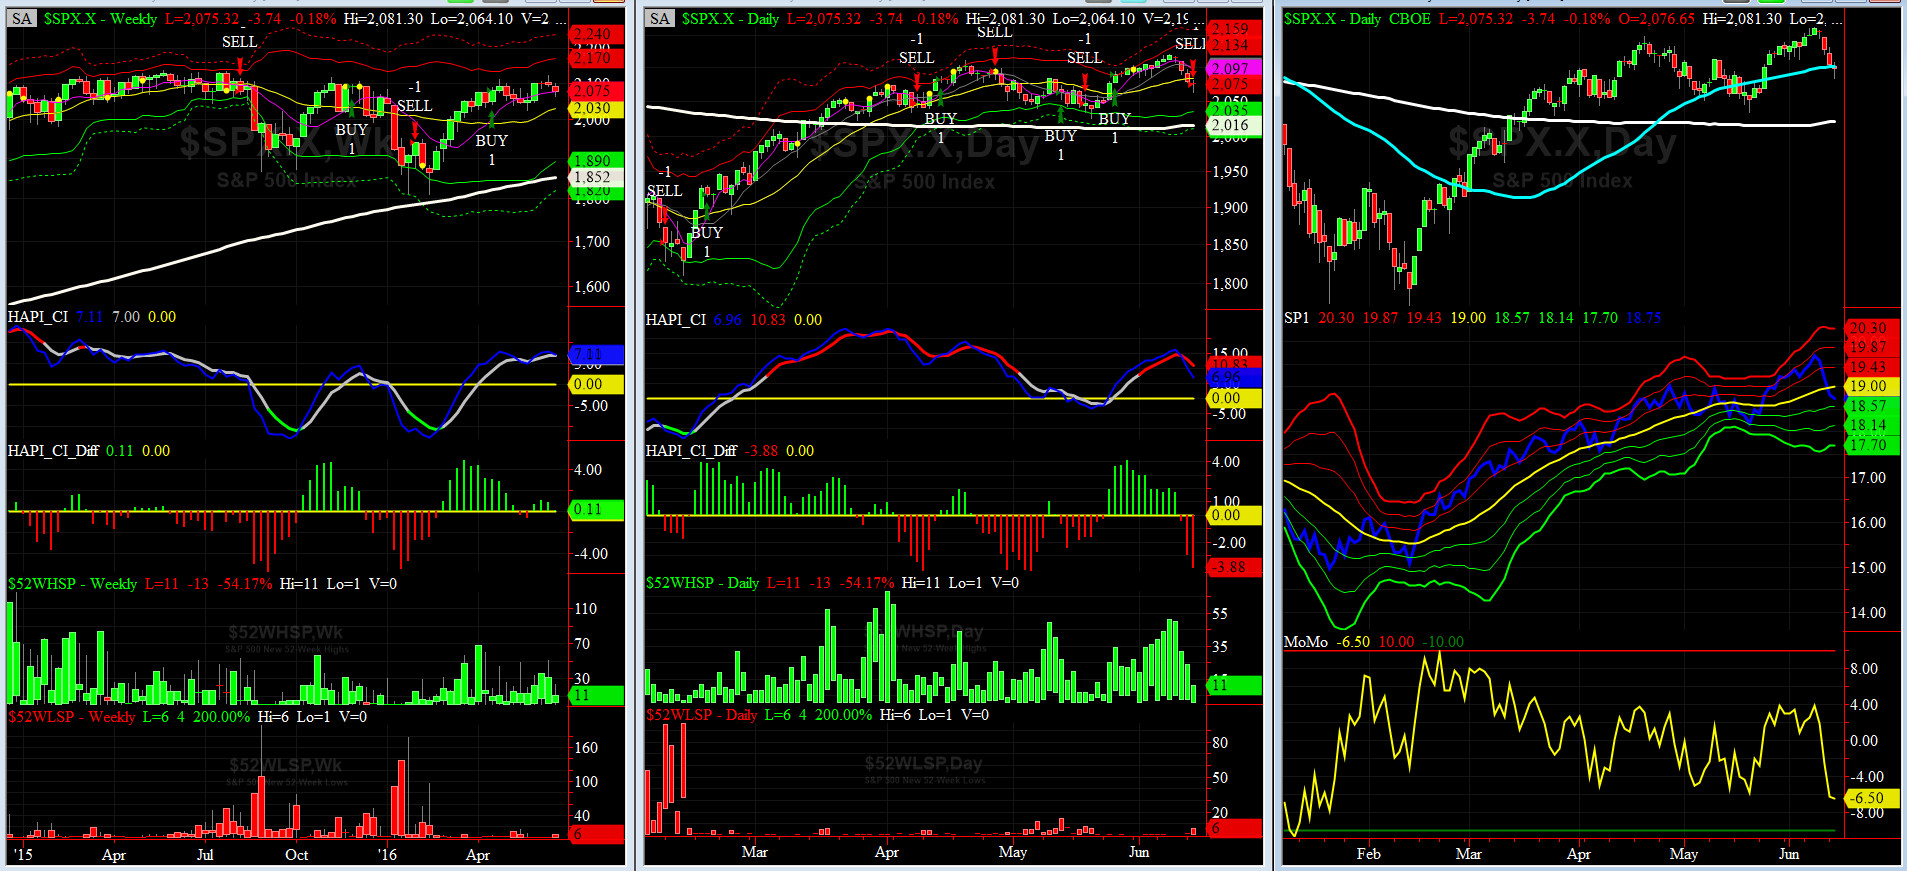
Monday, June 13, 2016, 1045ET
Companion Chart for Market Bias Review, Issue #146
|
|
|
|
|
|
Sunday, June 12, 2016, 1850ET
Market Bias, Issue #146
Our current Market Bias with Timer Digest is SHORT SPX as of Friday June 10 Close 2096.07
Our previous Market Bias was LONG SPX as of Monday April 18 Close at 2094.34
This WEEK�s Trade = SHORT the Market using SPX or SPY PutSpreads
SPX Profit Target = 2055-2030
SPX Money Management Stop = 2115
BOTTOM LINE: Last week we did not see new ATHs .... Brexit is on the agenda and last night we added home-brewed ISIL-inspired mass shooting in Orlando, FL. Terror premium will extract its toll from the market but should not be for long. Watch for AuntieJanet spin the poor econ data in her Wednesday Press Conf after the FOMC Meeting.
Note: Once one of our SPX targets is hit (Profit or Money Management), our Option/ETF trade for that week is over. Go to Cash and wait for the next PMT Issue.
Fari Hamzei
|
|
|
|
|
|
Sunday, June 12, 2016, 1745ET
New Analog Chart
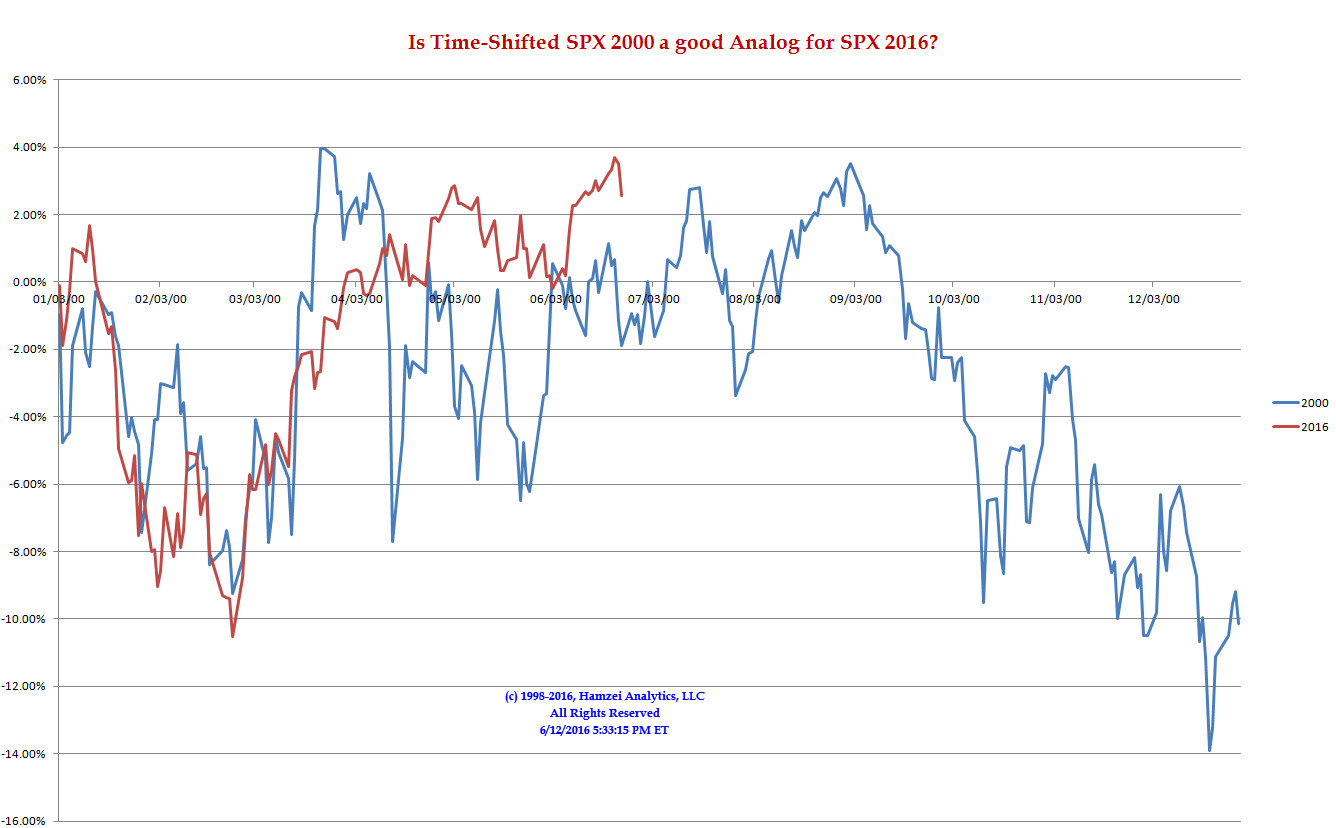
Time-Shifted SPX 2000 Analog for SPX 2016
CY 2000 was another presidential election year which an incumbent could not run. And of course, we have time-shifted the data a bit here. So far, we like what we see (correlation wise)!!
|
|
|
|
|
|
Saturday, June 11, 2016, 2115ET
Notice of Change of Market Bias with Timer Digest
Dear Jim,
Our trend-following Daily Timing Model is about a day away from going SHORT this great market of ours. As discussed before in our chatrooms, on Twitter and in our PMT package, our volume cycle study has been pointing to this coming Monday, +/- one trading day, as a cycle peak in prices. Additionally, our prop HA_momo indicator has had an unrelenting bearish divergence with our coveted SP1 prop indicator & SPX price since 22nd of February. Our DeTrender Charts for SPX & RUT are also giving strong bearish divergence signals��
Having studied tank battle strategies of Generals George Patton, Norman Schwarzkopf & Field Marshall Erwin Rommel in my early youth, I believe now is the right time to shift our strategy, and for next few days to two weeks, prosecute this war with a pre-emptive strike.
Therefore, we are going SHORT SPX as of Friday�s Close at 2096.07.
Cheers���
Fari Hamzei
|
|
|
|
|
|
Saturday, June 11, 2016 1730ET
Market Timing Charts, Analysis & Commentary for Issue #146
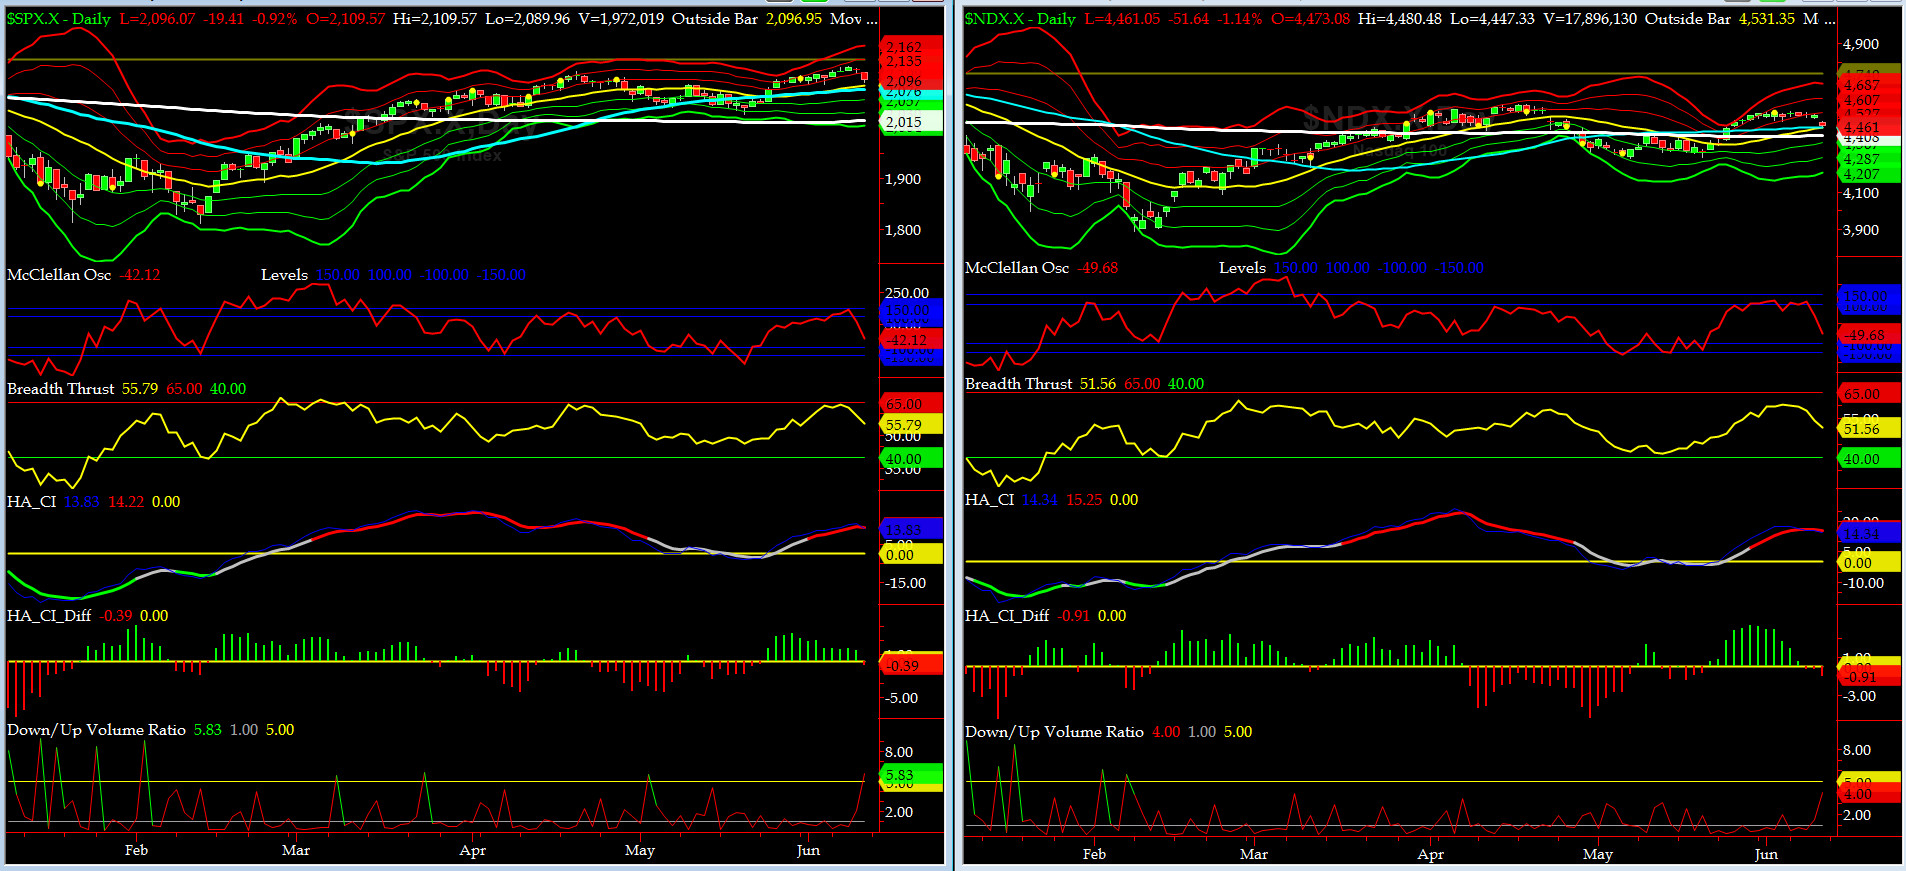
Timer Charts of S&P-500 Cash Index (SPX) + NASDAQ-100 Cash Index (NDX)
Most recent S&P-500 Cash Index (SPX): 2096.07 down -3.06 (down -0.1%) for the week ending on Friday, June 10th, 2016, which closed above its 1/2 sigma.
SPX ALL TIME INTRADAY HIGH = 2134.72 (reached on Wednesday, May 20th, 2015)
SPX ALL TIME CLOSING HIGH = 2130.82 (reached on Thursday, May 21st, 2015)
Current DAILY +2 Sigma SPX = 2135 with WEEKLY +2 Sigma = 2167
Current DAILY 0 Sigma (20 day MA) SPX = 2083 with WEEKLY 0 Sigma = 2023
Current DAILY -2 Sigma SPX = 2030 with WEEKLY -2 Sigma = 1880
NYSE McClellan Oscillator = -42 (-150 is start of the O/S area; around -275 to -300 area or lower, we go into the �launch-pad� mode, over +150, we are in O/B area)
NYSE Breadth Thrust = 56 (40 is considered as oversold and 65 as overbought)
As discussed/targeted last week, SPX made multi-month highs, at least at the margin. Brexit became an issue on Friday and we should get a tad defensive. Admiral & I peeled off some Long ETF Call Spreads we had on in our portfolio in last two weeks.... and our timing could not have been better....or was it our luck?
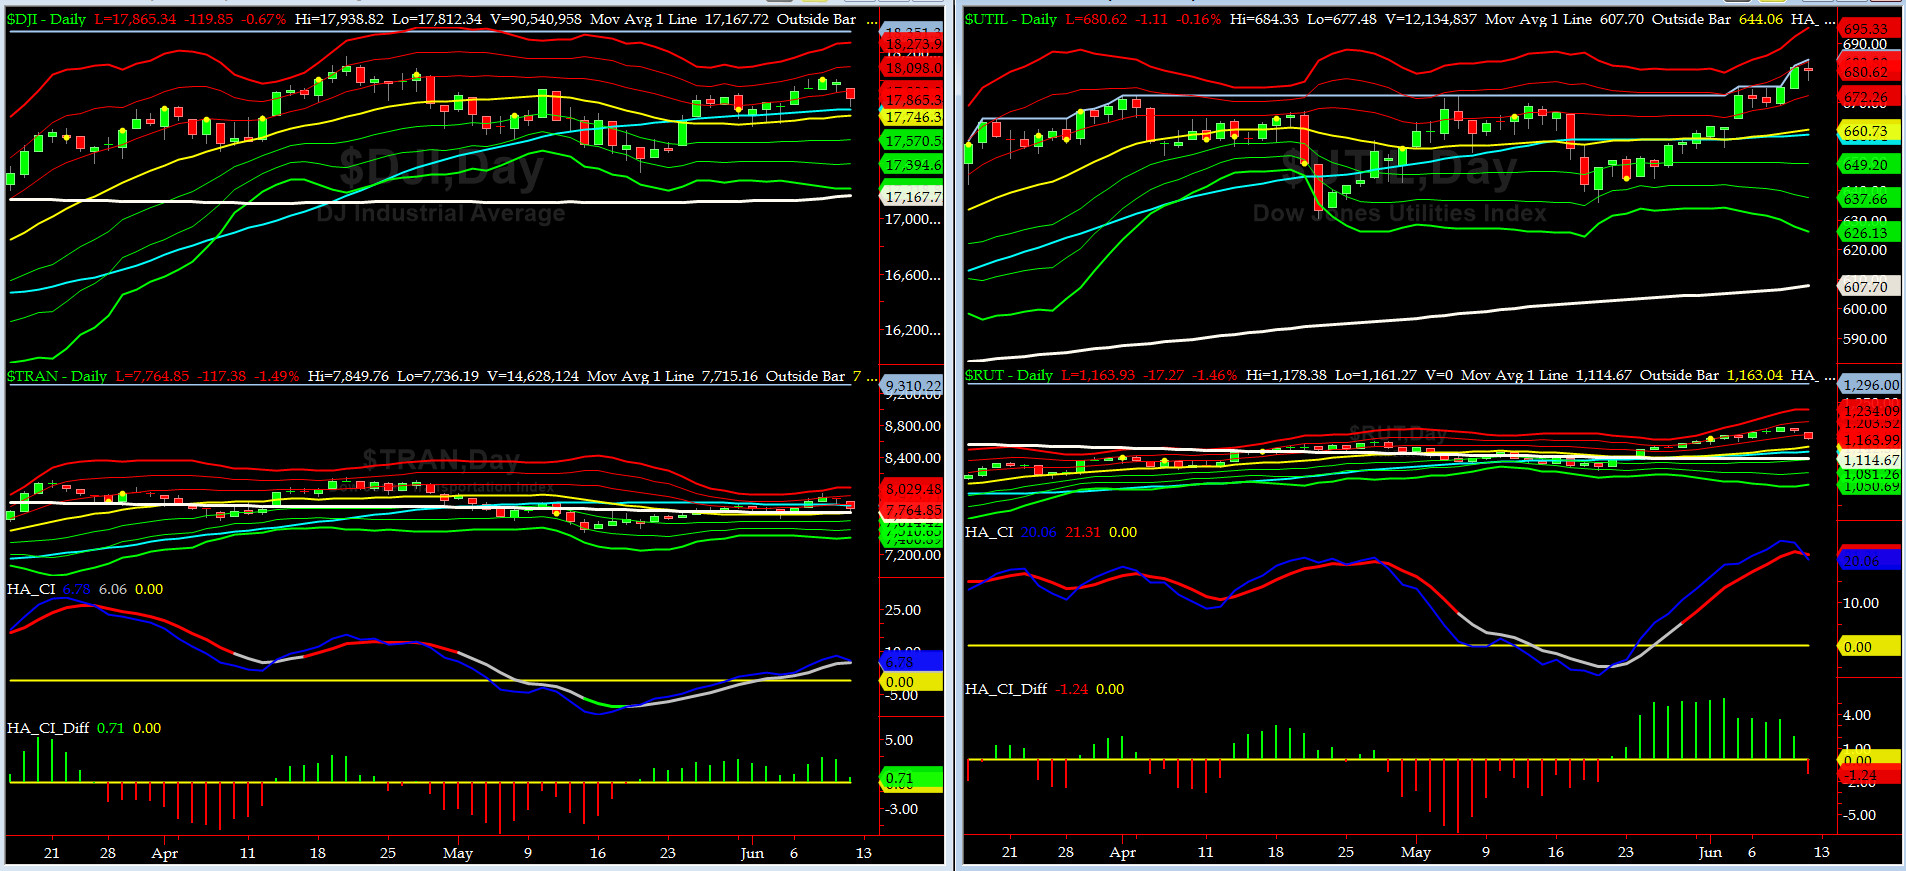
Canaries [in the Coal Mine] Chart for DJ TRAN & RUT Indices
200-Day MA DJ TRAN = 7715 or 0.6% below DJ TRAN (max observed in last 5 yrs = 20.2%, min = -20.3%)
200-Day MA RUT = 1115 or 4.4% below RUT (max observed in last 5 yrs = 21.3%, min = -22.6%)
DJ Transports (proxy for economic conditions 6 to 9 months hence) ended up flat for the week.
Russell 2000 Small Caps (proxy for RISK ON/OFF) pulled back after hitting 1190 print (our target was: "watch for 1195-1200 area").
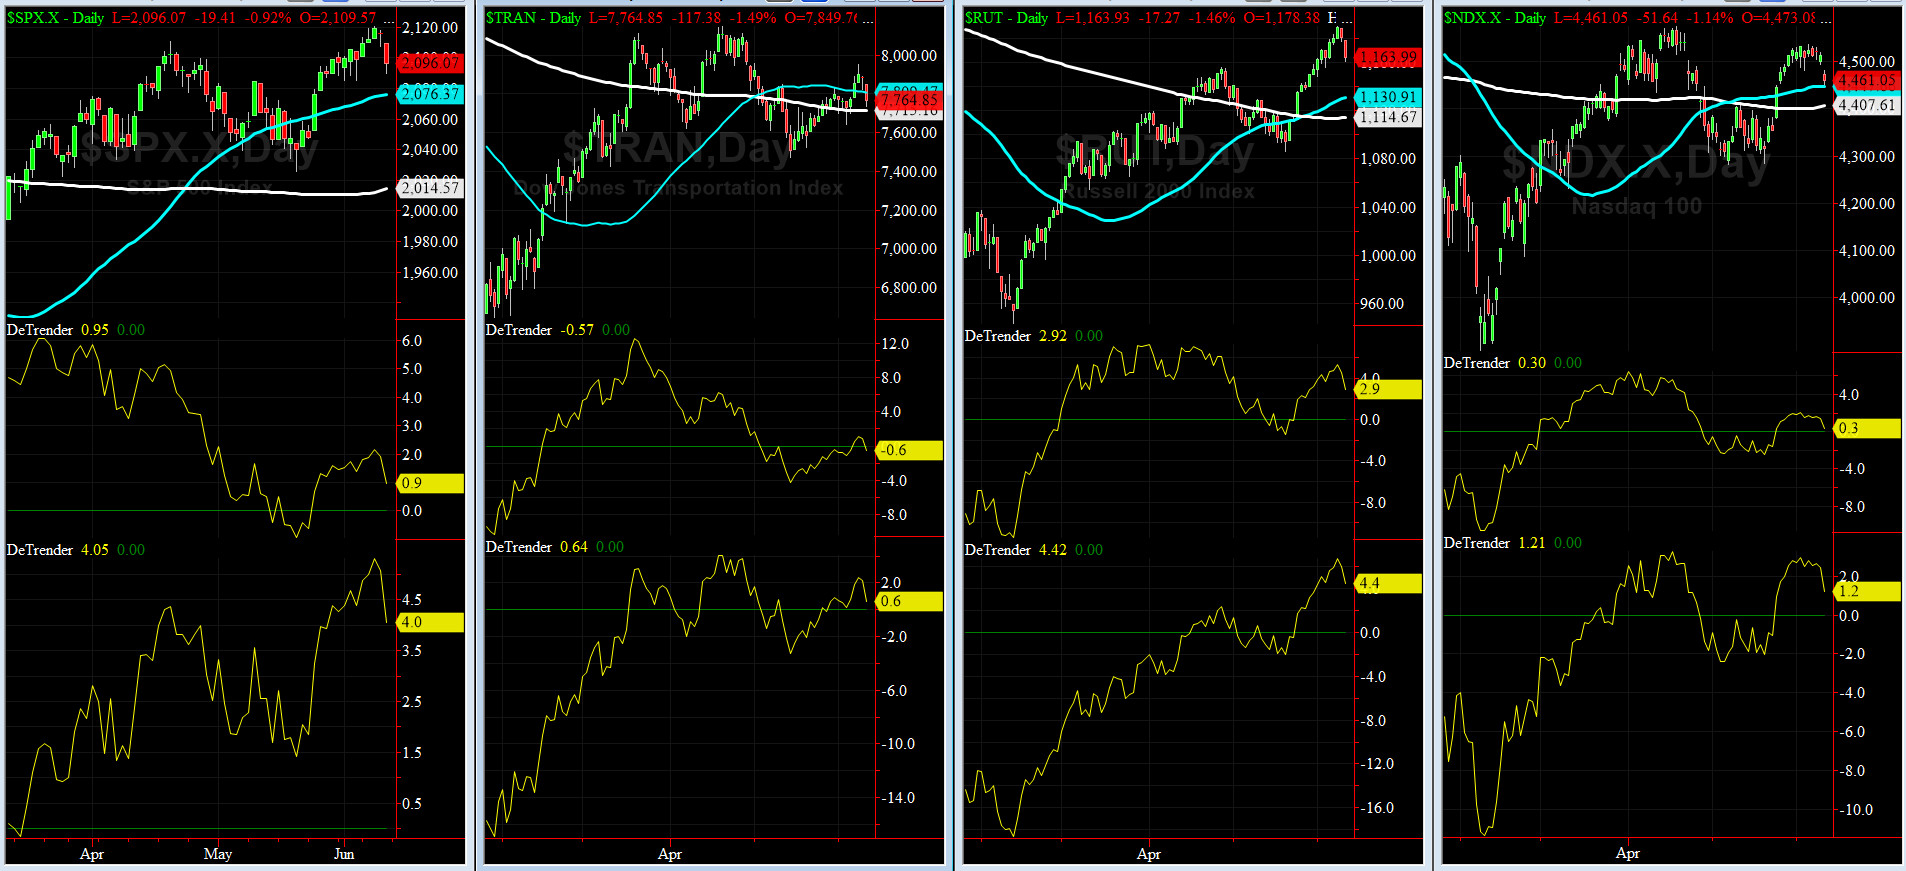
DeTrenders Charts for SPX, NDX, TRAN & RUT Indices
50-Day MA SPX = 2076 or 0.9% below SPX (max observed in last 5 yrs = +8.6%, min = -9.3%)
200-Day MA SPX = 2015 or 4.0% below SPX (max observed in last 5 yrs = 15.2%, min = -14%)
Again, this week, SEVEN of our Eight DeTrenders again remained POSITIVE. DeTrender for RUT, again, is worth watching this week.
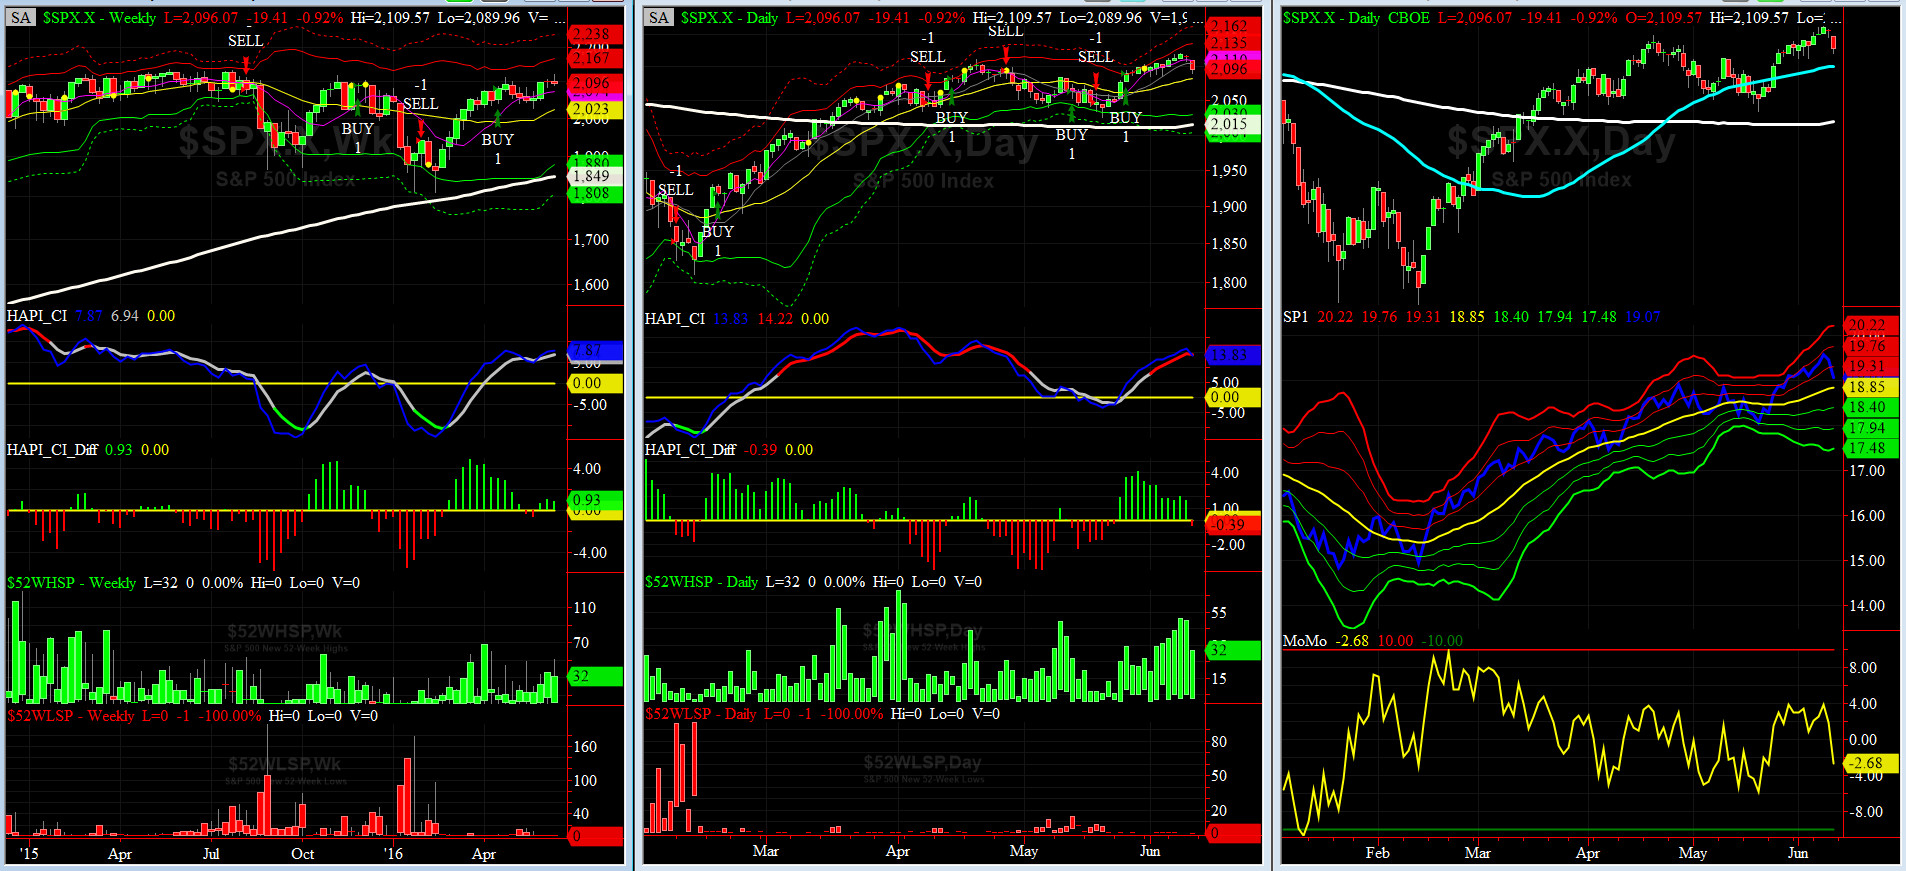
HA_SP1_momo Chart
WEEKLY Timing Model = on a BUY Signal since Friday 4/15/16 CLOSE
DAILY Timing Model = on a BUY Signal since Wednesday 5/25/16 CLOSE
Max SPX 52wk-highs reading last week = 51 (over 120-140, the local maxima is in)
Max SPX 52wk-Lows reading last week = 1 (over 40-60, the local minima is in)
HA_SP1 = at about its zero sigma channels
HA_Momo = -2.7(reversals most likely occur above +10 or below -10)
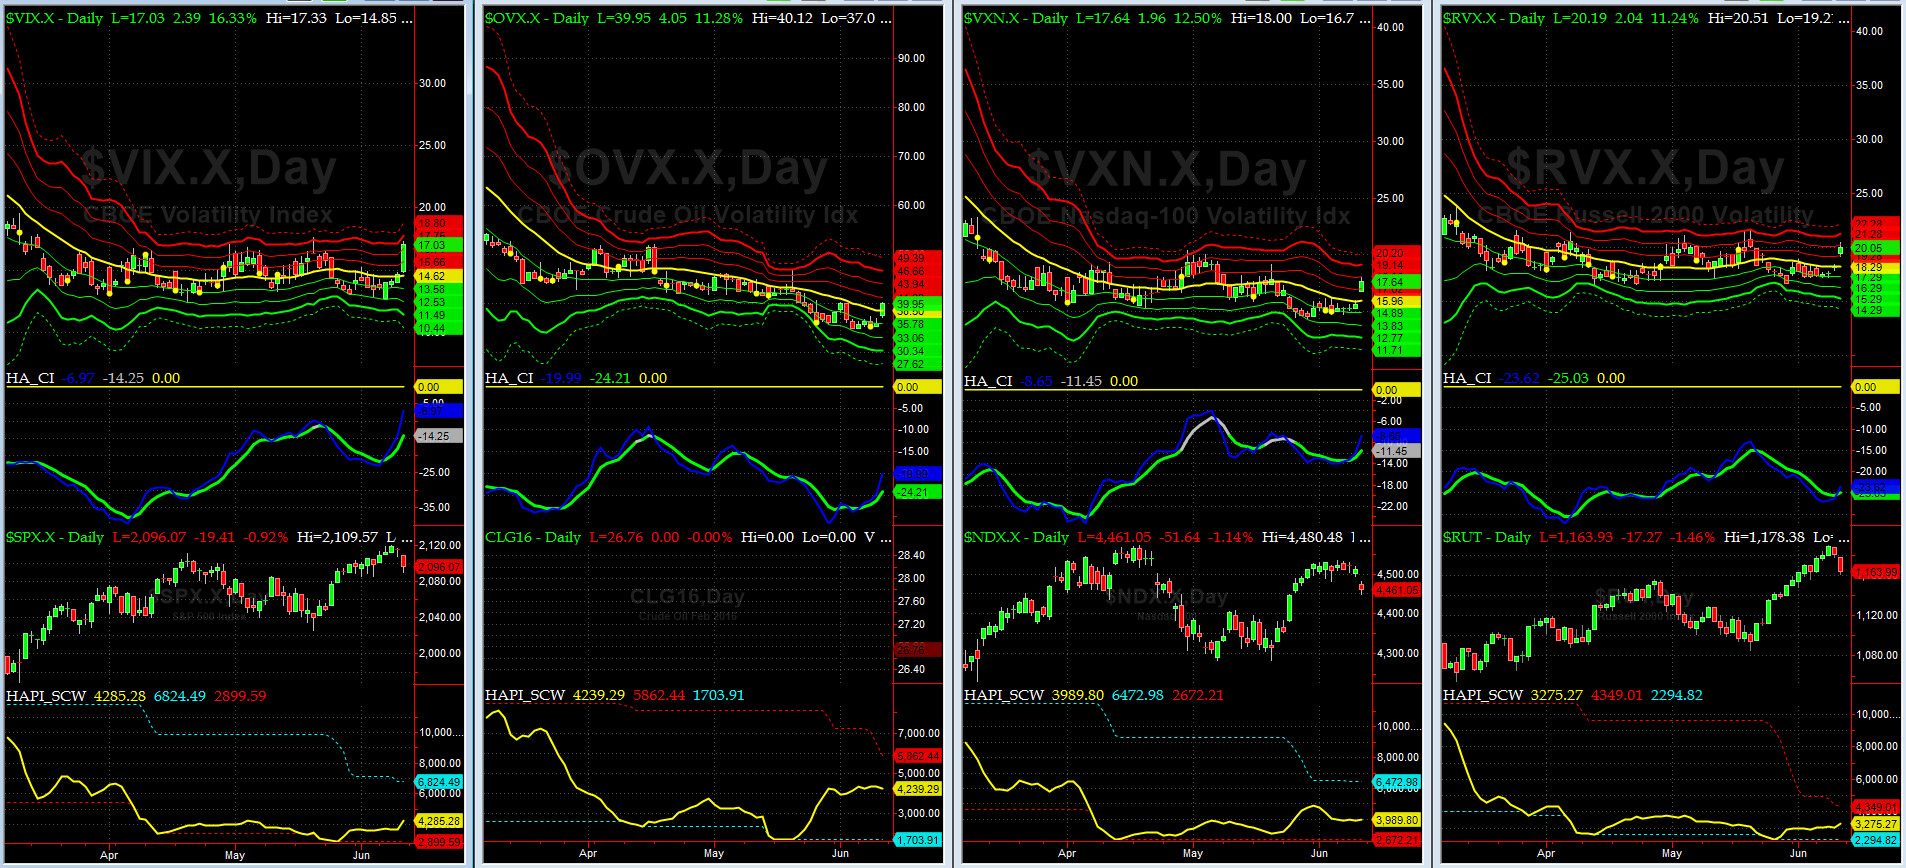
Vol of the Vols Chart
VIX = 17.03 is now at +2.5 sigma (remember it�s the VIX�s vol pattern (its sigma channels) that matters, and not the level of VIX itself (this is per Dr. Robert Whaley, a great mentor and the inventor of original VIX, now called VXO). VIX usually peaks around a test of its +4 sigma).
These days we are most focused on OVX (Crude Oil Vol). On Friday, after July WTI hit @Capt_Tiko's target of 51.60, it sank by 5.4% (must be the Albacore Tuna he loves so much... GOT TUNA?). And, OVX, for the first time in 2 months, crossed its zero sigma !!
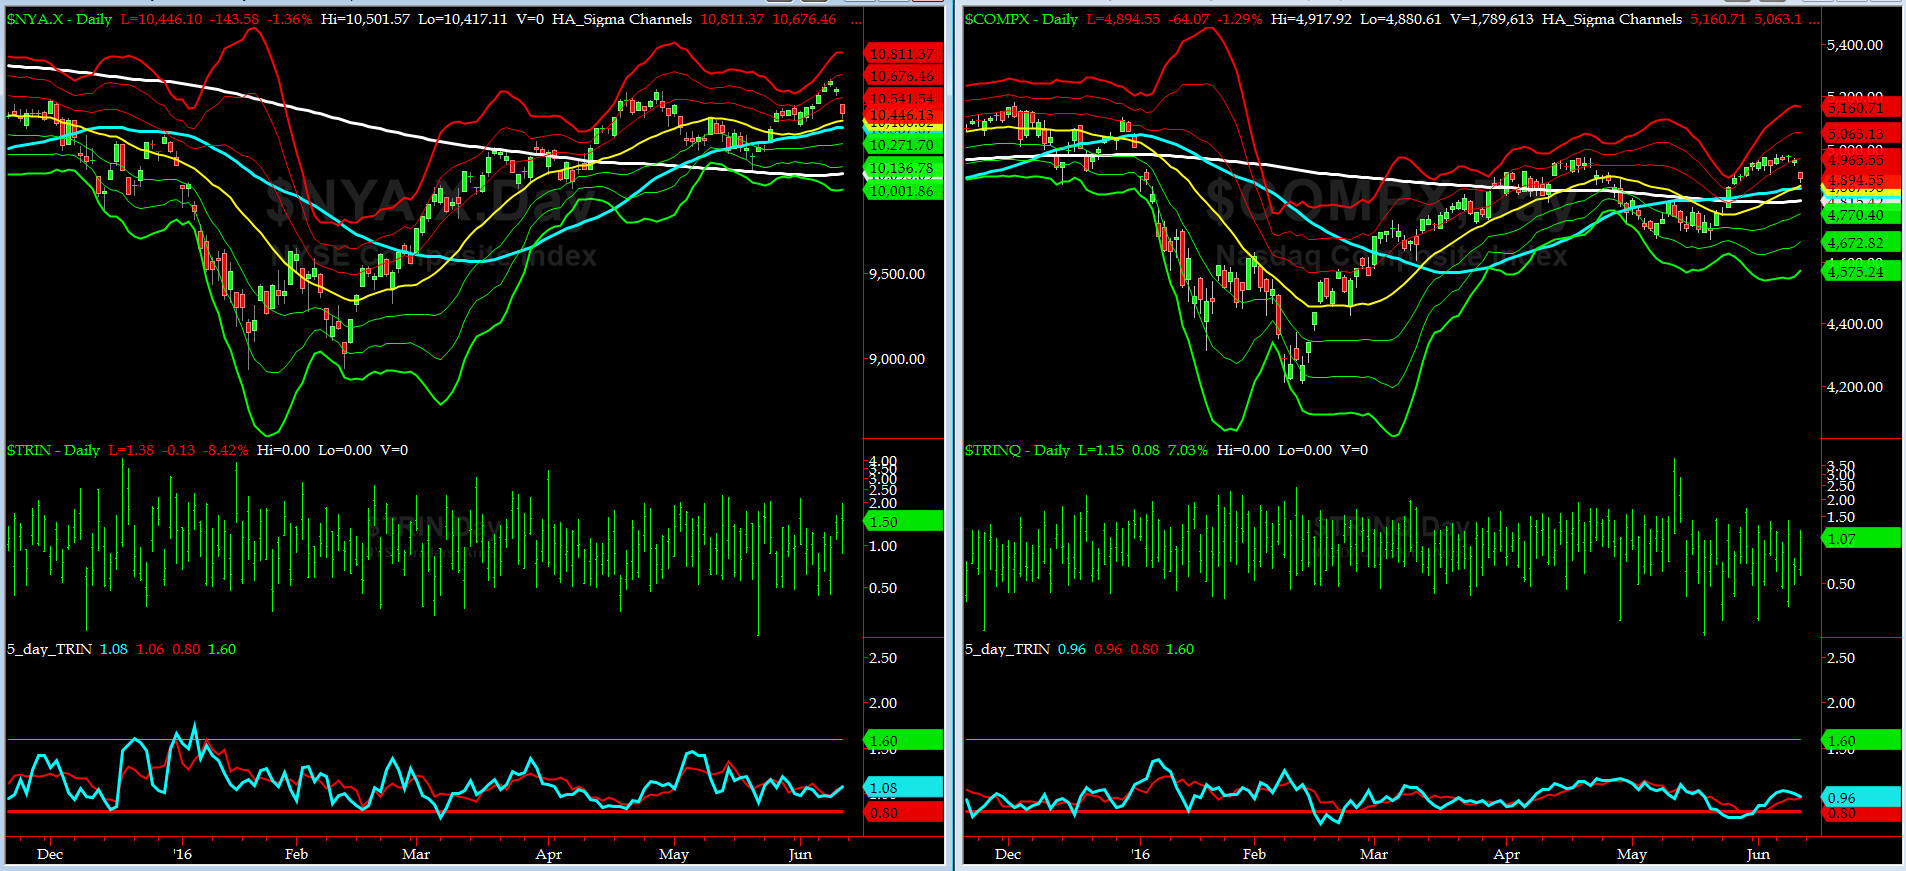
5-day TRIN & TRINQ Charts
Again, NO SIGNAL HERE........
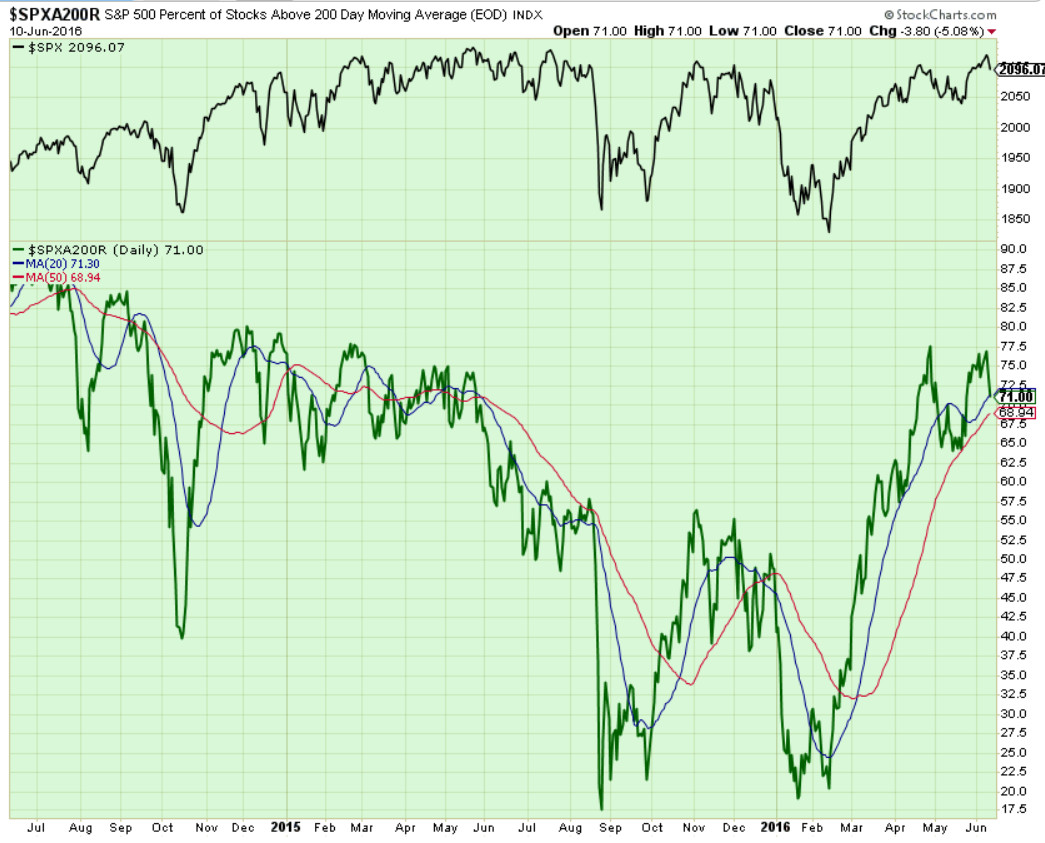
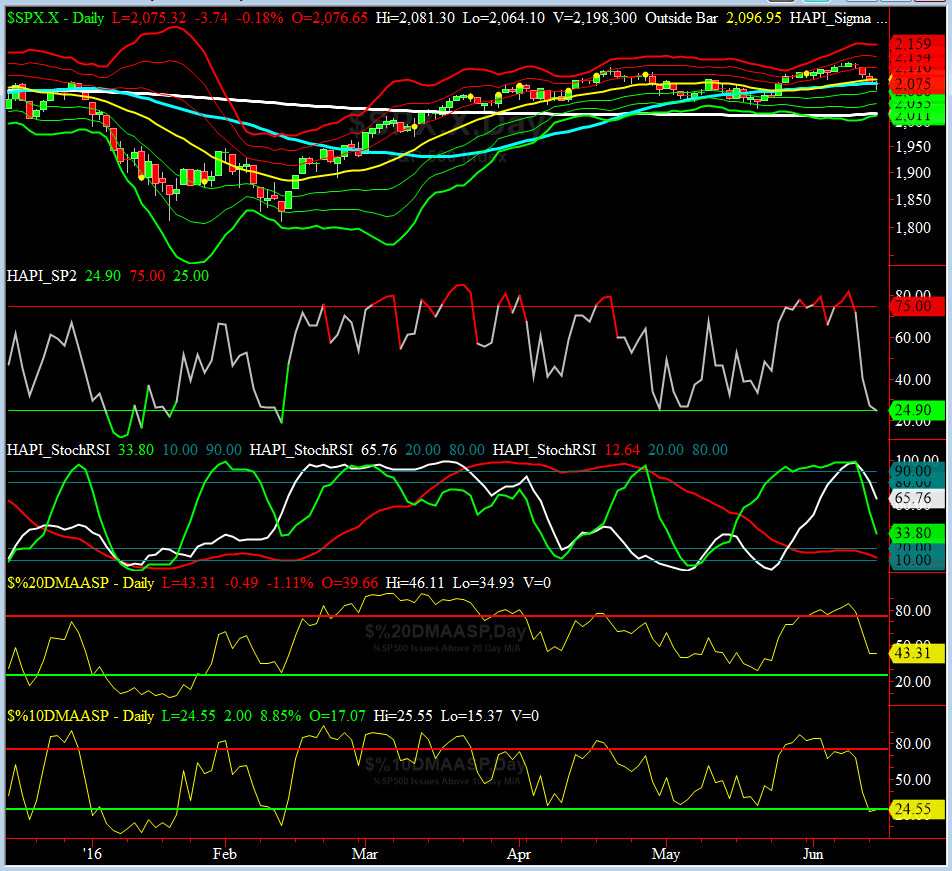
Components of SPX above their respective 200day MA Chart
This scoring indicator is stuck at 75%. What is next? Most likely a bit of easing off before we head up higher again.
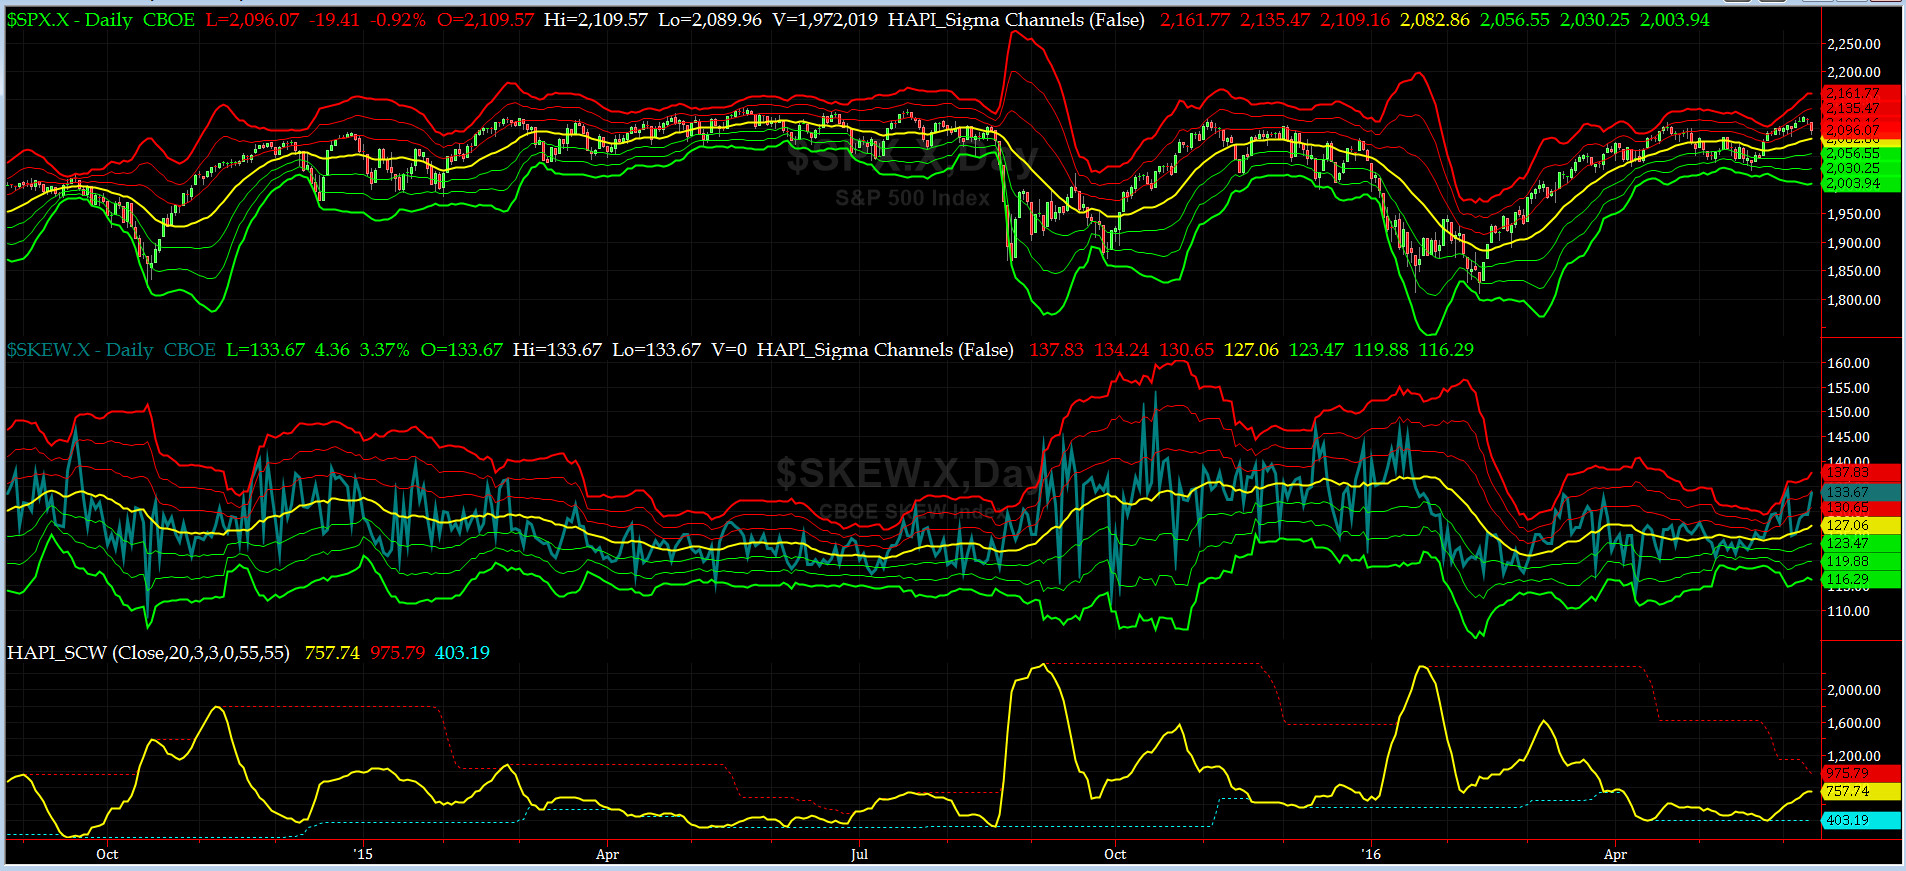
SPX SKEW (Tail Risk) Chart
SPX SKEW (Tail Risk) = rose to 133 and very near its +2 sigma again (normal = 120-125, range 100-150)
All Quiet on the Mid-Western Front? No mas.... SKEW's sigma channels are opening up and its zero sigma line has a positive slope. Pay attention Sailors, this is not Air National Guard.
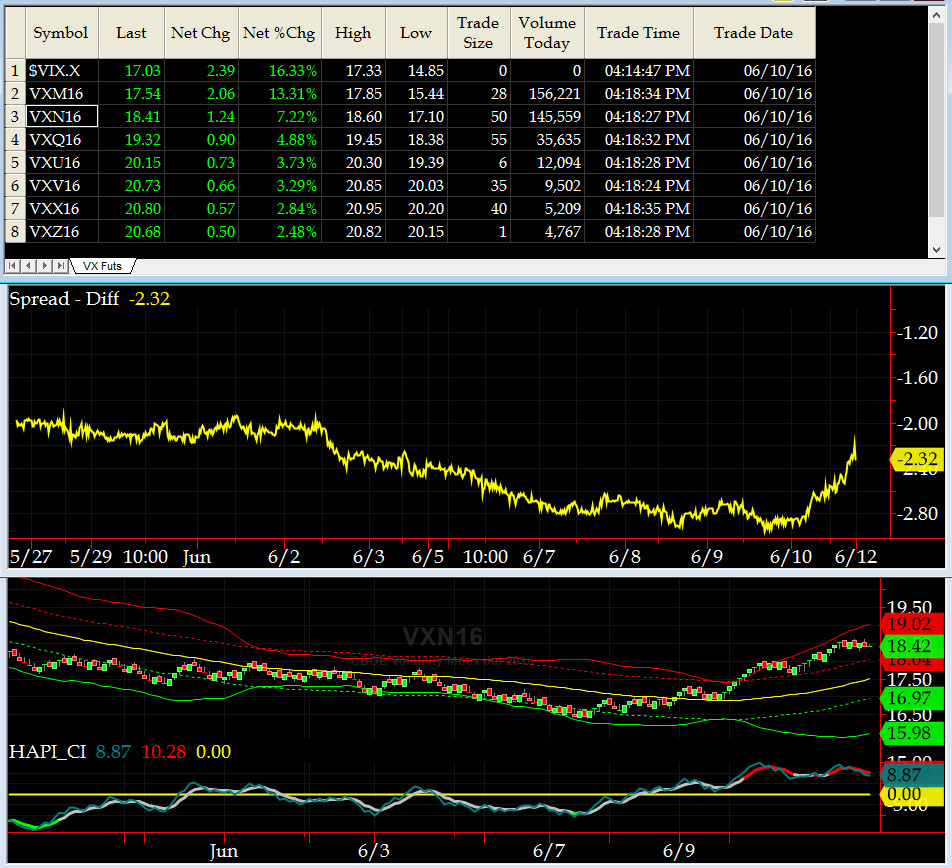
3-month VIX Futures Spread(VX) Chart
Our 3-month VIX Futures Spread (LONG JUL16 & SHORT OCT16) closed at -2.32 on Friday. Market finally pulled from its latest local maxima.
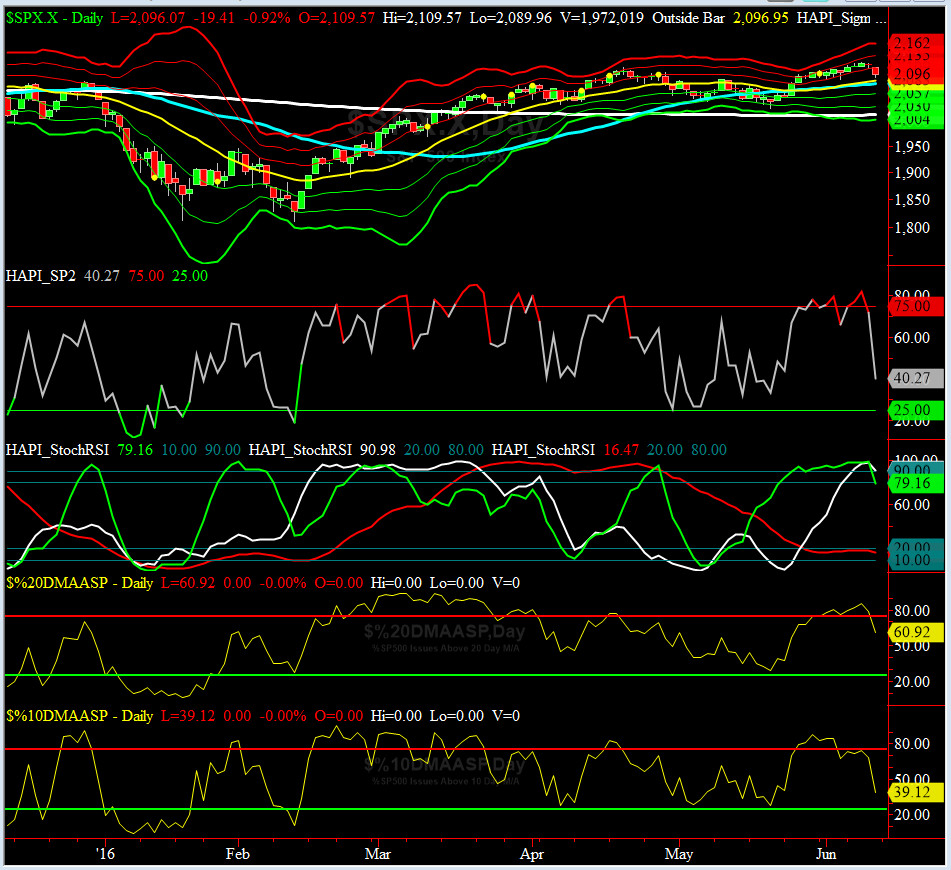
HA_SP2 Chart
HA_SP2 = 40 (Buy signal <= 25, Sell Signal >= 75)
At ~40 after hitting 81, this prop indicator is saying: ROTATE now now now!
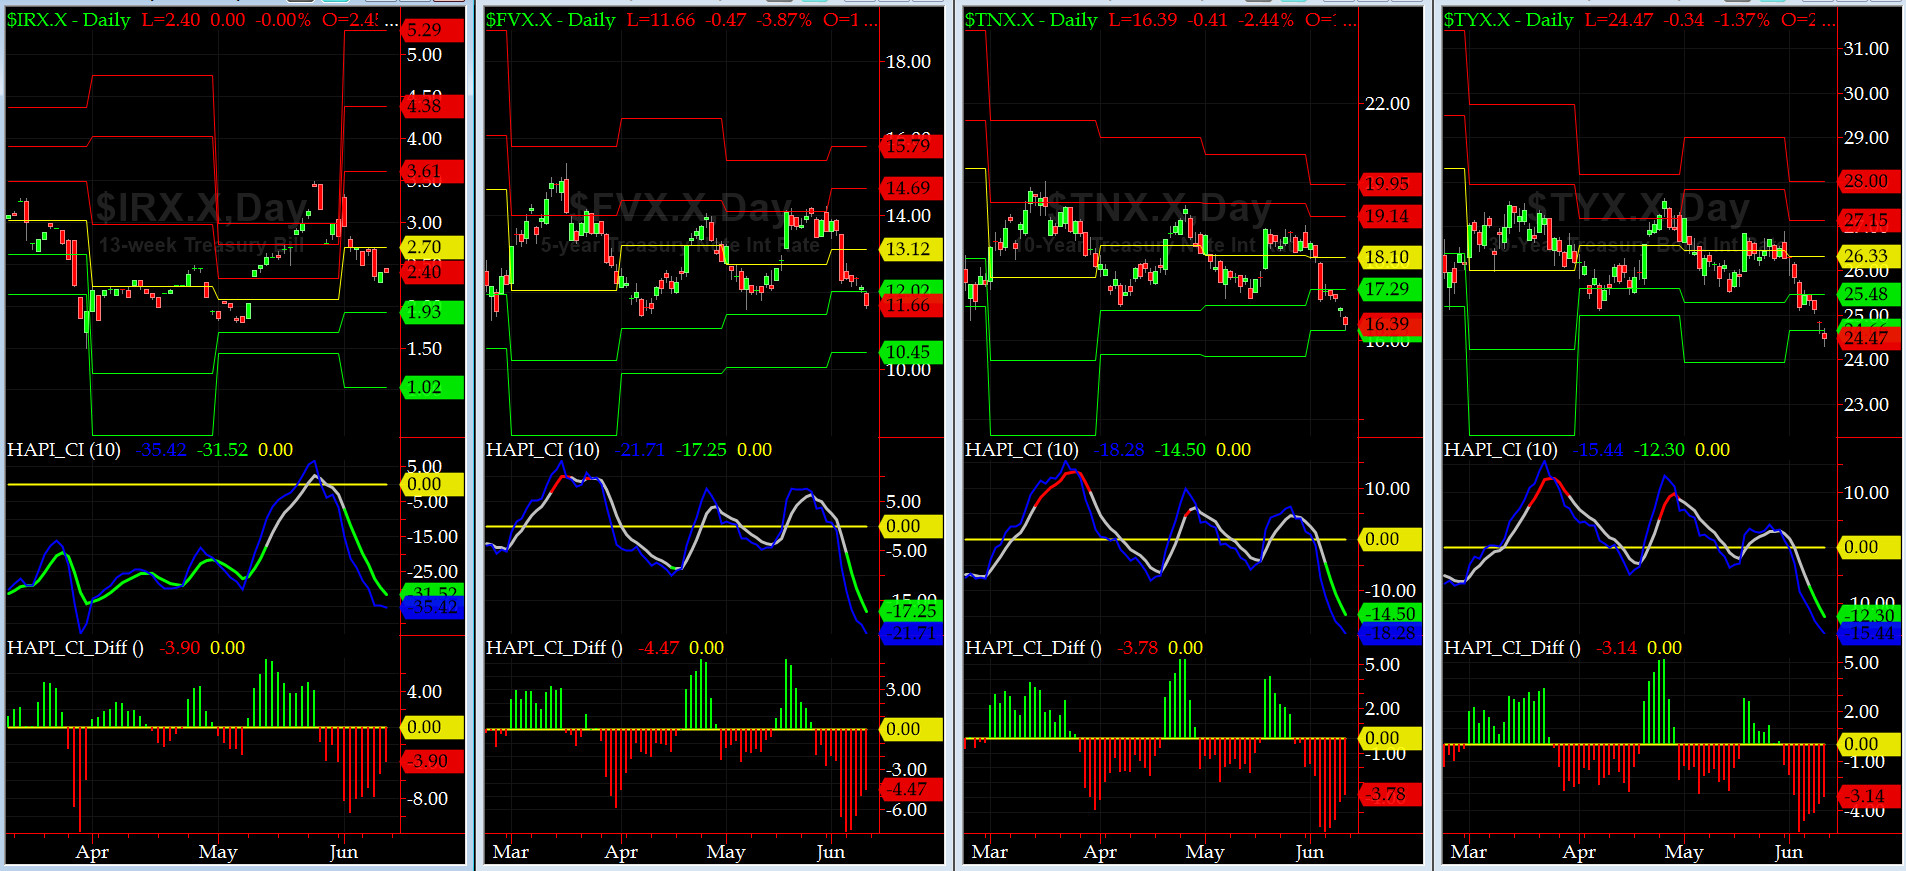
US Treasury T-Notes & T-Bonds Yields Chart
Starting on Thursday and continued into Friday, US Treasury Yield Curve got whacked again as Treasury PRICES marched higher, mainly due to Brexit polls.
Fari Hamzei
|
|
|
|
|
|
Customer Care:
|
|
|
|
|
|
|
 |
 |
|
 |
|
 |
 |
 |
HA YouTube Channel ::: HA Blog ::: Testimonials ::: Tutorials & FAQs ::: Privacy Policy
|
Trading Derivatives (Options & Futures) contains substantial risk and is not for every investor. An investor could potentially lose all or more than his/her initial investment.
Only risk capital should be used for trading and only those with sufficient risk capital should consider trading derivatives. Past performance is not
necessarily indicative of future results. Testimonials appearing on this website may not be representative of other clients or customers
and are not a guarantee of future performance or success.
|
| (c) 1998-2025, Hamzei Analytics, LLC.® All Rights Reserved. |
|
|