|
Saturday, June 18, 2016 0945ET
Market Timing Charts, Analysis & Commentary for Issue #147
Timer Charts of S&P-500 Cash Index (SPX) + NASDAQ-100 Cash Index (NDX)
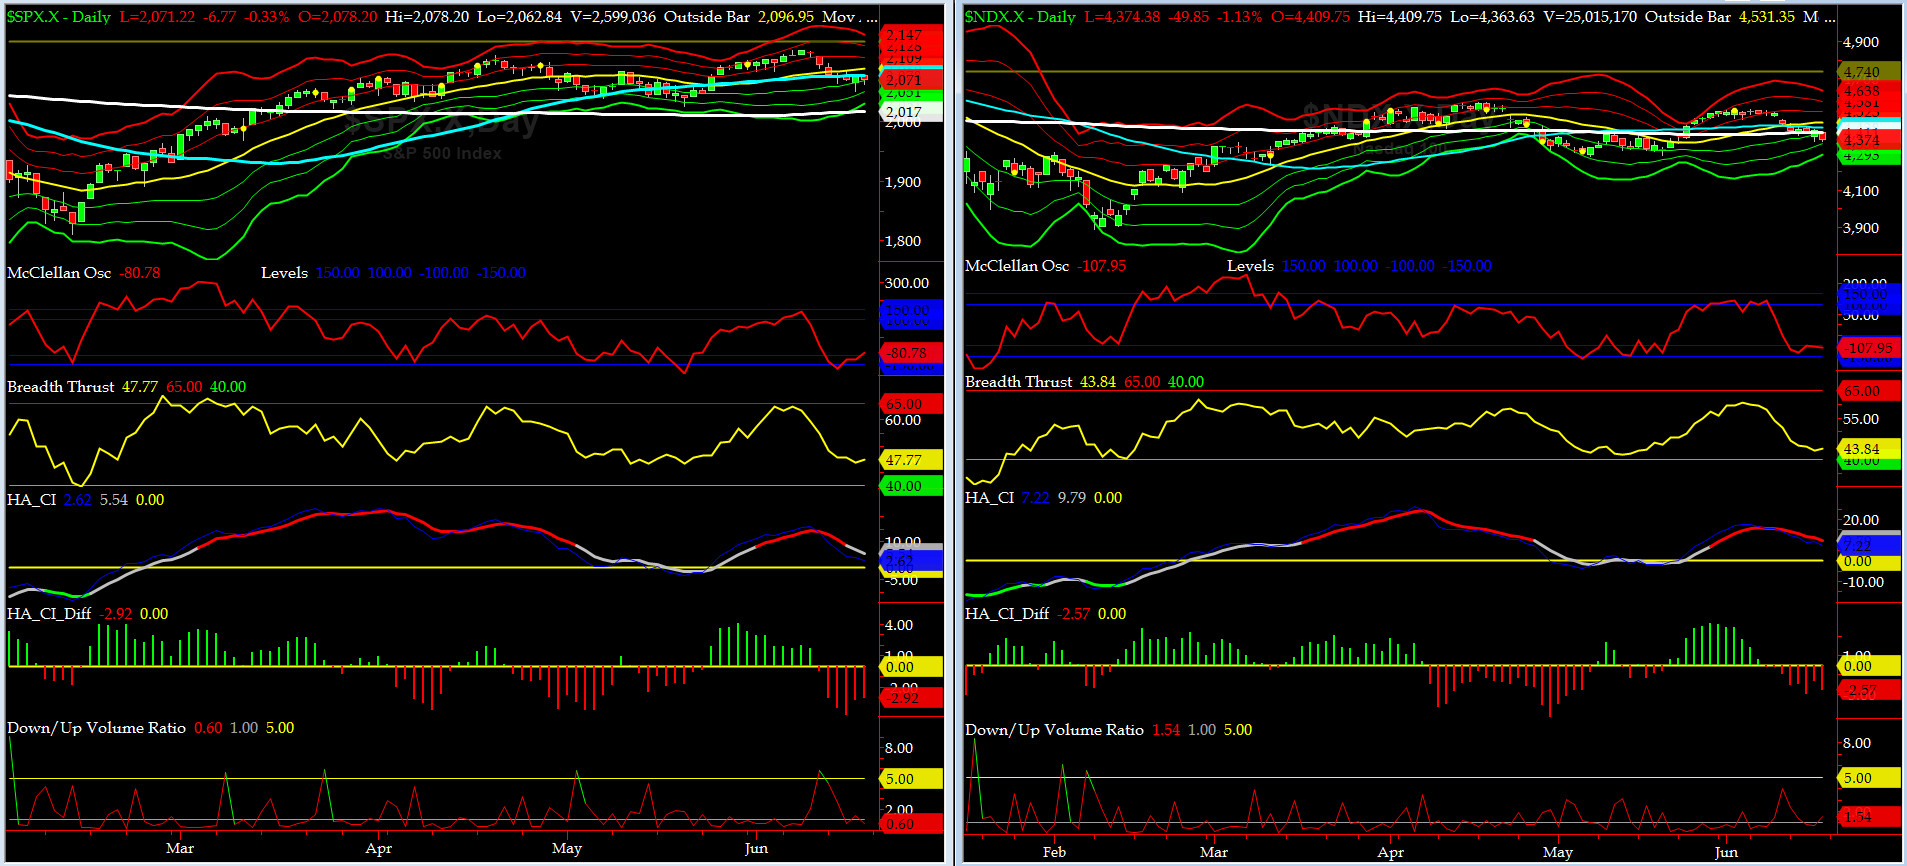
Most recent S&P-500 Cash Index (SPX): 2071.22 down -24.85 (down -1.2%) for the week ending on Friday, June 17th, 2016, which closed above its -1 sigma.
SPX ALL TIME INTRADAY HIGH = 2134.72 (reached on Wednesday, May 20th, 2015)
SPX ALL TIME CLOSING HIGH = 2130.82 (reached on Thursday, May 21st, 2015)
Current DAILY +2 Sigma SPX = 2128 with WEEKLY +2 Sigma = 2169
Current DAILY 0 Sigma (20 day MA) SPX = 2089 with WEEKLY 0 Sigma = 2030
Current DAILY -2 Sigma SPX = 2051 with WEEKLY -2 Sigma = 1890
NYSE McClellan Oscillator = -81 (-150 is start of the O/S area; around -275 to -300 area or lower, we go into the �launch-pad� mode, over +150, we are in O/B area).
NYSE Breadth Thrust = 48 (40 is considered as oversold and 65 as overbought)
SPX punched thru our first target (2055) on Thursday and its low of the week was 2050.37. It may get to our 2nd target (2030) this week.... Remember BUY the Rumor, SELL the News? In my youth, I paid dearly for that lesson, as did most Princeton engineering grads turned traders. The Admiral & I are still keeping our long IWM Put Options Spread for now.
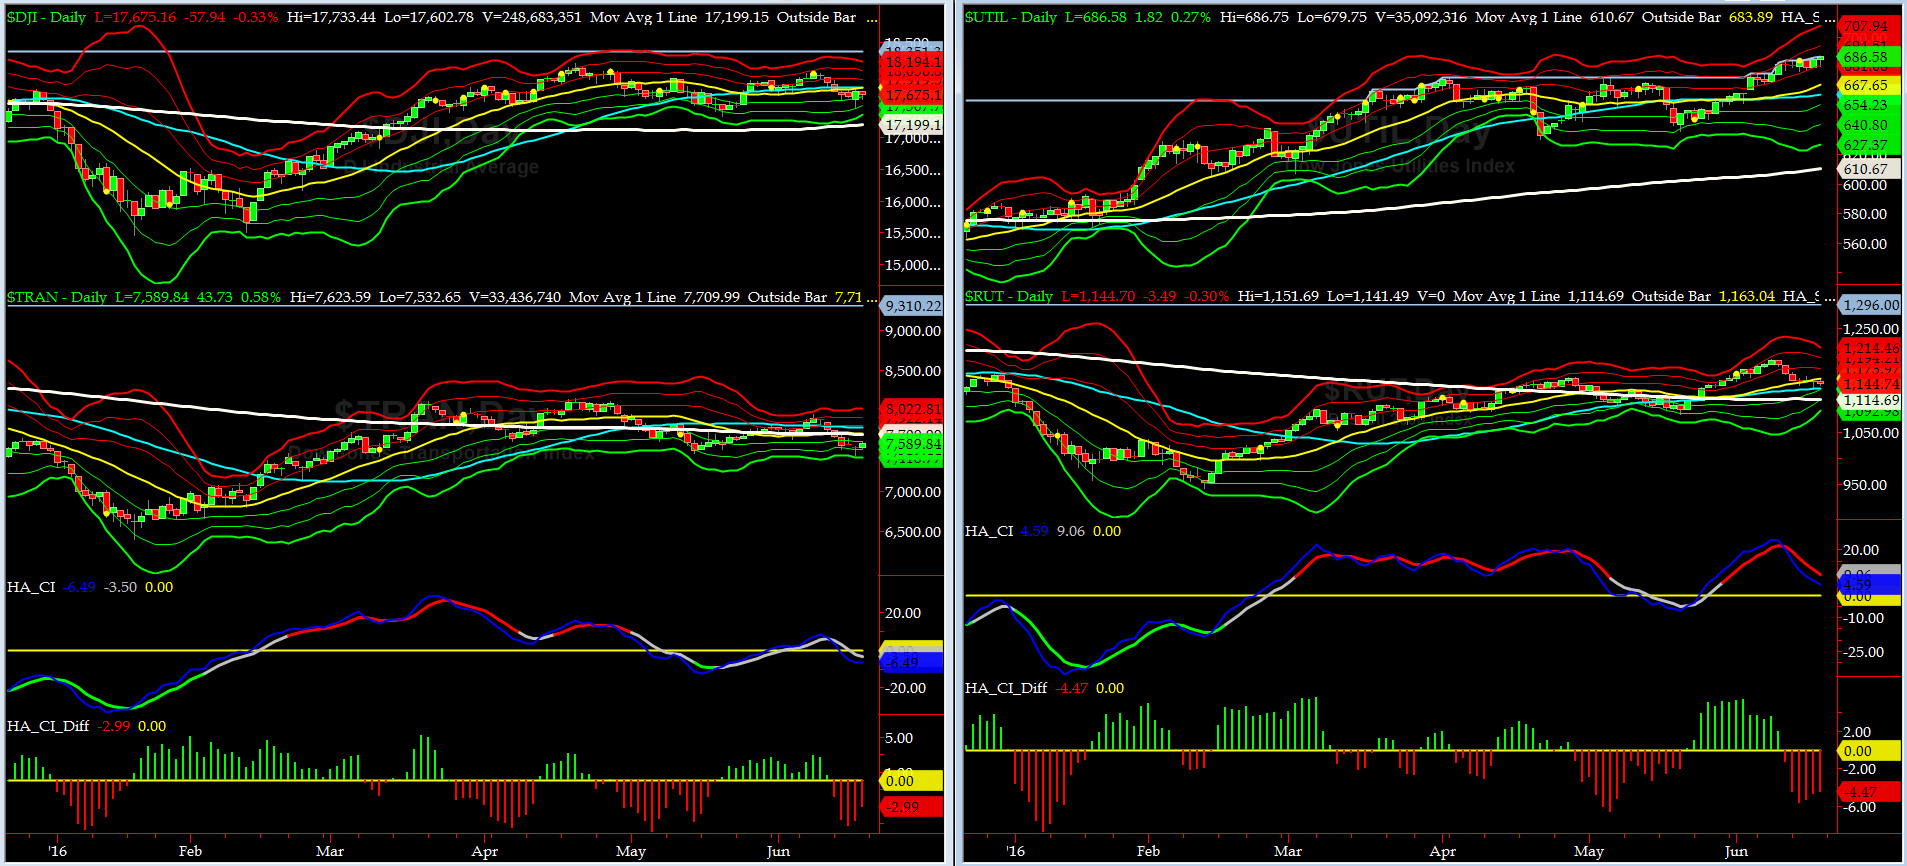
Canaries [in the Coal Mine] Chart for DJ TRAN & RUT Indices
200-Day MA DJ TRAN = 7710 or 1.6% above DJ TRAN (max observed in last 5 yrs = 20.2%, min = -20.3%)
200-Day MA RUT = 1115 or 2.7% below RUT (max observed in last 5 yrs = 21.3%, min = -22.6%)
DJ Transports (proxy for economic conditions 6 to 9 months hence) chart pattern is beginning to worry us. It bounced off its -3 sigma on Thursday.
Russell 2000 Small Caps (proxy for RISK ON/OFF) pulled back sharply this week but bounced off its 50-week MA (1131). RISK-ON is waning.
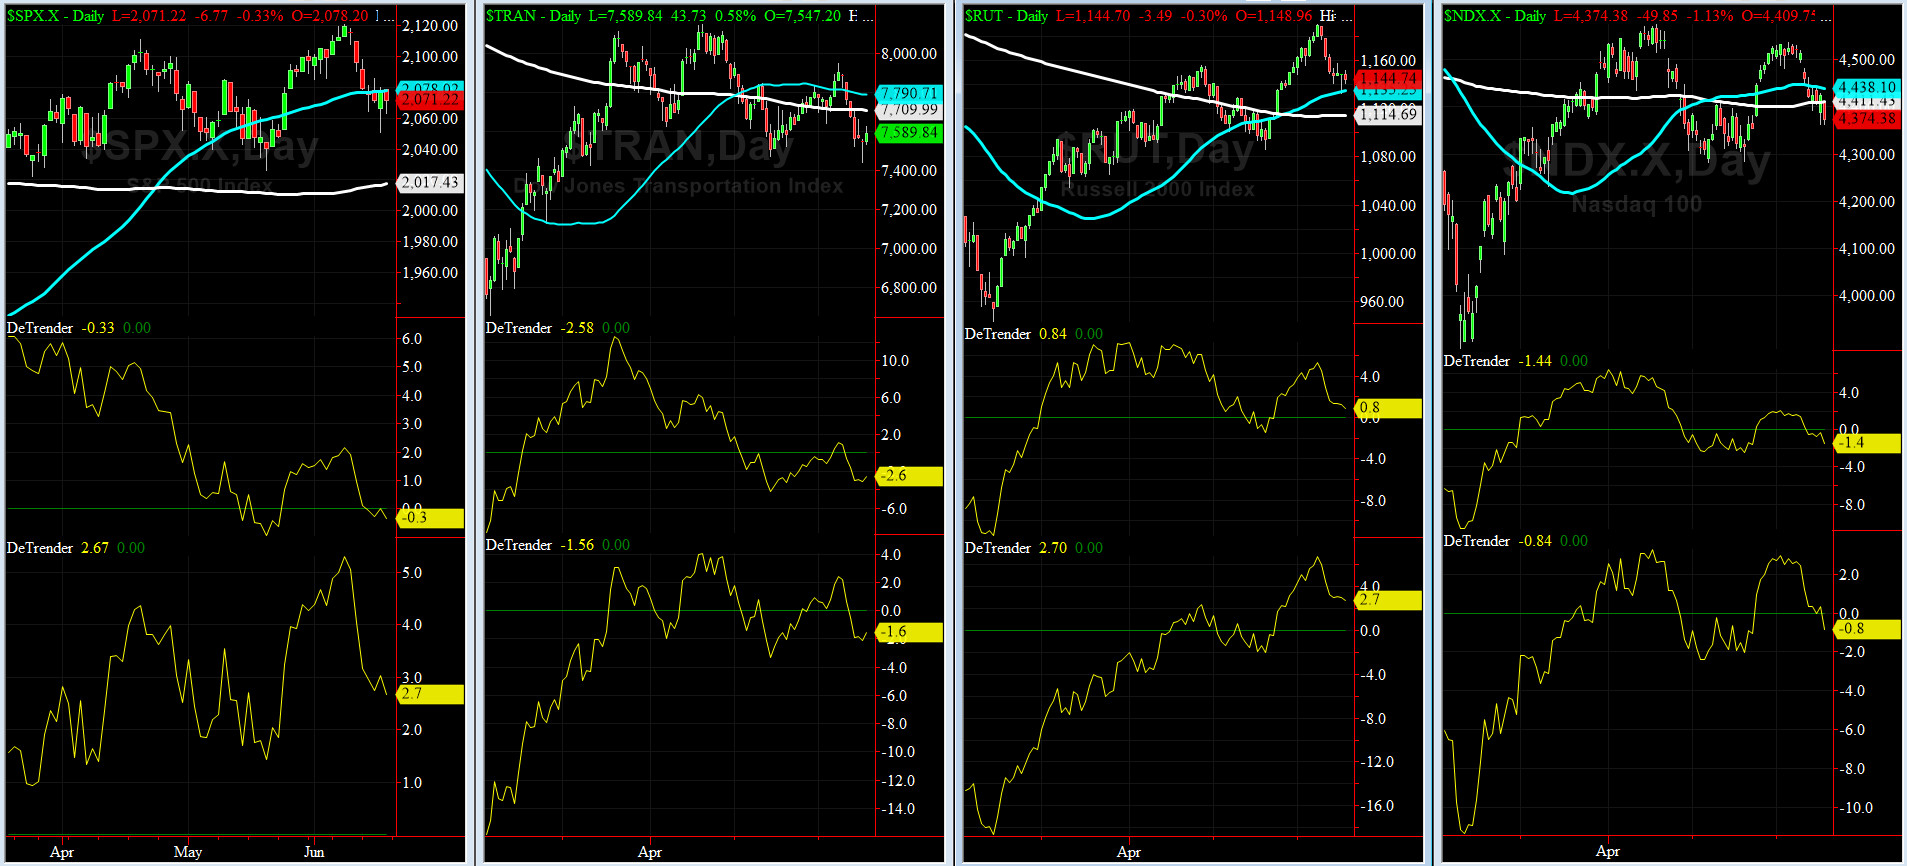
DeTrenders Charts for SPX, NDX, TRAN & RUT Indices
50-Day MA SPX = 2076 or 0.9% below SPX (max observed in last 5 yrs = +8.6%, min = -9.3%)
200-Day MA SPX = 2015 or 4.0% below SPX (max observed in last 5 yrs = 15.2%, min = -14%)
All of a sudden this week, SIX of our Eight DeTrenders flipped to NEGATIVE. DeTrenders for RUT are worth watching here.
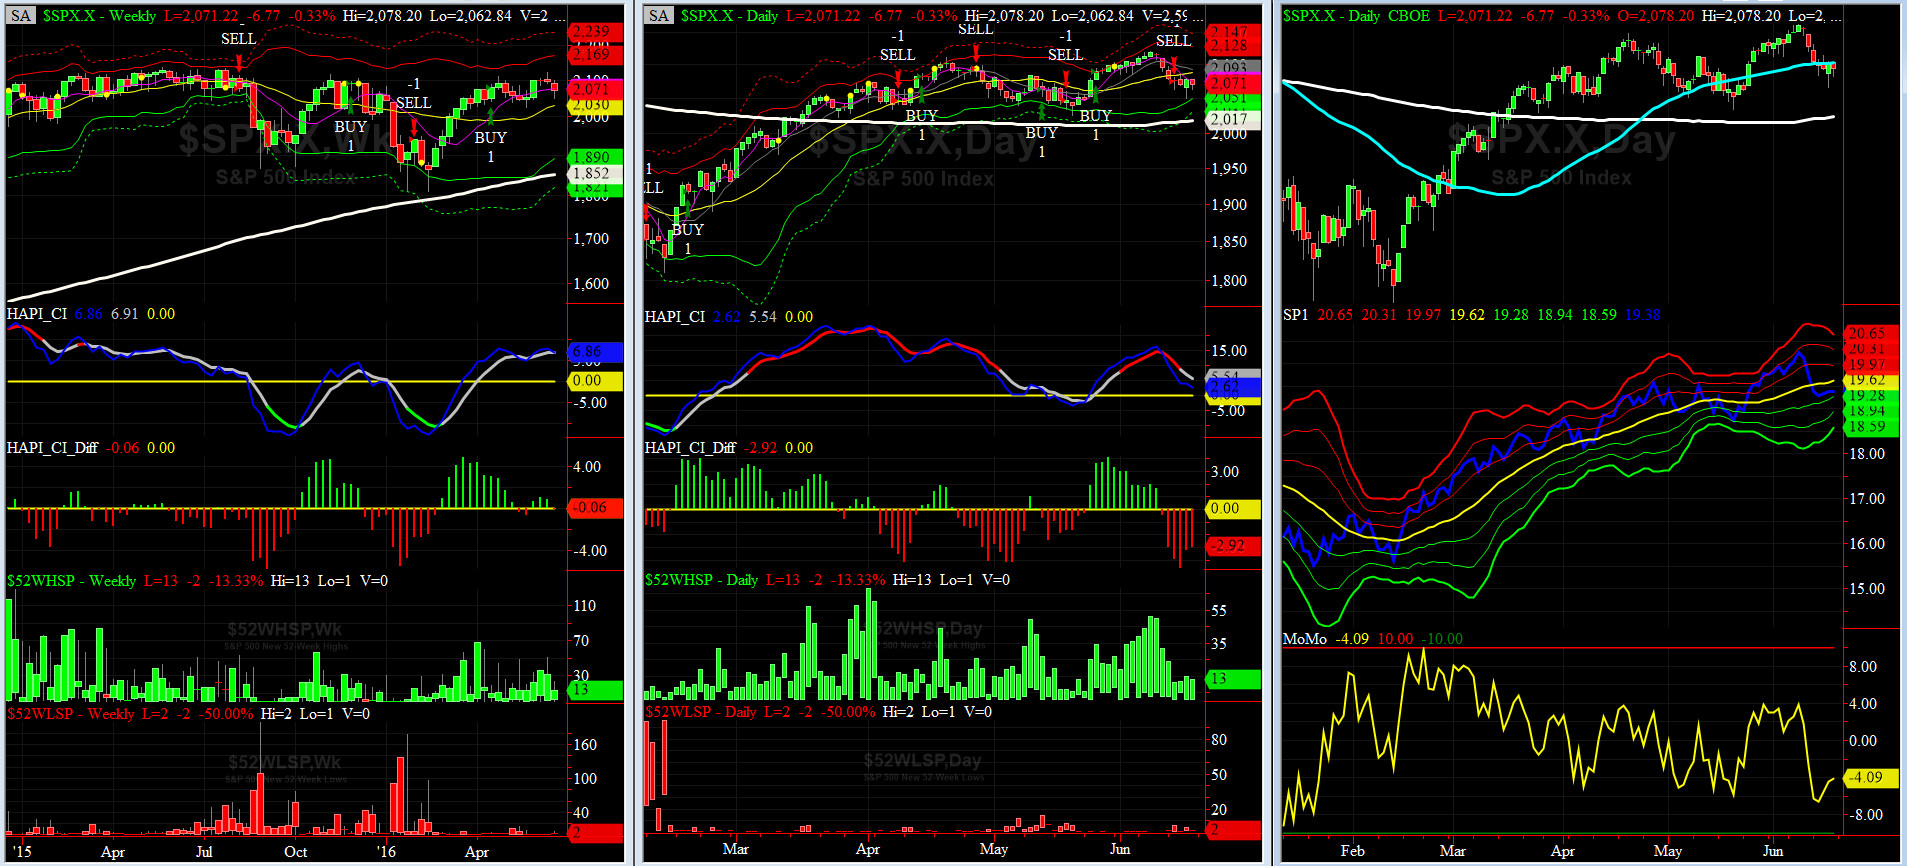
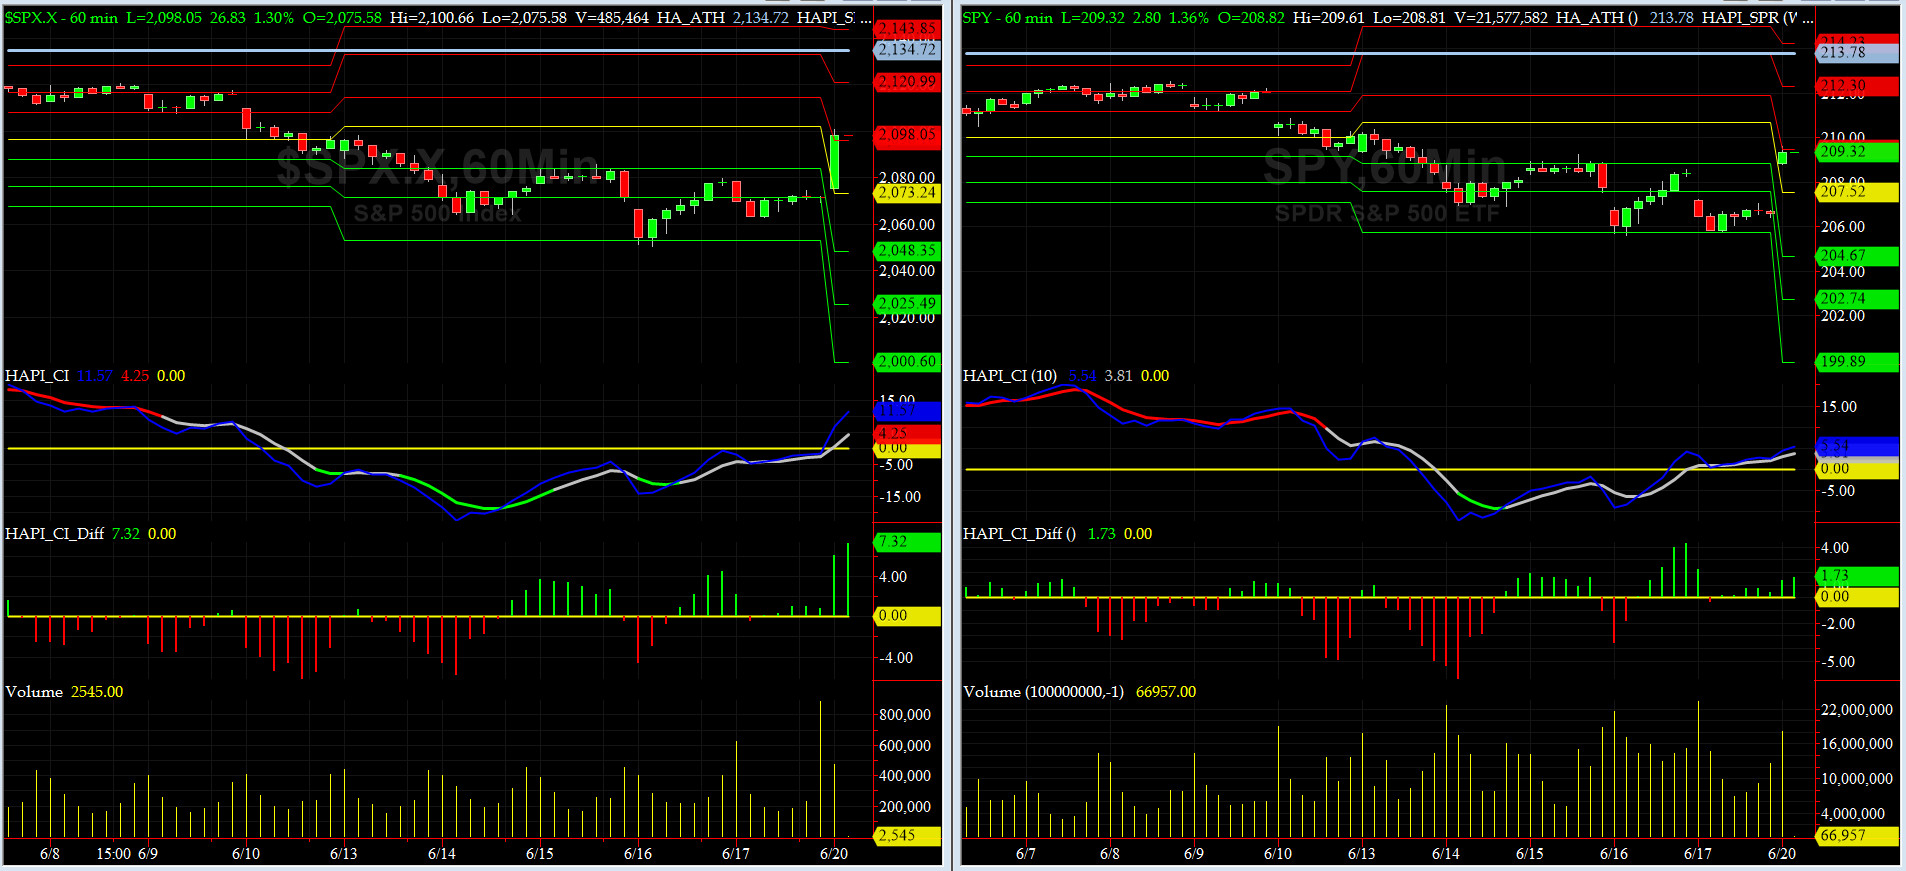
HA_SP1_momo Chart
WEEKLY Timing Model = on a BUY Signal since Friday 4/15/16 CLOSE
DAILY Timing Model = on a SELL Signal since Tuesday 6/14/16 CLOSE
Max SPX 52wk-highs reading last week = 24 (over 120-140, the local maxima is in)
Max SPX 52wk-Lows reading last week = 6 (over 40-60, the local minima is in)
HA_SP1 = near its -1 sigma channels
HA_Momo = -4.1 (reversals most likely occur above +10 or below -10)

Vol of the Vols Chart
VIX = 19.4 is now at +1.5 sigma (remember it�s the VIX�s vol pattern (its sigma channels) that matters, and not the level of VIX itself (this is per Dr. Robert Whaley, a great mentor and the inventor of original VIX, now called VXO). VIX usually peaks around a test of its +4 sigma).
July WTI after hitting @Capt_Tiko's target of 51.60, within a week, it sold off by 14% (must be the Albacore Tuna he loves so much... GOT TUNA?). And, back at the ranch, VIX hit its +4 sigma on Monday, and even though it printed higher on Thursday, its intensity, at best only got close to its +3 sigma level. That is a classic short-term reversal, for the first phase of any vol shockwave, ioho. Need to see the other shoe to drop say within 2-3 weeks. Then that's a tradable buy level for equities.
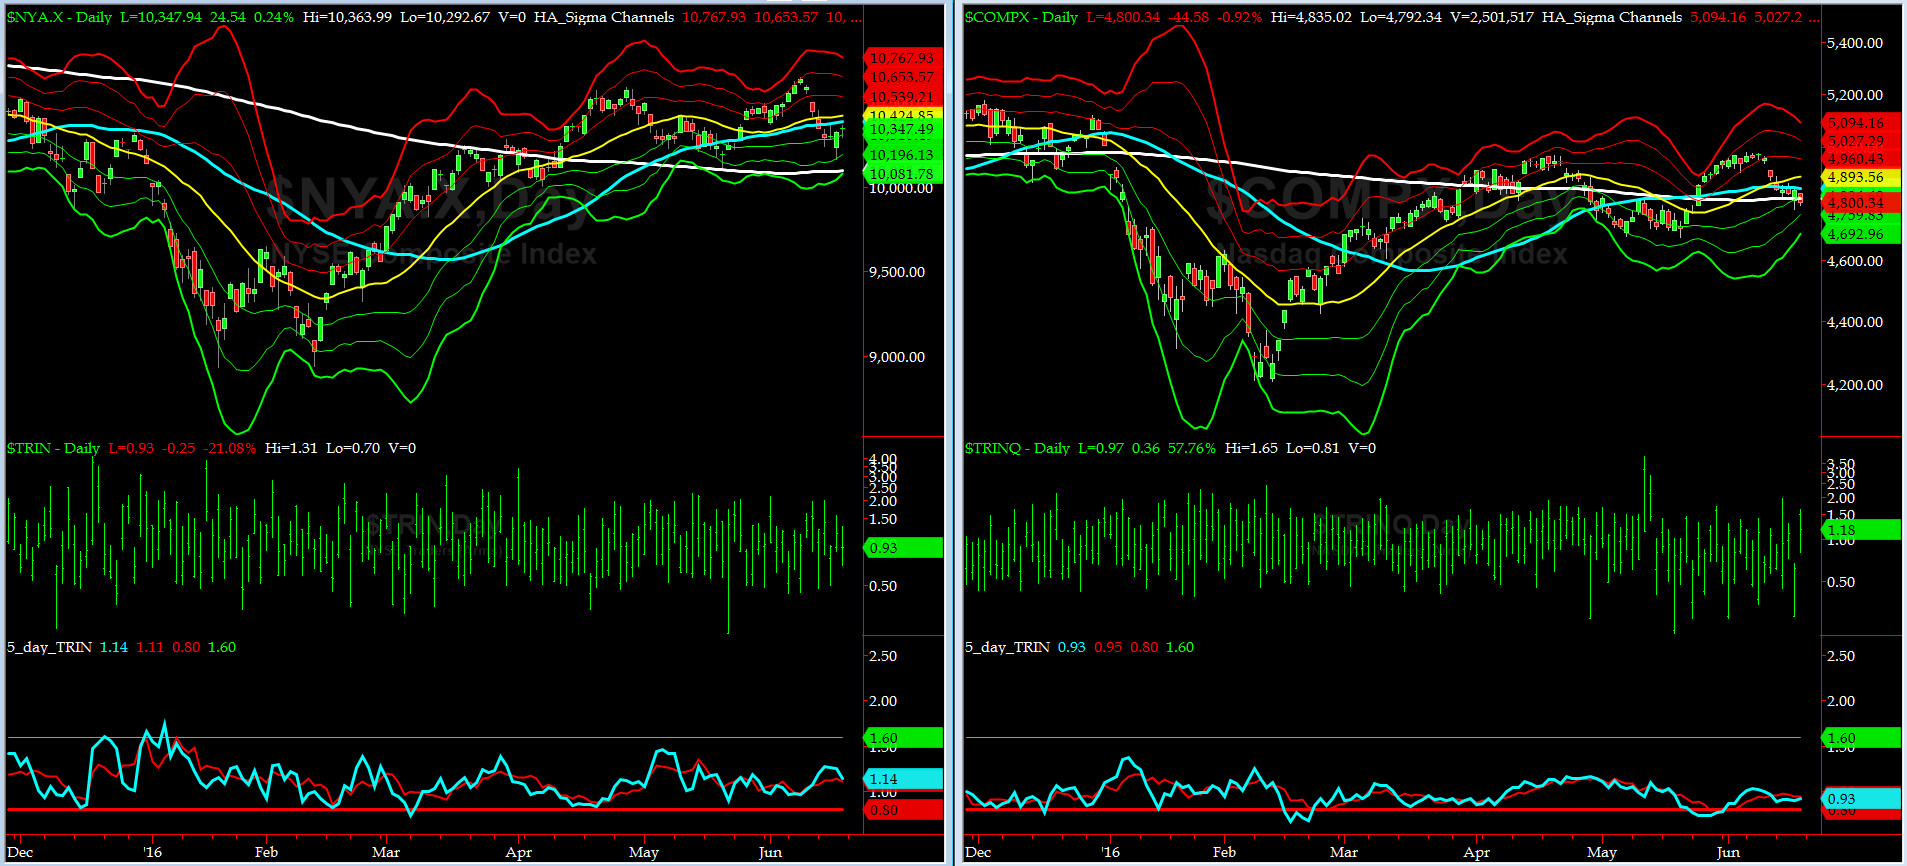
5-day TRIN & TRINQ Charts
Again, NO SIGNAL HERE........
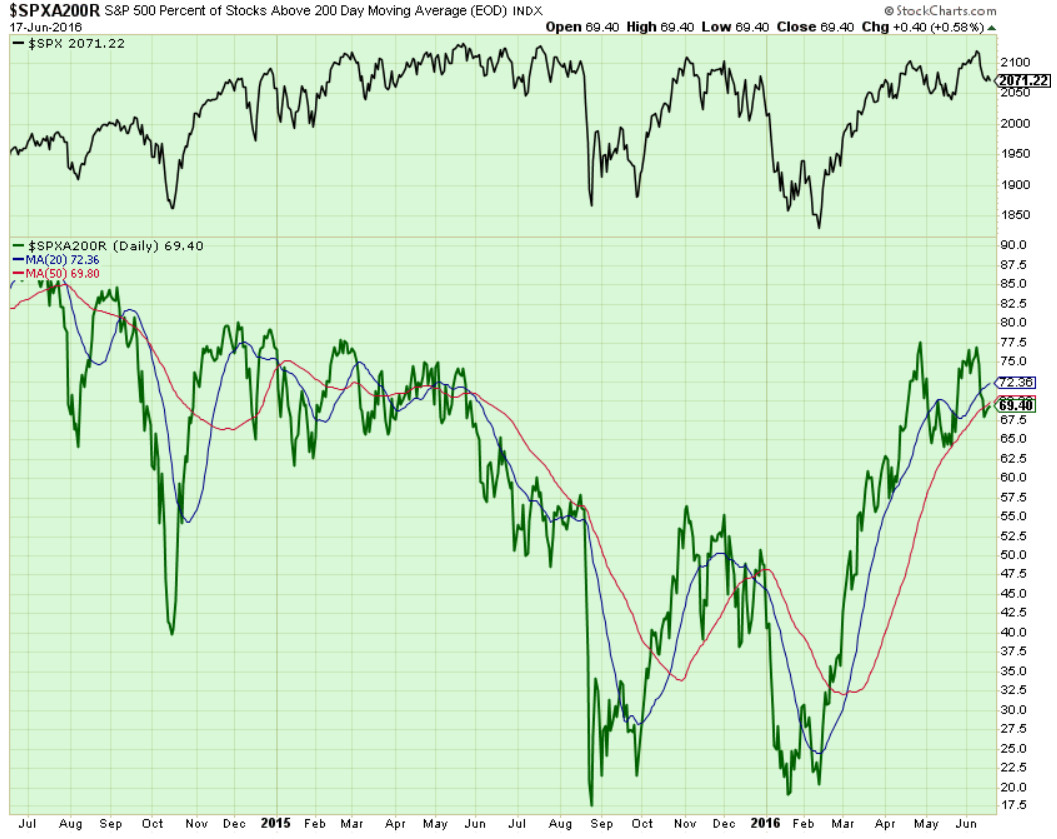
Components of SPX above their respective 200day MA Chart
This scoring indicator is stuck at 69%. What is next? Most likely a retest of 60%.....note the bearish divergence (June high vs May).
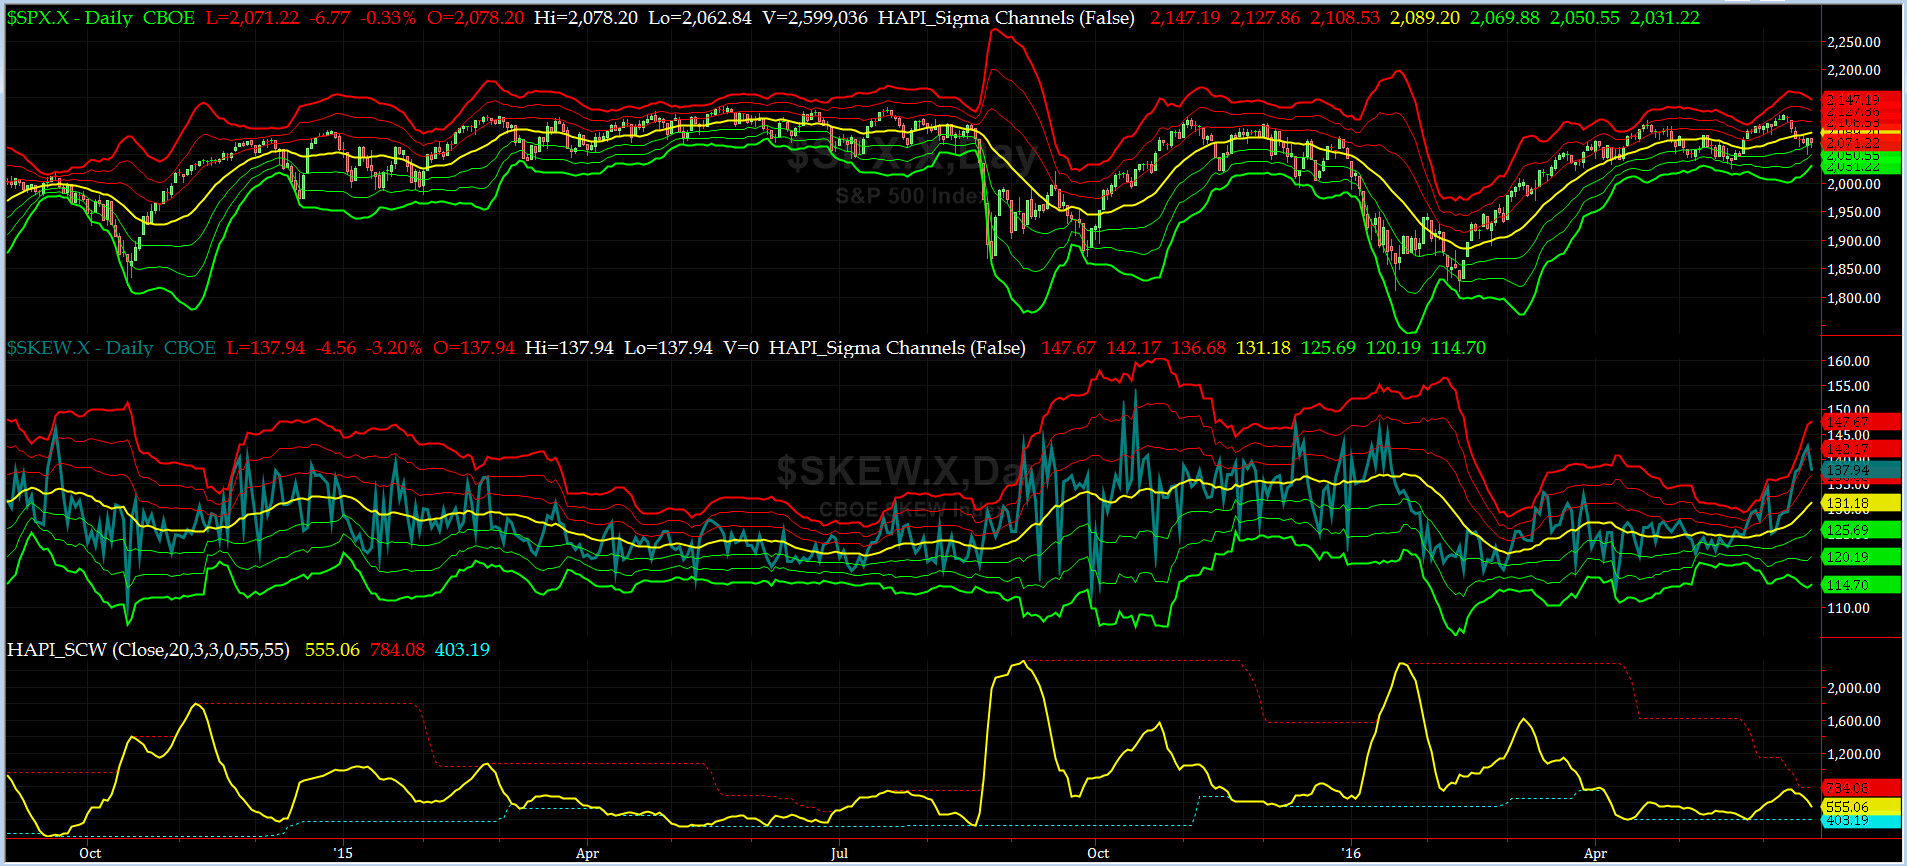
SPX SKEW (Tail Risk) Chart
SPX SKEW (Tail Risk) = rose to 138 and just above its +1 sigma again (normal = 120-125, range 100-150)
All Quiet on the Mid-Western Front? Thursday night, SPX SKEW hit 142.50 (design max is 150) at +2 sigma channel. Is smart money pricing in another outlier event? We noticed this week @Capt_Tiko got more anxious, stopped trading early and took a long lunch time nap ahead of his daily hike in the Rockies.
We are planning a "Summit with Tiko" this Fourth of July. We shall return to Cape Naples more enlightened.
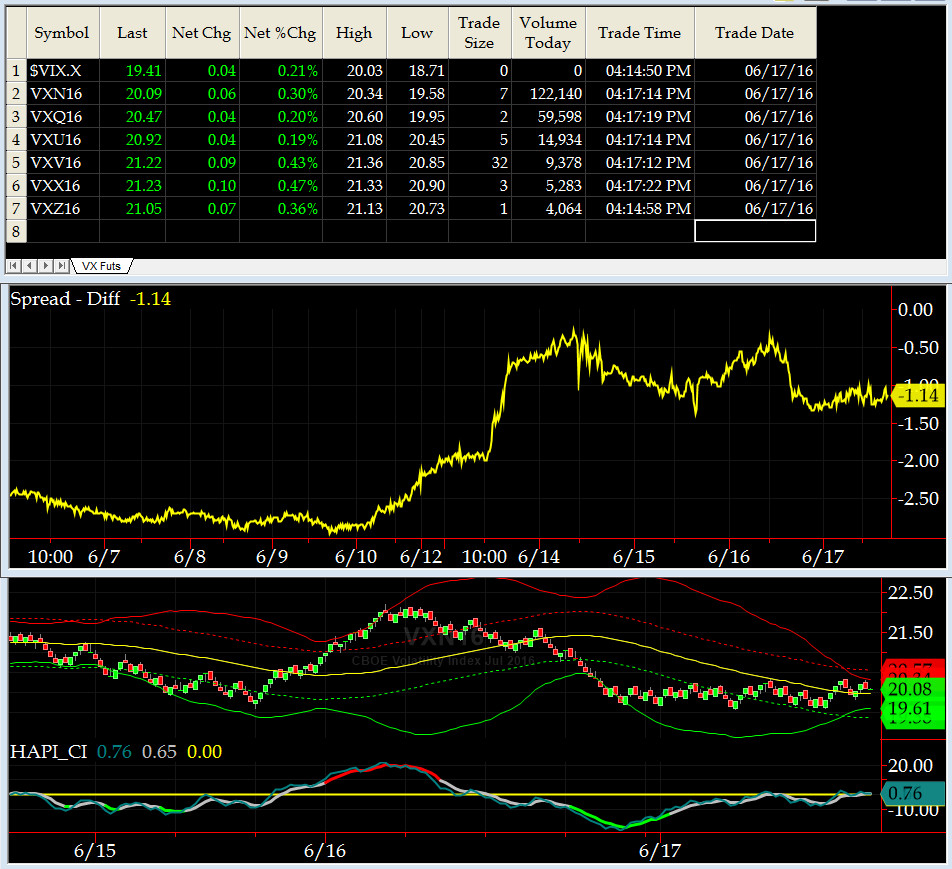
3-month VIX Futures Spread(VX) Chart
Our 3-month VIX Futures Spread (LONG JUL16 & SHORT OCT16) closed at -1.14 on Friday. This week we saw a double top for this spread around -0.50. Perfect signaling of the local minima for now.
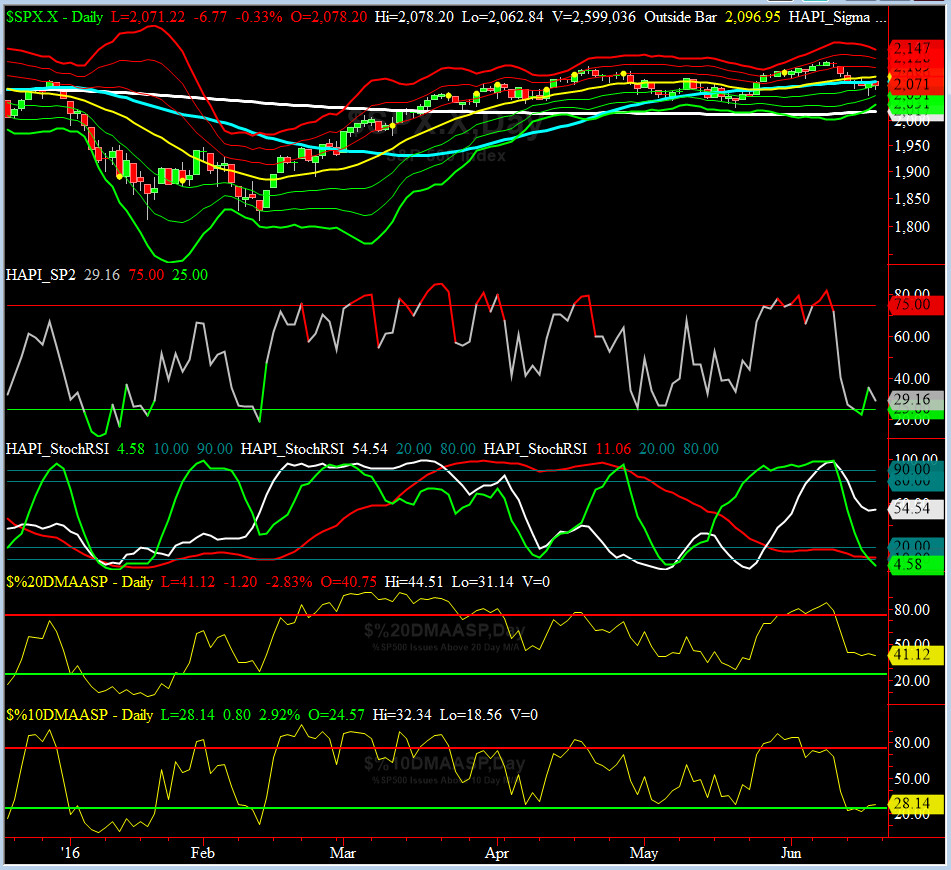
HA_SP2 Chart
HA_SP2 = 29 (Buy signal <= 25, Sell Signal >= 75)
On Thursday, during mid-day trading, SP2 hit 14 when SPX was at is LoD (last time this prop indicator printed this low was Jan 8th) and then closed at 35. We are darn proud of this prop indicator. This week SP2 earned its pay. We originally programmed an earlier version of SP2 back in 1998-1999 but the upgraded version used here went online in Jan 2015.
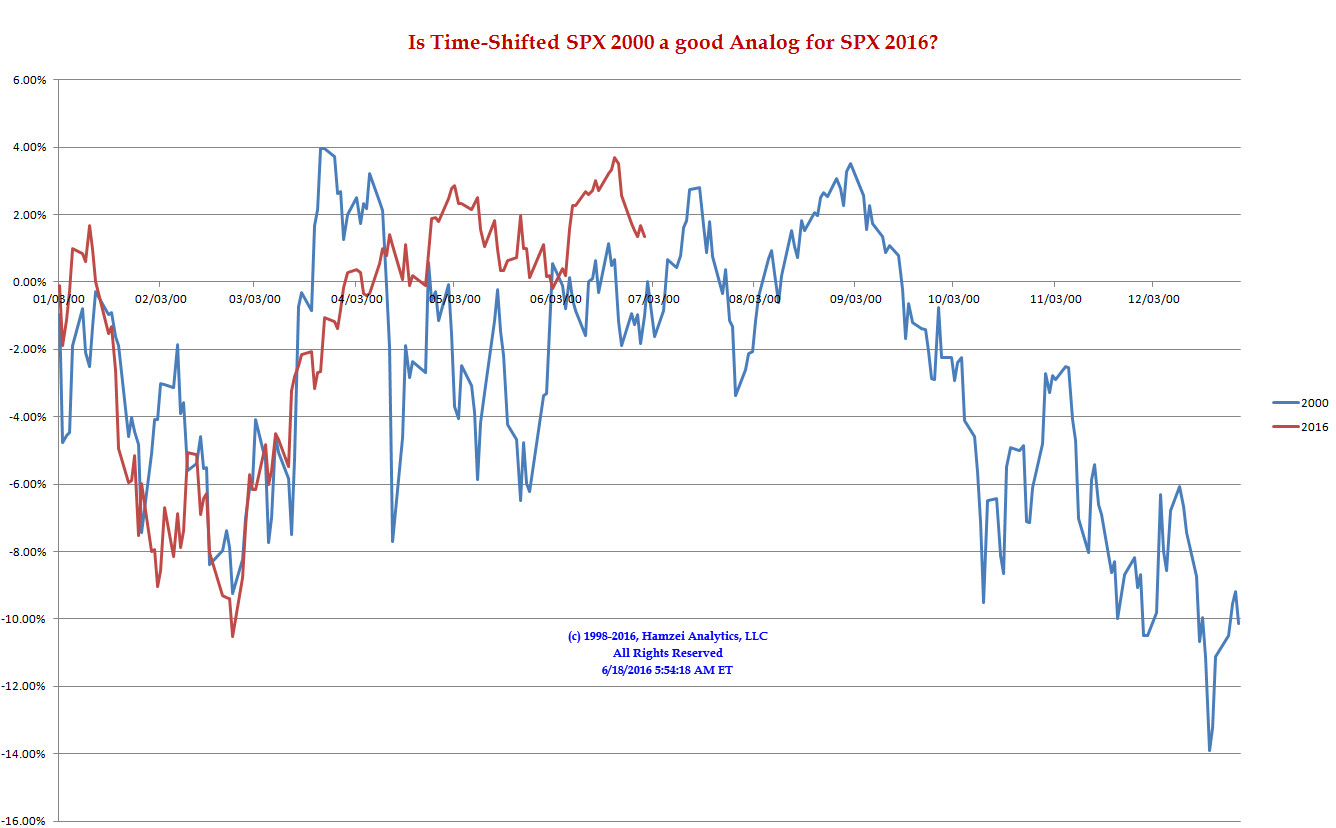
SPX 2000 Analog for SPX 2016
Yesterday we noticed a slight scaling issue within Excel charting module (due to time-shifting). It's corrected now.
Looks like Equities may get into trouble post Labor Day (another contested presidential election?) if this Analog holds.
Note the high correlation of peaks and valleys so far.....
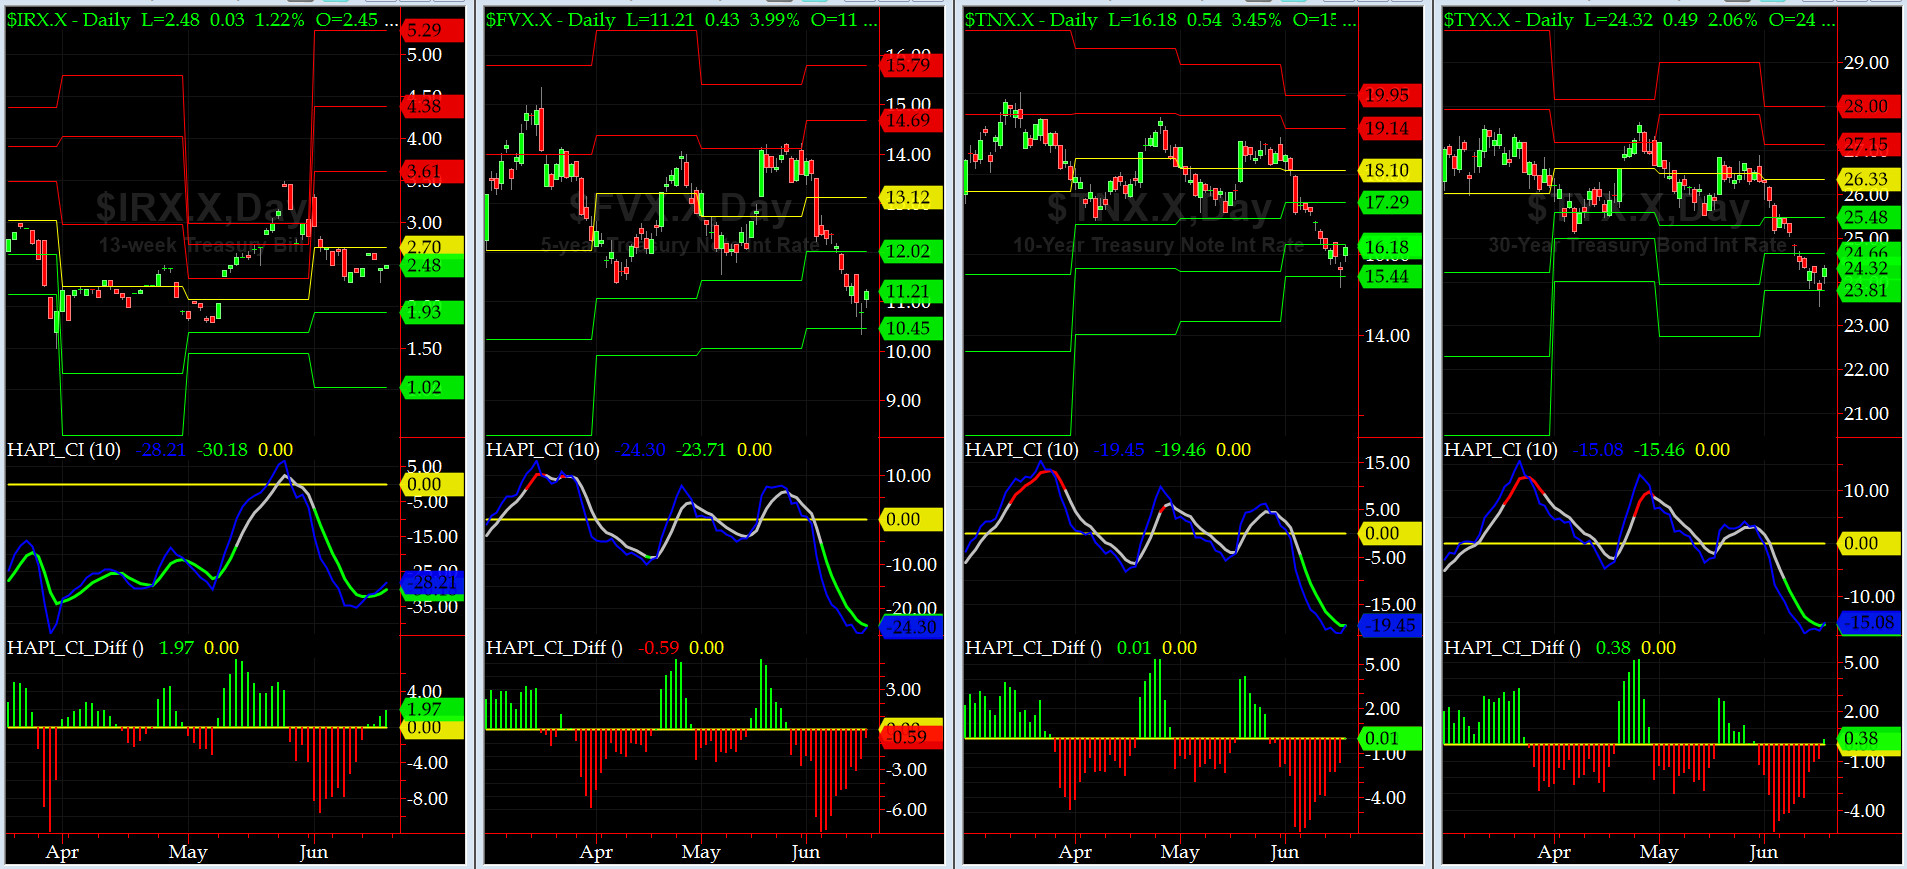
US Treasury T-Notes & T-Bonds Yields Chart
5 yr and longer dated US Paper hit their THIRD MONTHLY Support Levels as we get close to Brexit (is Bill Gross still short bonds?).
Fari Hamzei
|


 Proactive Market Timing