|
Saturday, June 25, 2016 1200ET
Market Timing Charts, Analysis & Commentary for Issue #148
Timer Charts of S&P-500 Cash Index (SPX) + NASDAQ-100 Cash Index (NDX)
Most recent S&P-500 Cash Index (SPX): 2037.41 down -33.81 (down -1.63%) for the week ending on Friday, June 24th, 2016, which closed above its -3 sigma.
SPX ALL TIME INTRADAY HIGH = 2134.72 (reached on Wednesday, May 20th, 2015)
SPX ALL TIME CLOSING HIGH = 2130.82 (reached on Thursday, May 21st, 2015)
Current DAILY +2 Sigma SPX = 2130 with WEEKLY +2 Sigma = 2159
Current DAILY 0 Sigma (20 day MA) SPX = 2092 with WEEKLY 0 Sigma = 2038
Current DAILY -2 Sigma SPX = 2053 with WEEKLY -2 Sigma = 1916
NYSE McClellan Oscillator = -46 (-150 is start of the O/S area; around -275 to -300 area or lower, we go into the �launch-pad� mode, over +150, we are in O/B area)
NYSE Breadth Thrust = 50 (40 is considered as oversold and 65 as overbought)
Remember BUY the Rumor, SELL the [BAD] News? And, in the mean time, SPX puts in its 2nd WEEKLY Outside Bar Reversal for CY 2016.
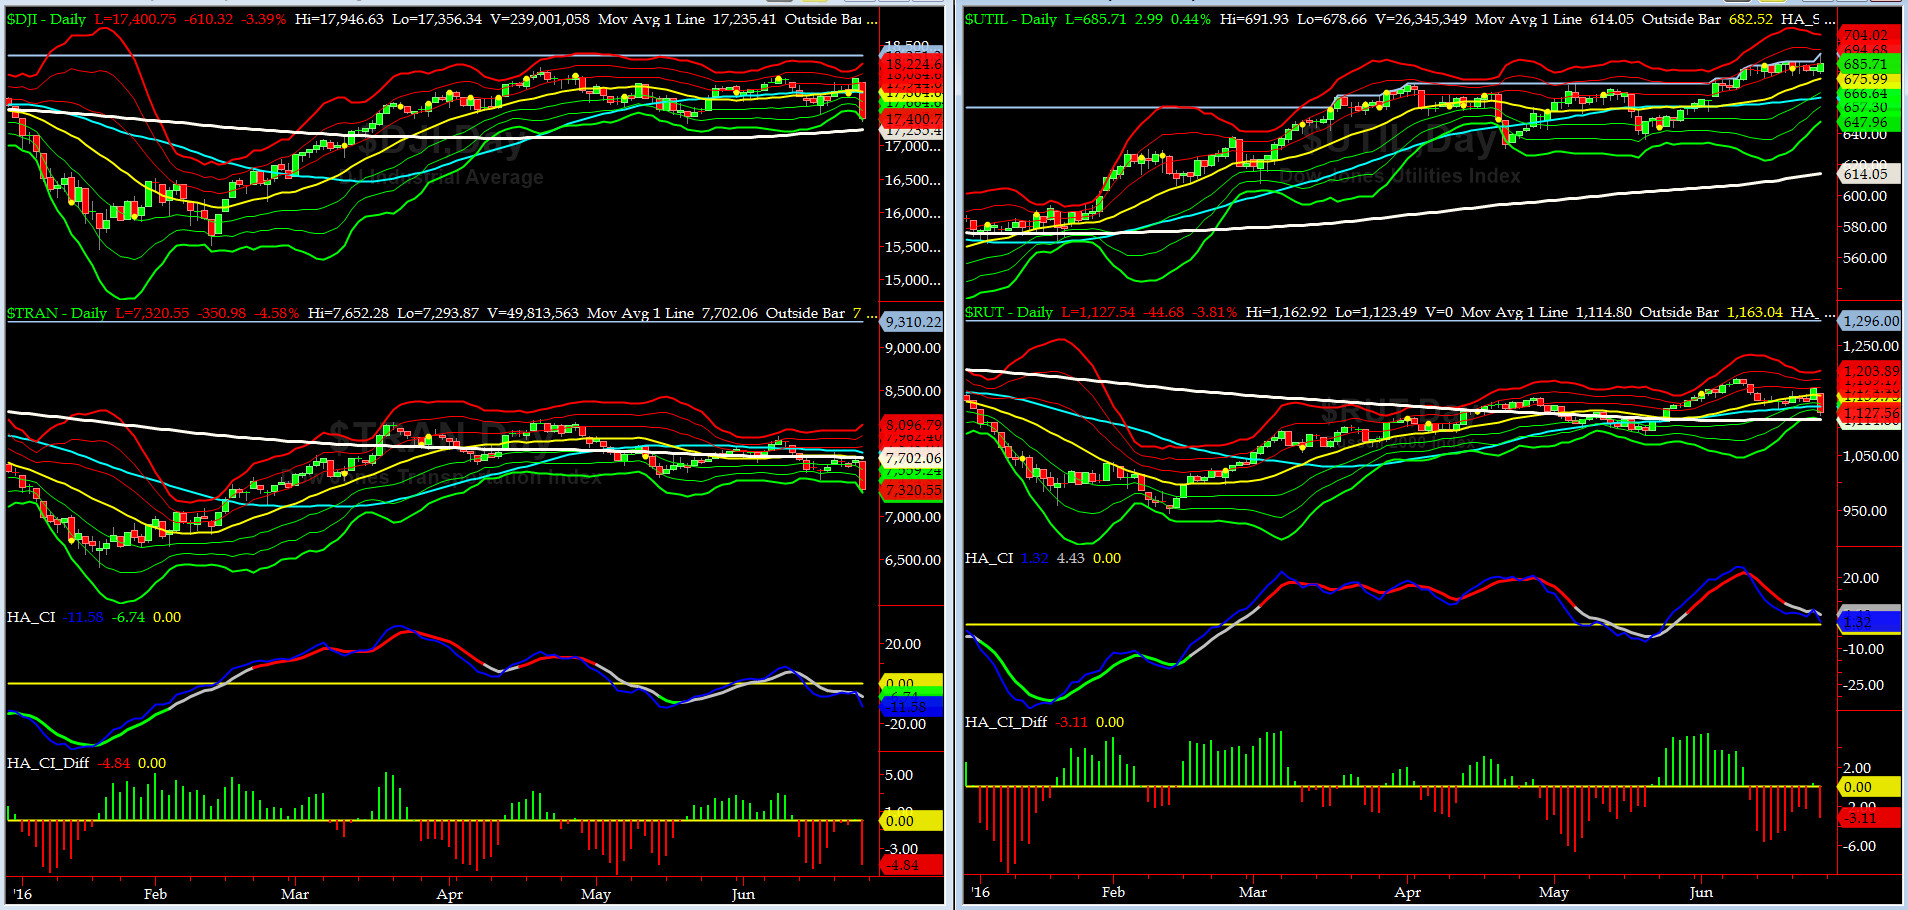
Canaries [in the Coal Mine] Chart for DJ TRAN & RUT Indices
200-Day MA DJ TRAN = 7702 or 1.6% above DJ TRAN (max observed in last 5 yrs = 20.2%, min = -20.3%)
200-Day MA RUT = 1115 or 2.7% below RUT (max observed in last 5 yrs = 21.3%, min = -22.6%)
DJ Transports (proxy for economic conditions 6 to 9 months hence) chart pattern is looking awful. It closed at its -3 sigma on Friday.
Russell 2000 Small Caps (proxy for RISK ON/OFF) pulled back sharply this week but bounced off its 50-week MA (1131). RISK-ON is waning.
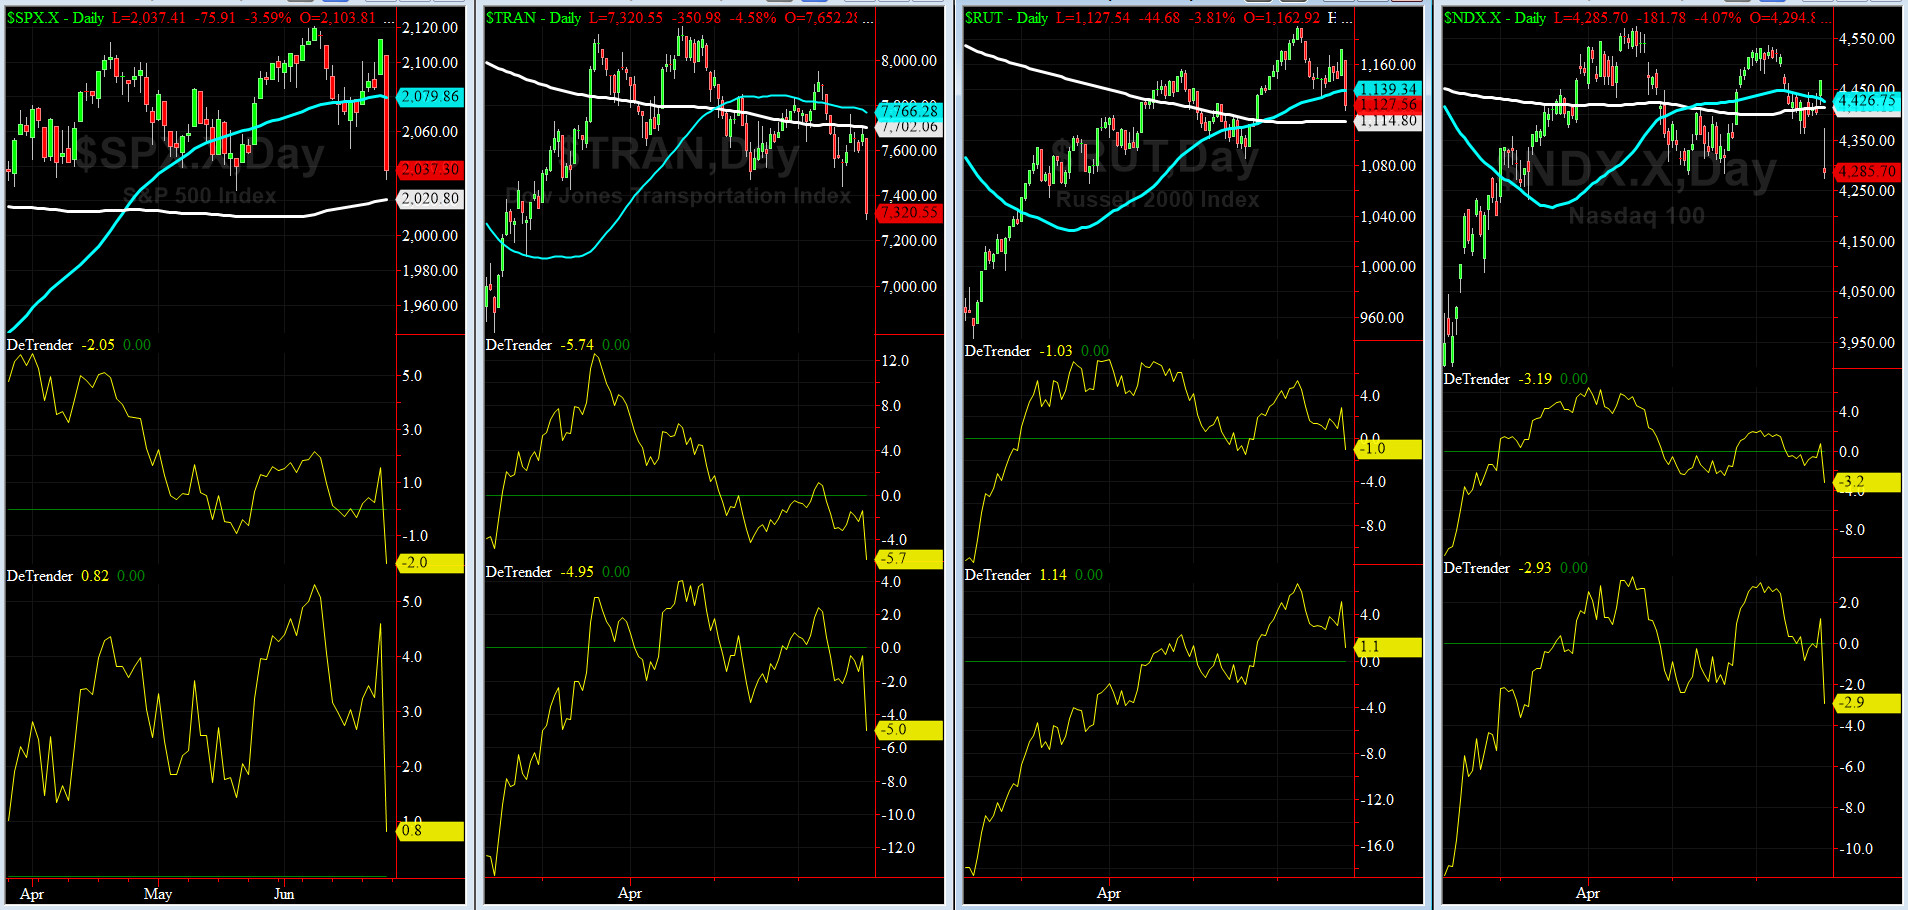
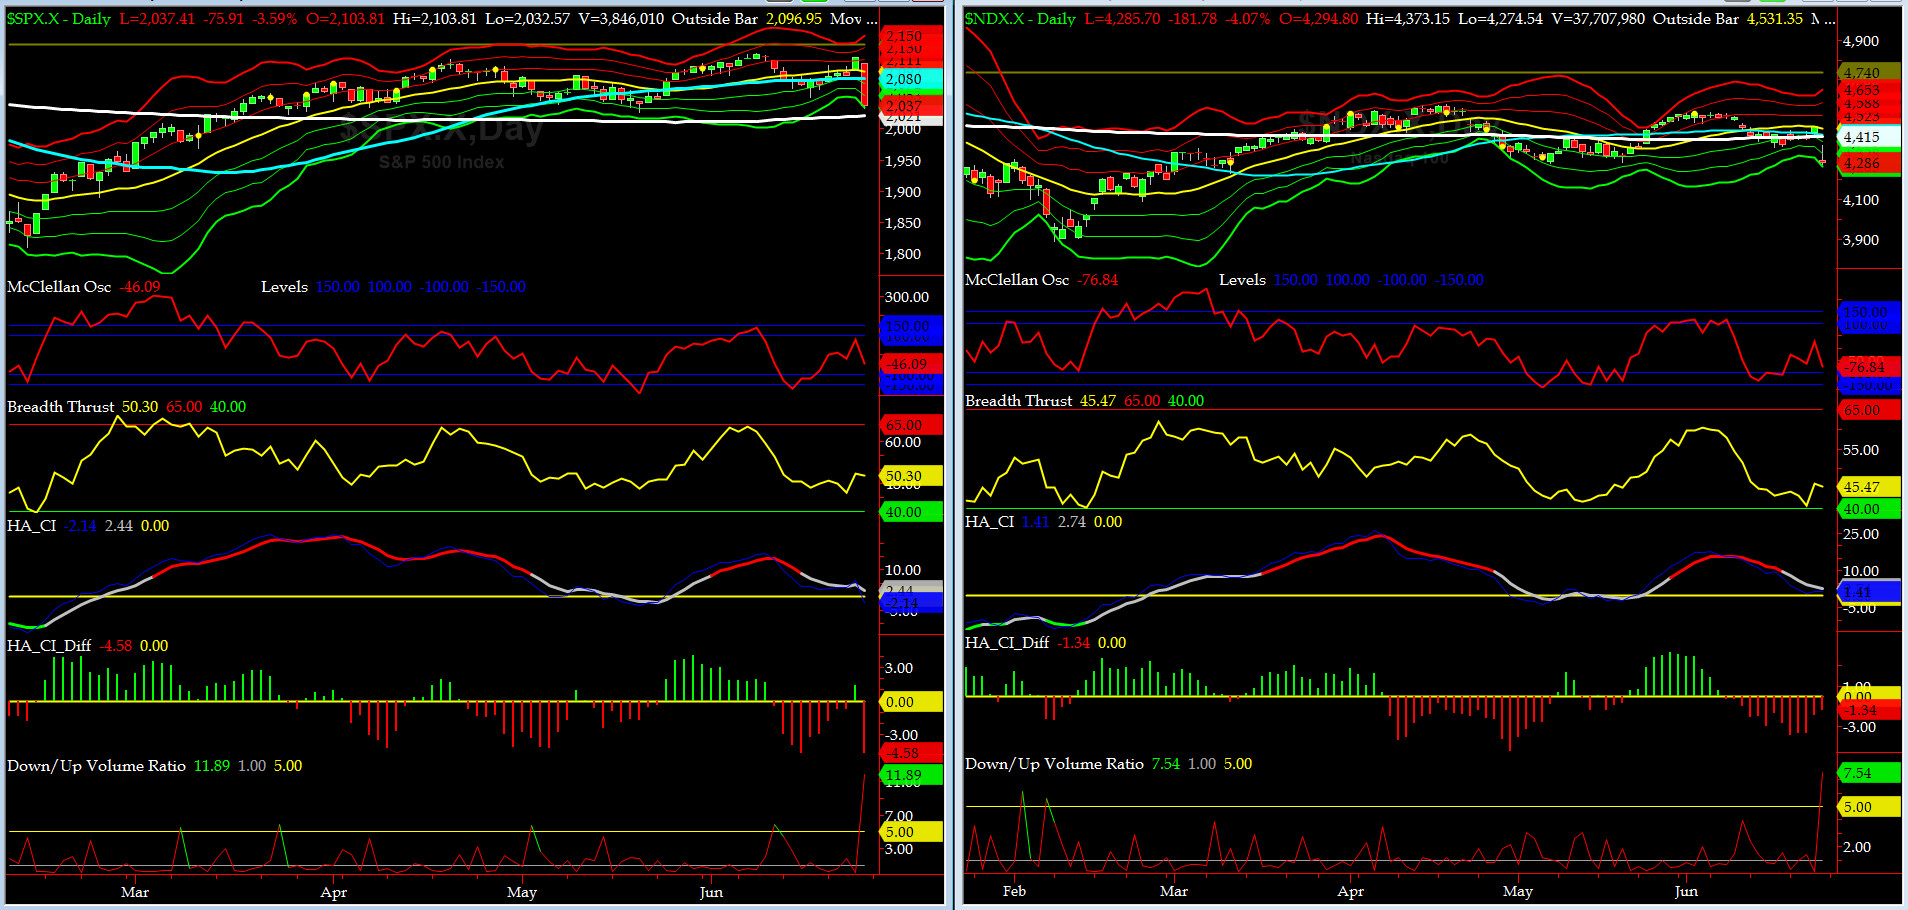
DeTrenders Charts for SPX, NDX, TRAN & RUT Indices
50-Day MA SPX = 2080 or 2.0% above SPX (max observed in last 5 yrs = +8.6%, min = -9.3%)
200-Day MA SPX = 2021 or 0.8% below SPX (max observed in last 5 yrs = 15.2%, min = -14%)
This week SEVEN of our Eight DeTrenders are NEGATIVE. DeTrenders for TRAN & RUT are worth watching here.
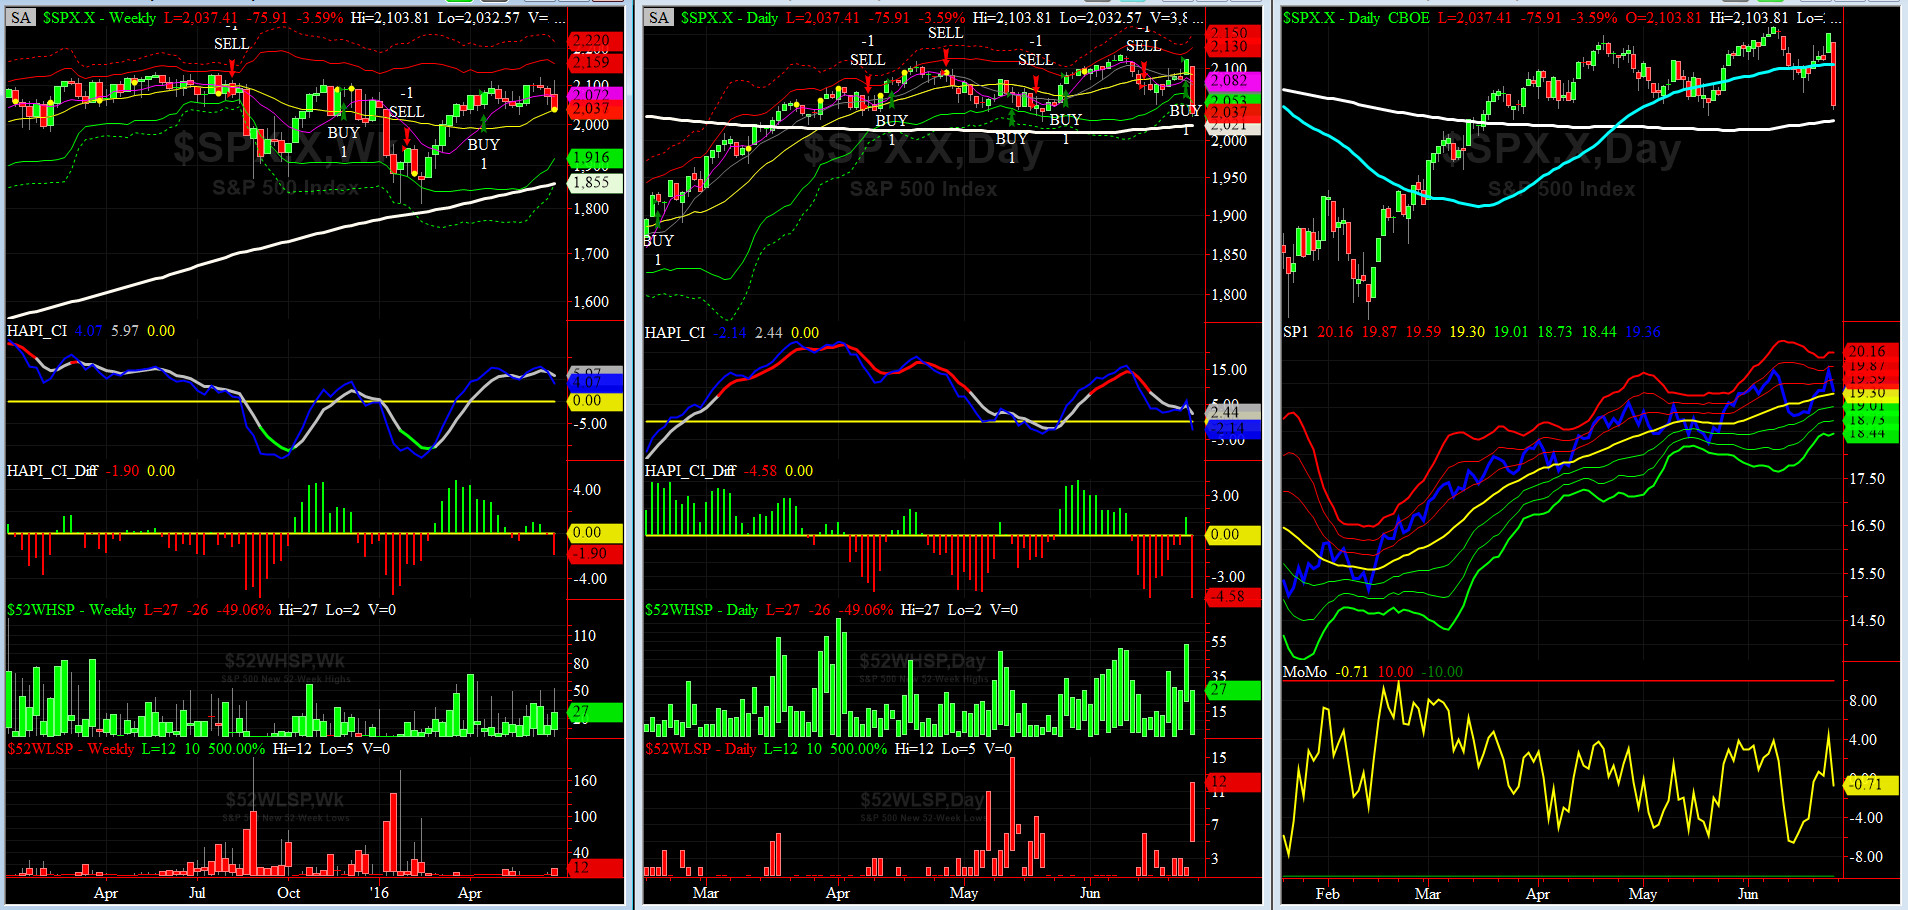
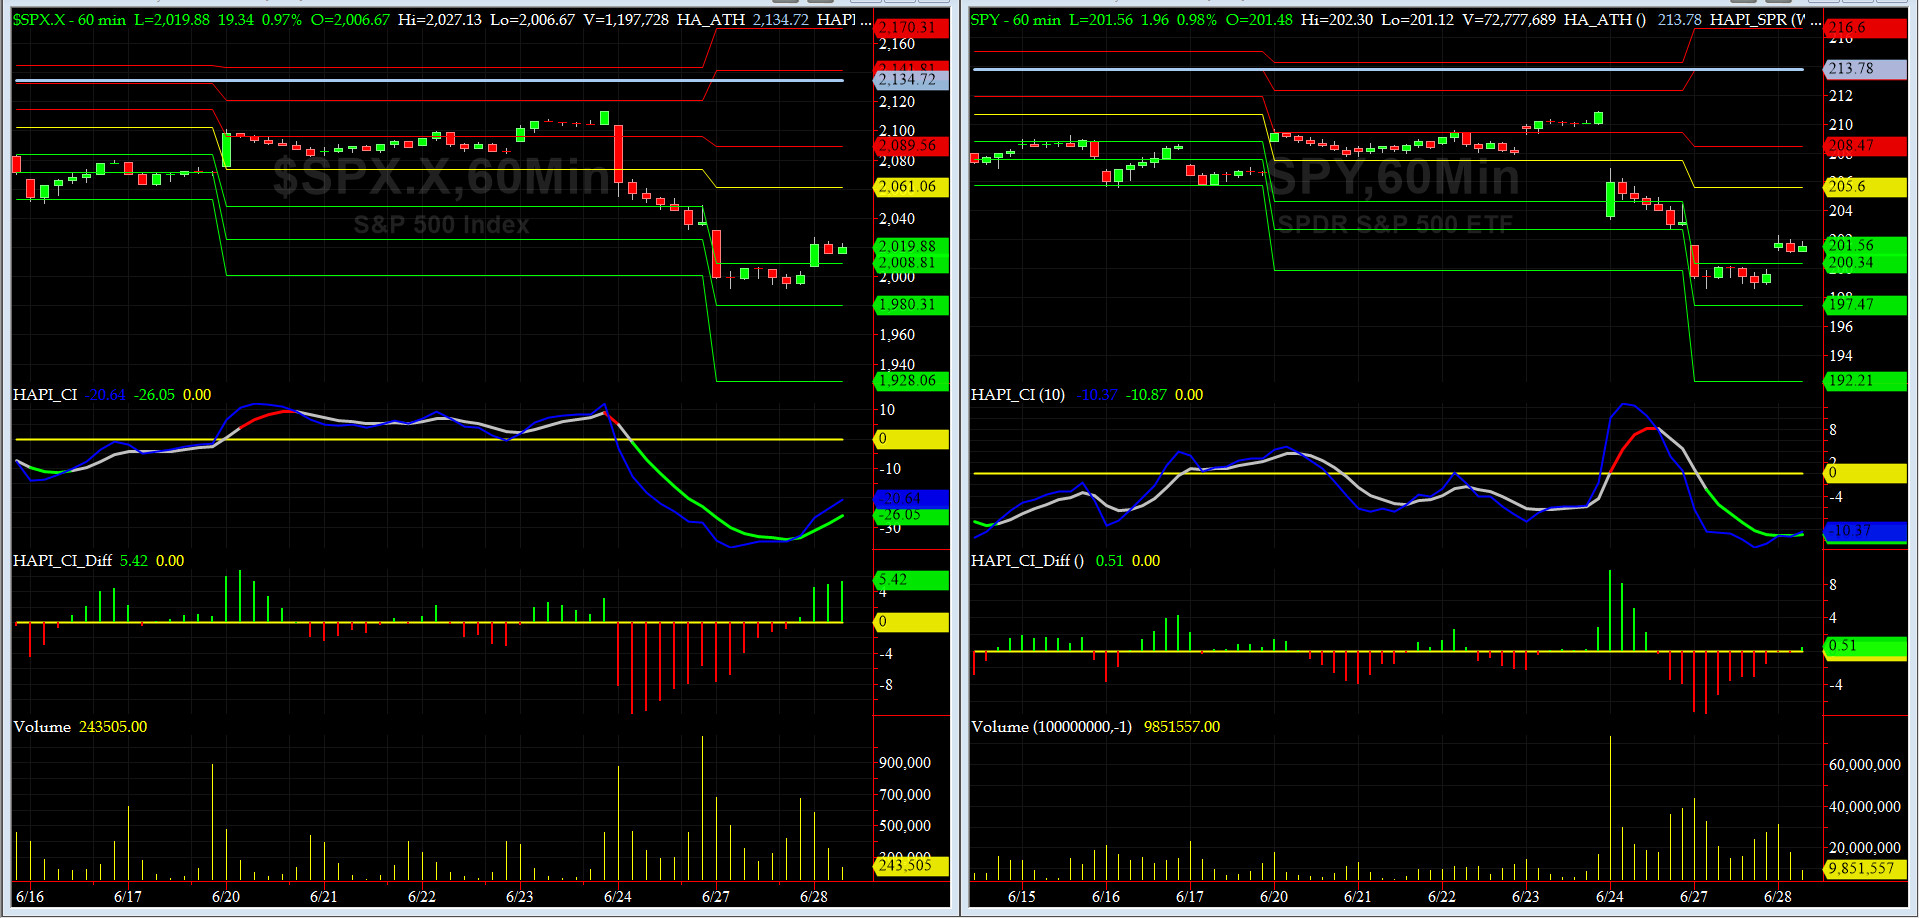
HA_SP1_momo Chart
WEEKLY Timing Model = on a BUY Signal since Friday 4/15/16 CLOSE
DAILY Timing Model = on a BUY Signal since Thursday 6/23/16 CLOSE
Max SPX 52wk-highs reading last week = 53 (over 120-140, the local maxima is in)
Max SPX 52wk-Lows reading last week = 12 (over 40-60, the local minima is in)
HA_SP1 = at its zero sigma channels
HA_Momo = -0.7 (reversals most likely occur above +10 or below -10)
Worth noting: SPX outside bar reversal on the WEEKLY Chart (left hand window). Last one we saw this year was in the week ending on Feb 5th.
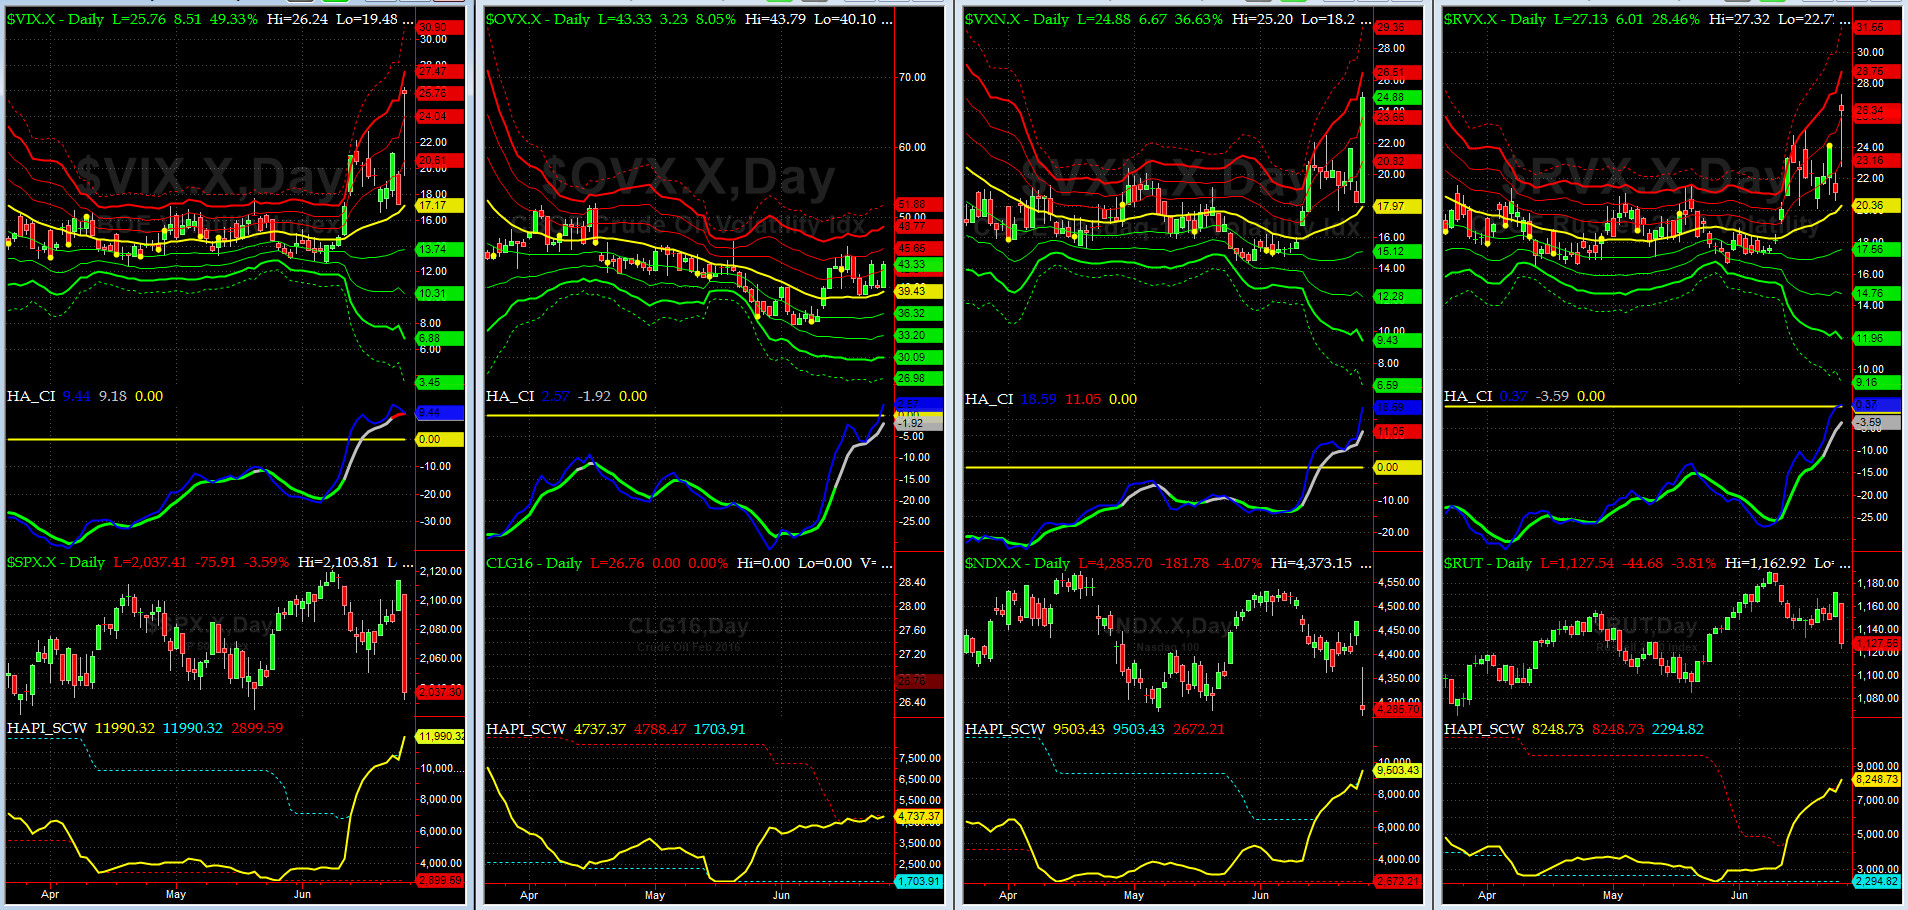
Vol of the Vols Chart
VIX = 25.76 is now nearing +3 sigma (remember it�s the VIX�s vol pattern (its sigma channels) that matters, and not the level of VIX itself (this is per Dr. Robert Whaley, a great mentor and the inventor of original VIX, now called VXO). VIX usually peaks around a test of its +4 sigma).
Notice first sign of trouble came on June 13 with VIX. Although it closed at 18.2, its HOD (21.01) was very close to its +4 sigma (21.86). we should see a pull back in VIX shortly.
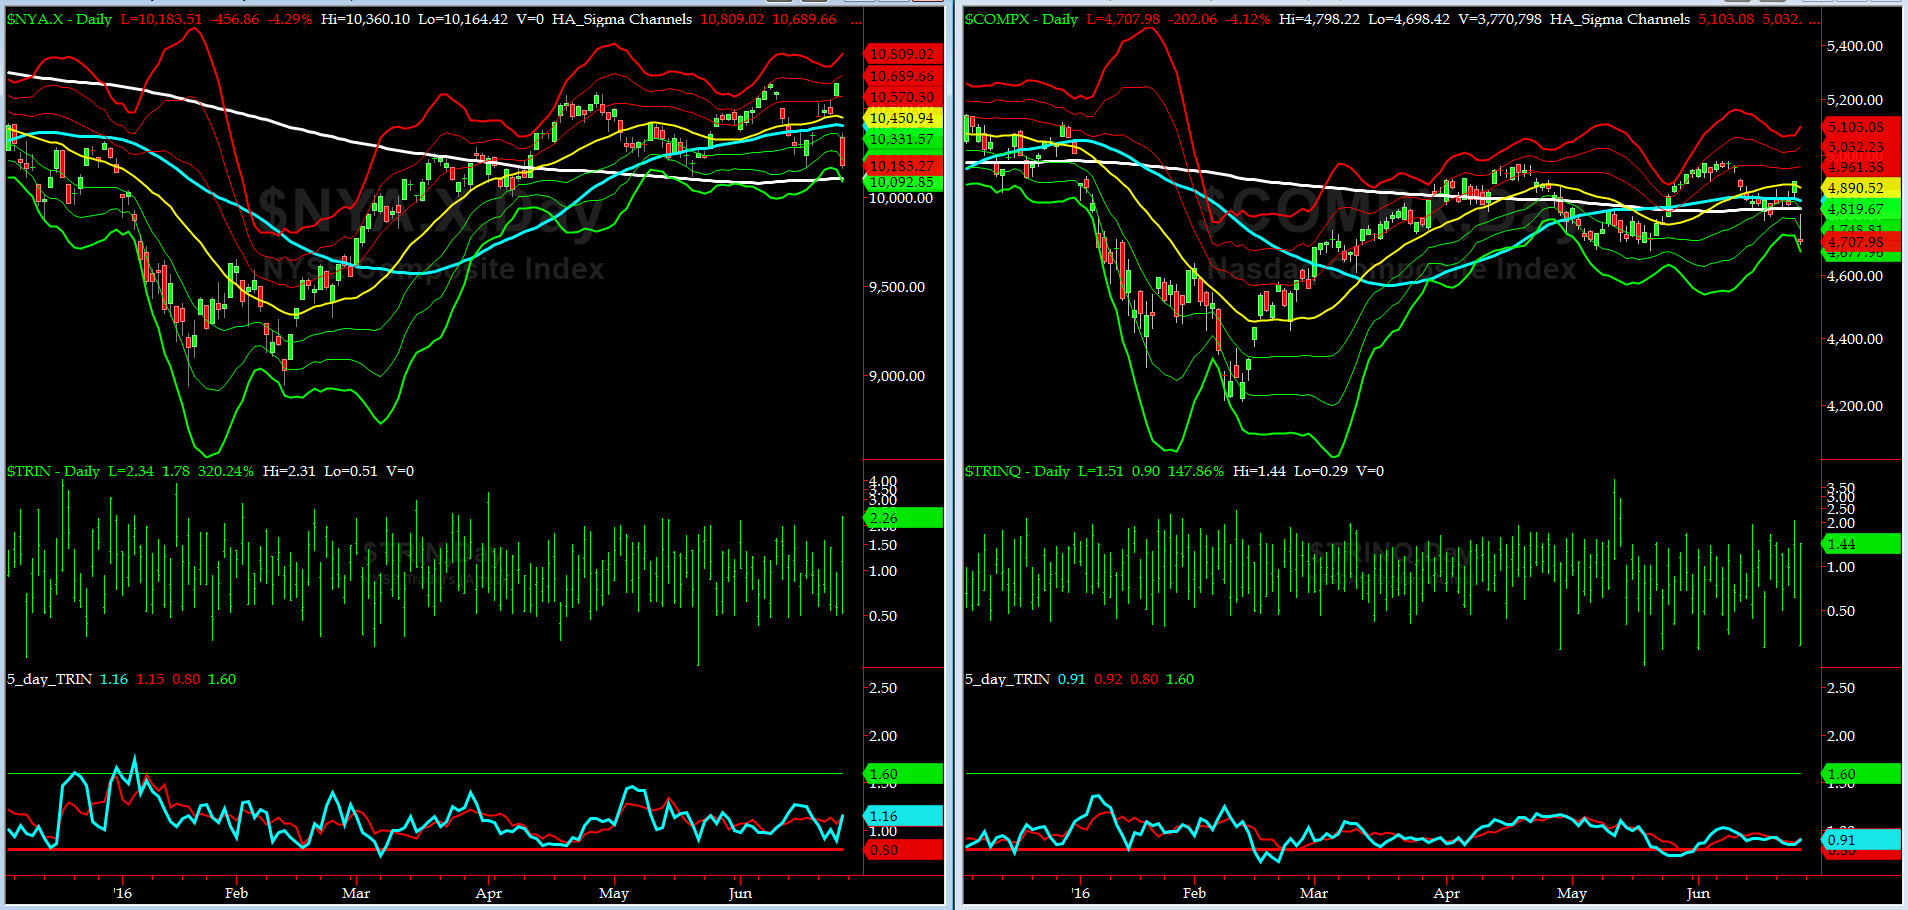
5-day TRIN & TRINQ Charts
Again, NO SIGNAL HERE........
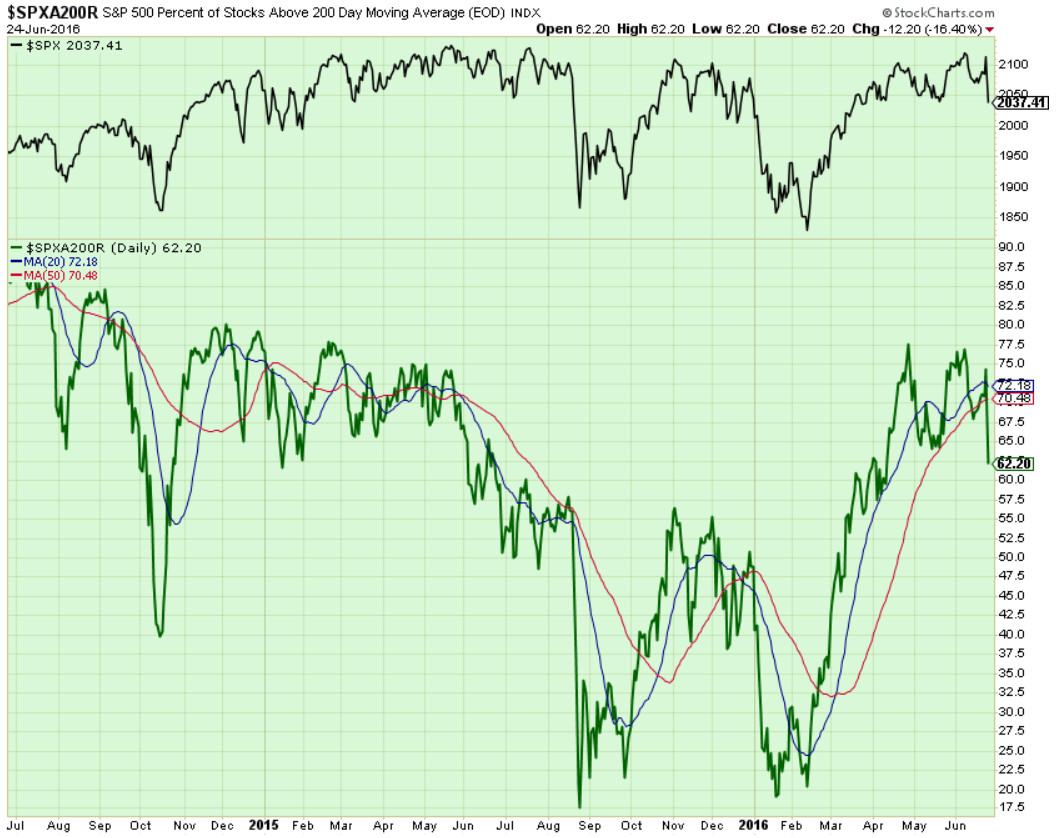
Components of SPX above their respective 200day MA Chart
This scoring indicator is stuck at 62%. Last week we wrote: "What is next? Most likely a retest of 60%.....note the bearish divergence (June high vs May)...." GOT TUNA?
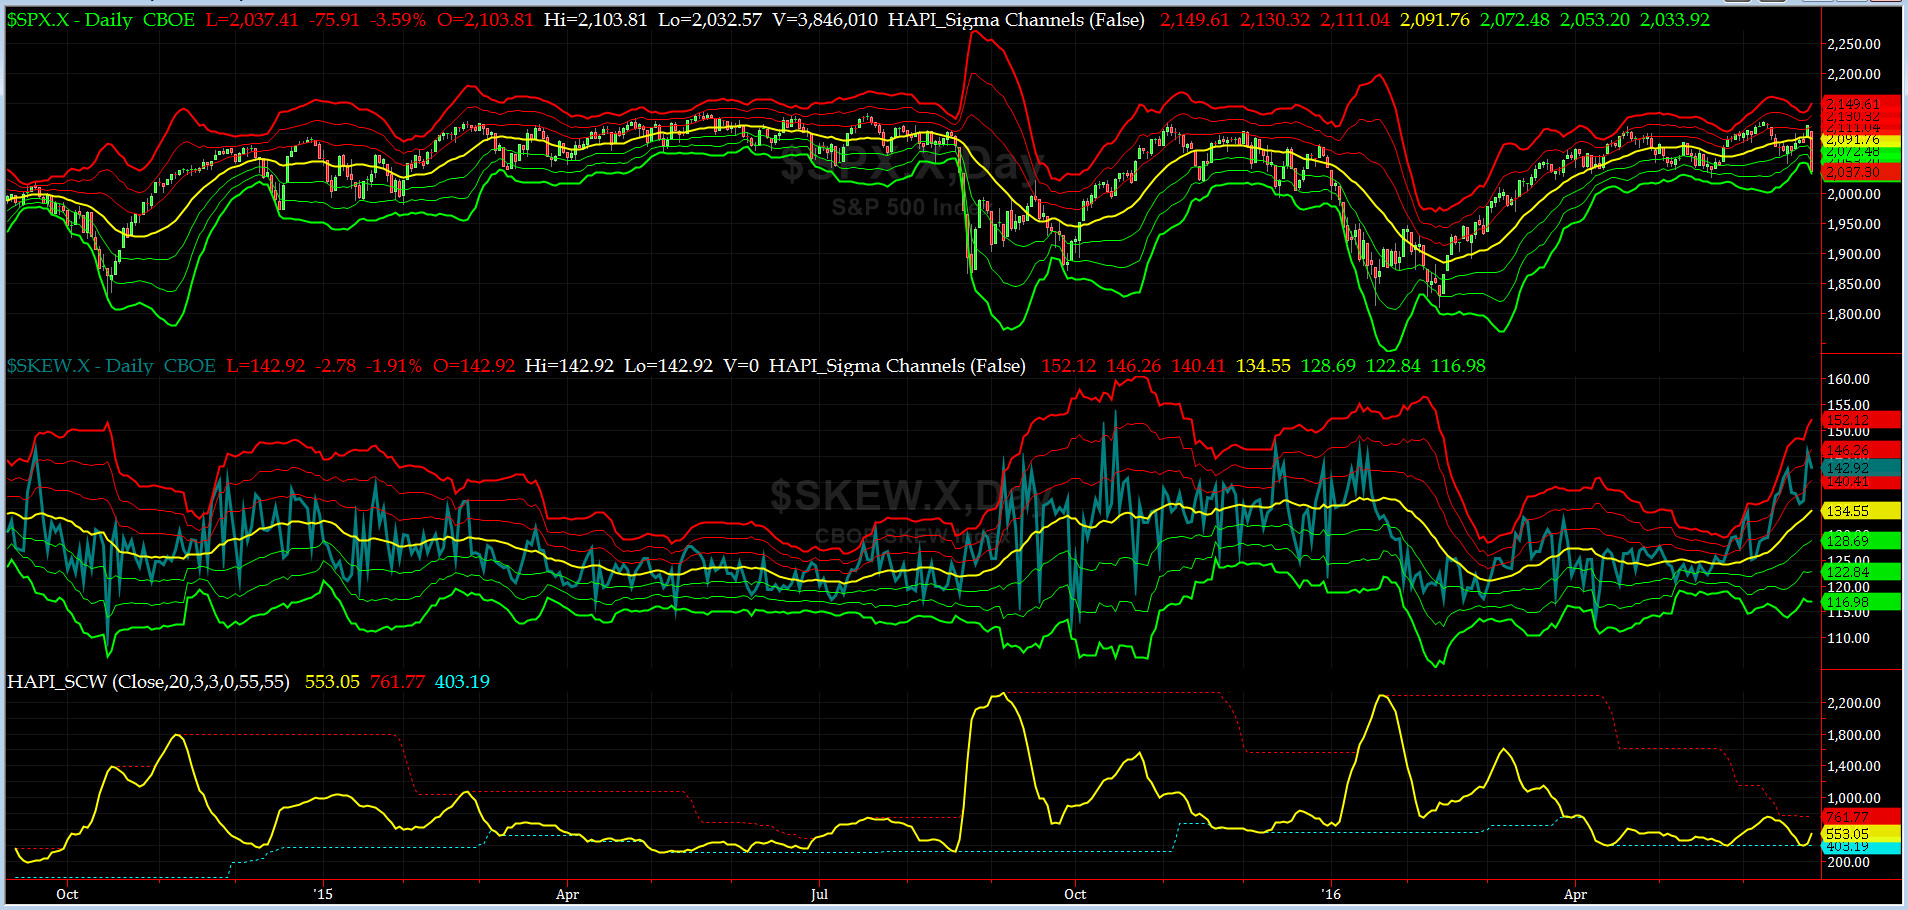
SPX SKEW (Tail Risk) Chart
SPX SKEW (Tail Risk) = rose to 143 and about its +1.5 sigma again (normal = 120-125, range 100-150)
All Quiet on the Mid-Western Front? Thursday night, SPX SKEW hit 145.70, only 18 basis point below its highest reading in CY 2016 (design max is 150) at +1.5 sigma channel. Are we heading for an outlier event shortly? Based on the current pattern of SKEW (TailRisk), some smart money players think so.
We are planning a "Summit with Tiko" this Fourth of July. We shall return to Cape Naples more enlightened.
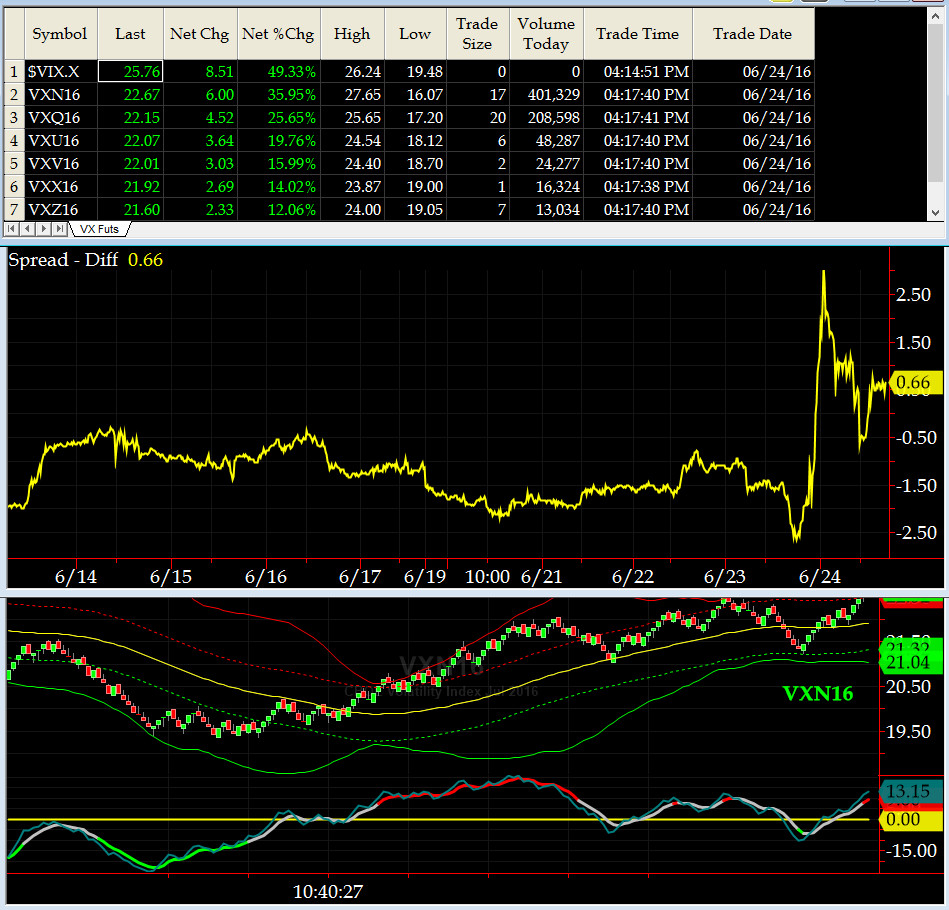
3-month VIX Futures Spread(VX) Chart
Our 3-month VIX Futures Spread (LONG JUL16 & SHORT OCT16) closed at 0.66 on Friday. As you can tell, Thursday Night & Friday this spread went wild. My eyes & Capt Tiko's were glued to this chart (slept only 3 hrs that night).
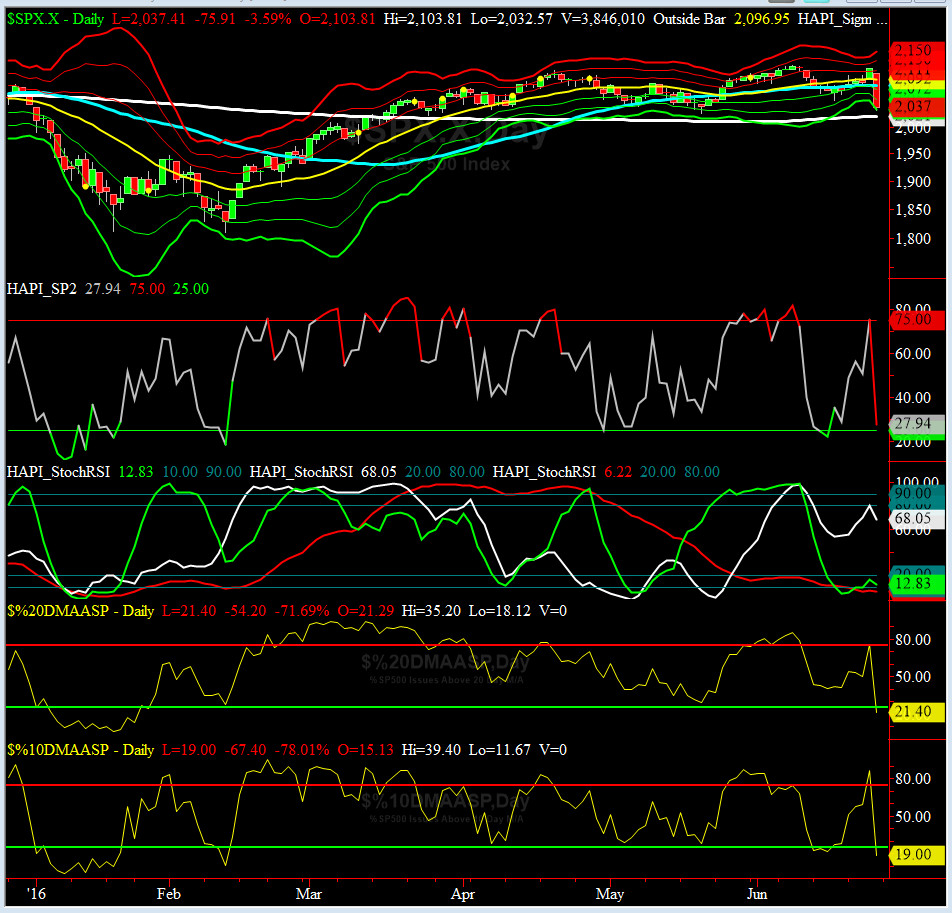
HA_SP2 Chart
HA_SP2 = 28 (Buy signal <= 25, Sell Signal >= 75)
Upon Thursday's Close, SP2 hit 75.48 (in Overbought territory). Closed on Friday just above Oversold (27.94). We wrote this indicator during the dotcom boom (circa 1998-1999). We have made only one change to it recently (Dec 14), and, never have seen a move like we saw on Friday, ever.
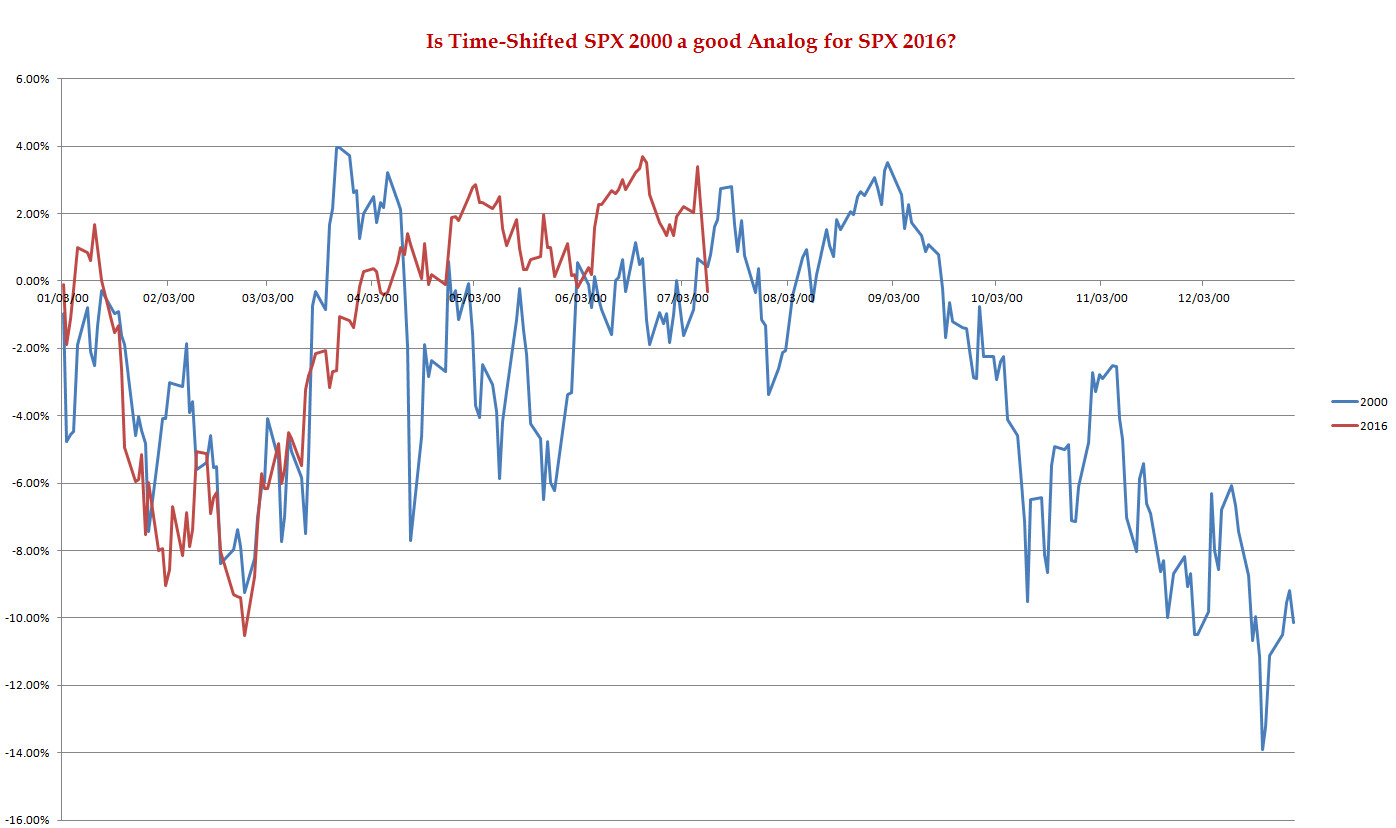
SPX 2000 Analog for SPX 2016
Last Wednesday, PreOpen, this Analog Chart called it to the penny: "If this Analog is correct, we shuold expect another 1% up...." Thursday Close was 1.17% above Tuesday Close. Not bad for a PDI and Tiko. LOL.
Now, this chart says expect about a 1.5% lower (for a retest failure) in near term.
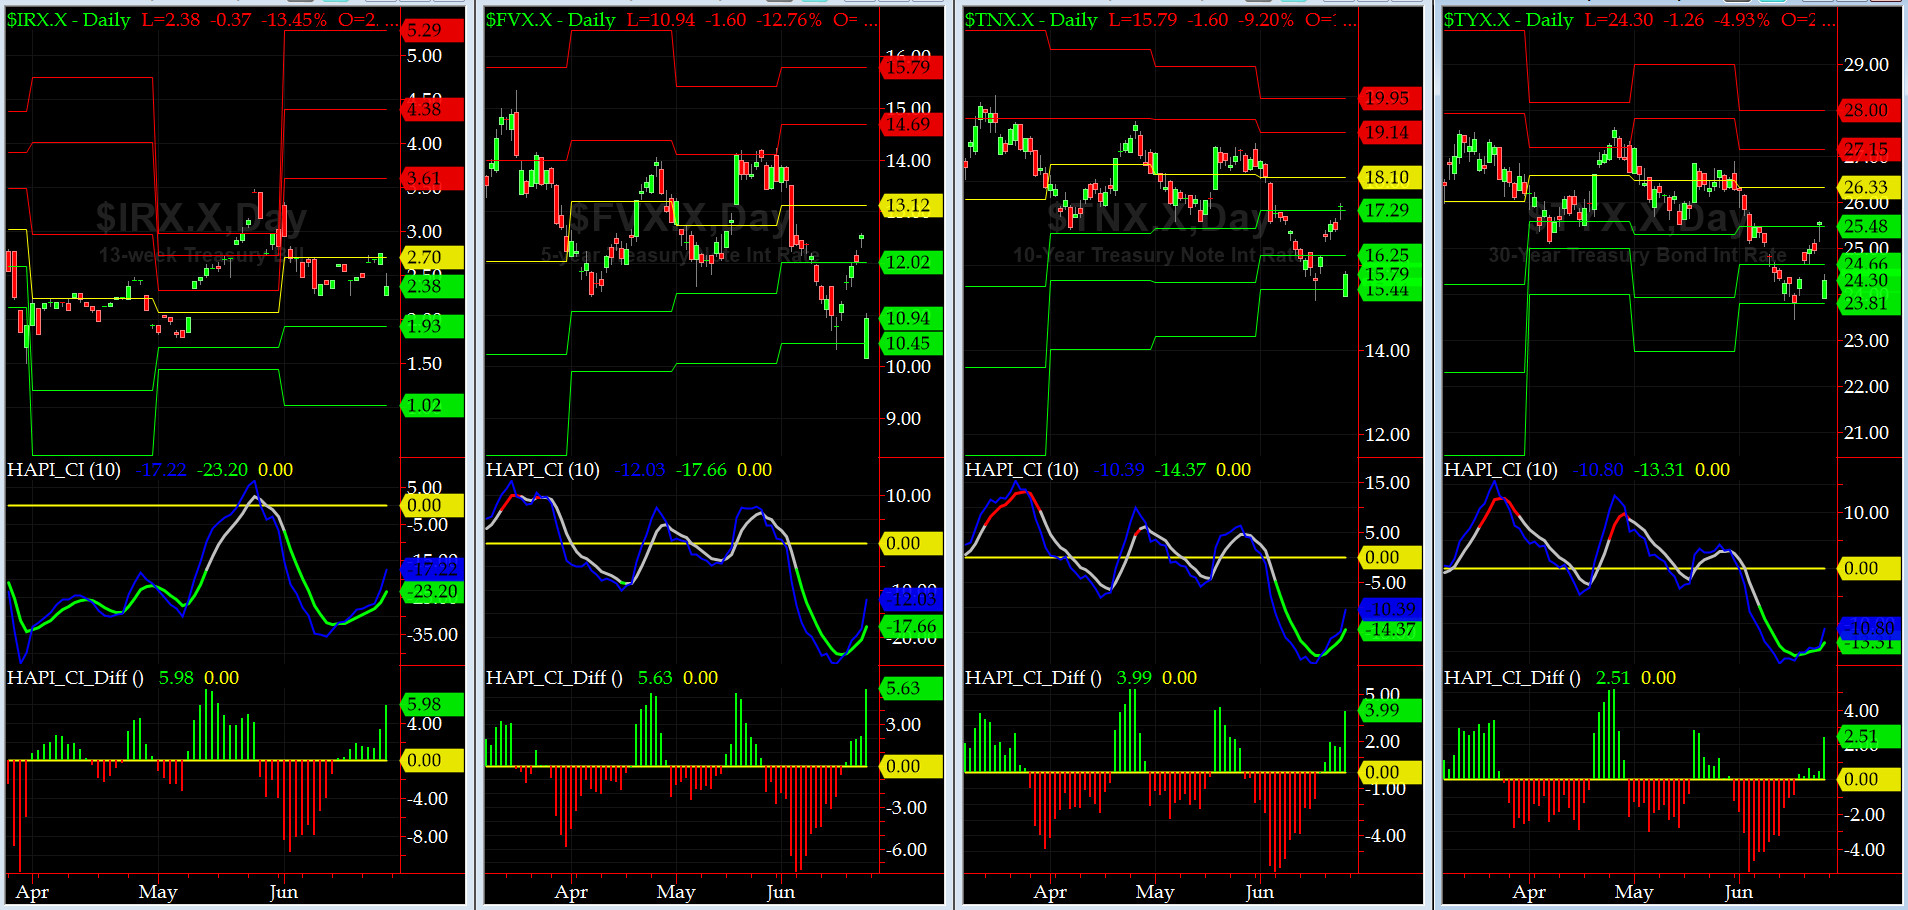
US Treasury T-Notes & T-Bonds Yields Chart
5 yr and longer dated US Paper hit their THIRD MONTHLY Support Levels again for second time this time. Here are the three most cherished words in the Bond Market vernacular: 'Flight to Safety....'
Fari Hamzei
|


 Proactive Market Timing