|
Monday, July 18, 2016, 0830ET
Market Timing Charts, Analysis & Commentary for Issue #151
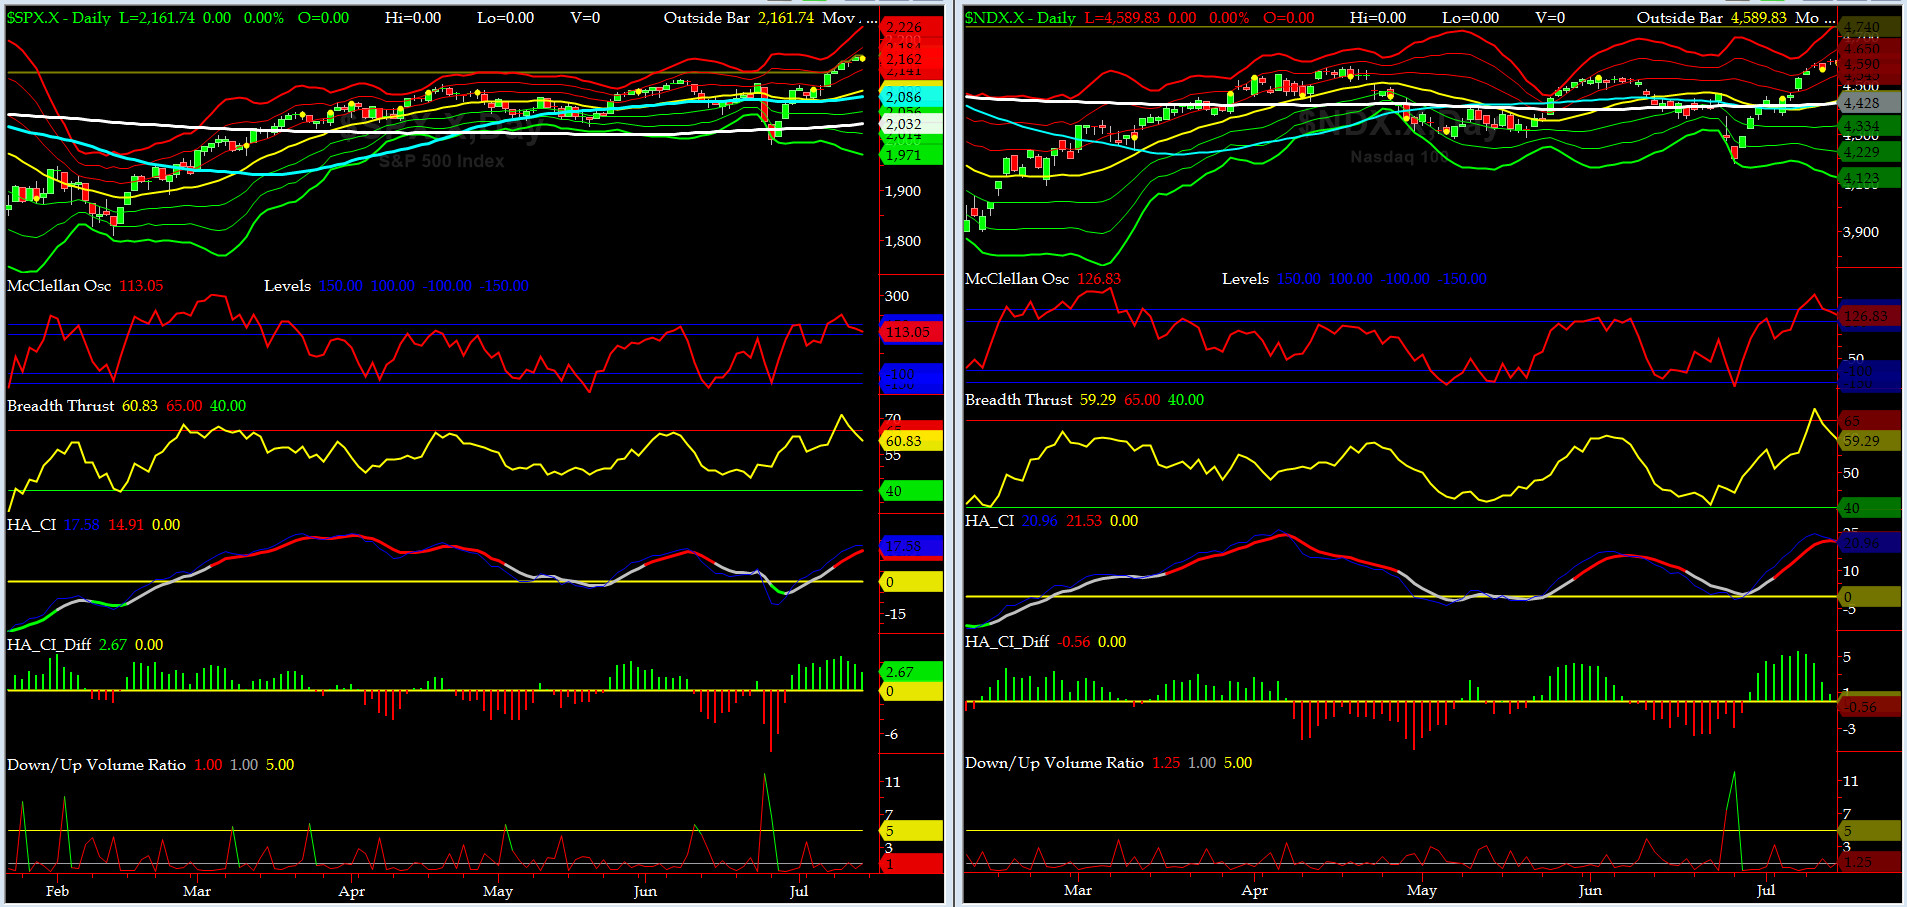
Timer Charts of S&P-500 Cash Index (SPX) + NASDAQ-100 Cash Index (NDX)
Most recent S&P-500 Cash Index (SPX): 2161.74 up +31.84 (up +1.5%) for the week ending on Friday, July 15th, 2016, which closed near its +1.5 sigma.
SPX ALL TIME INTRADAY HIGH = 2169.05 (reached on Friday, July 15, 2016)
SPX ALL TIME CLOSING HIGH = 2163.75 (reached on Thursday, July 14, 2016)
Current DAILY +2 Sigma SPX = 2184 with WEEKLY +2 Sigma = 2145
Current DAILY 0 Sigma (20 day MA) SPX = 2099 with WEEKLY 0 Sigma = 2071
Current DAILY -2 Sigma SPX = 2014 with WEEKLY -2 Sigma = 1997
NYSE McClellan Oscillator = +113 (-150 is start of the O/S area; around -275 to -300 area or lower, we go into the �launch-pad� mode, over +150, we are in O/B area)
NYSE Breadth Thrust = 61 (40 is considered as oversold and 65 as overbought)
SPX finally printed new All-Time-Highs.... so all is well in the Mid-Western Front? If you believe that, please contact us, we have a bridge for sale!!
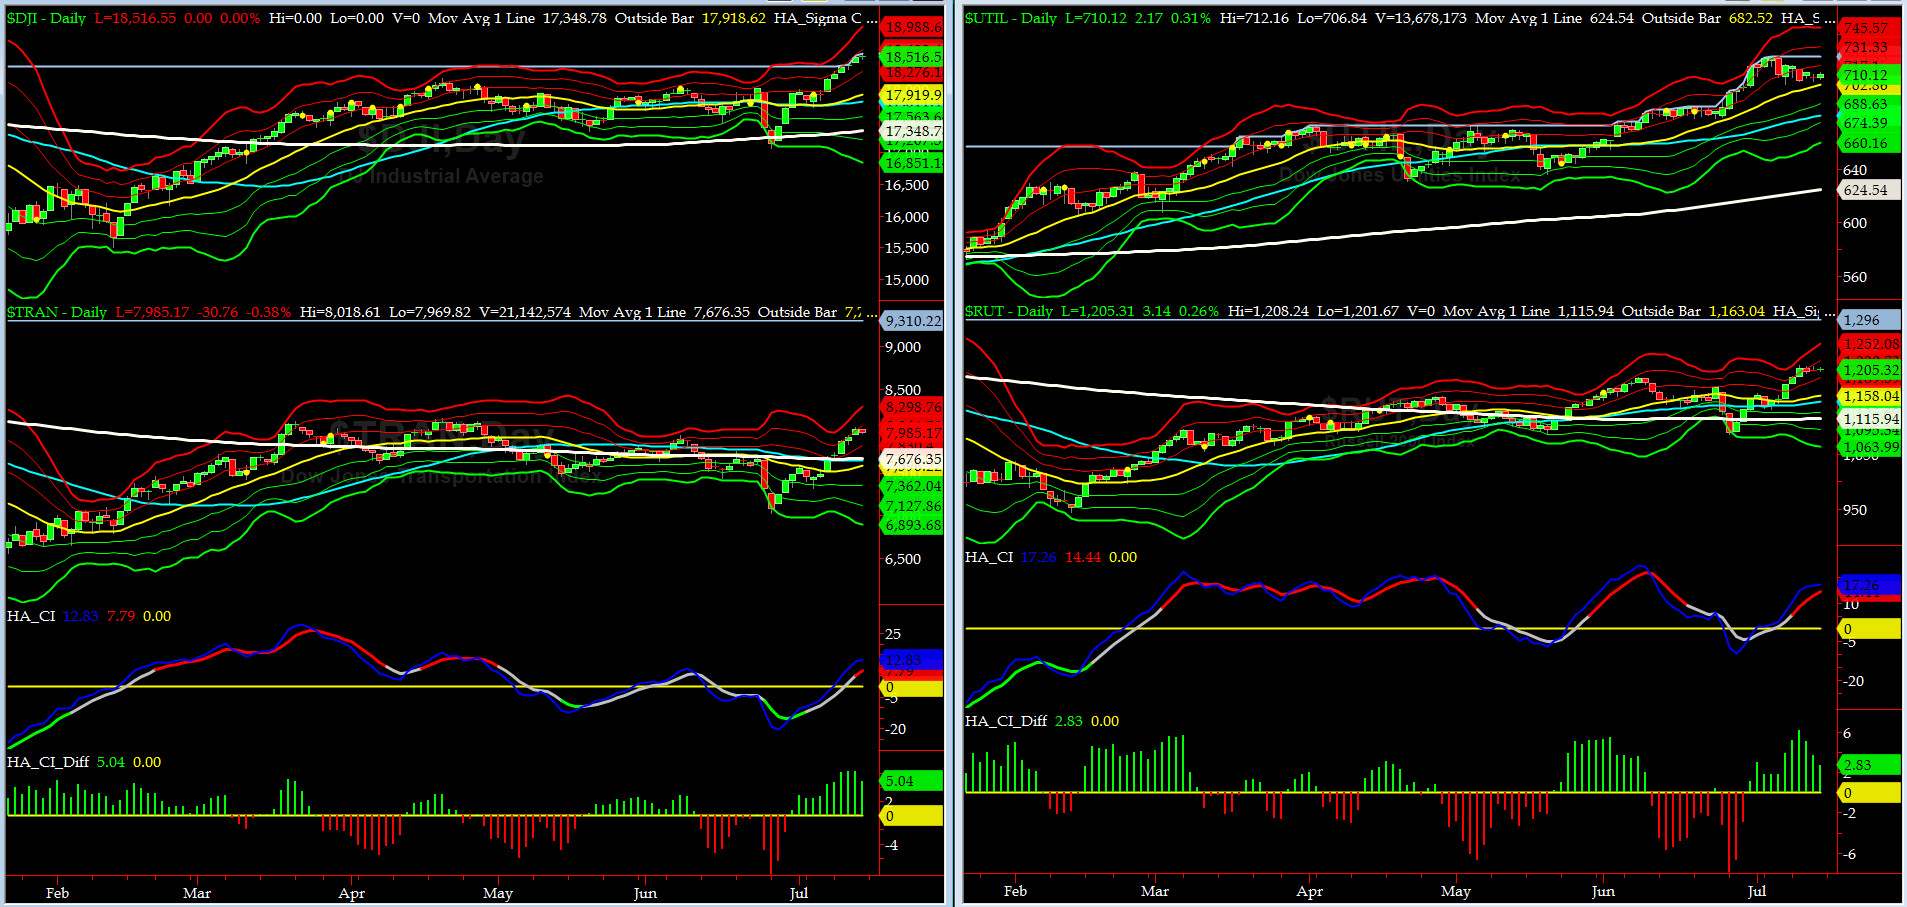
Canaries [in the Coal Mine] Chart for DJ TRAN & RUT Indices
200-Day MA DJ TRAN = 7676 or 4% below DJ TRAN (max observed in last 5 yrs = 20.2%, min = -20.3%)
200-Day MA RUT = 1115 or 8% below RUT (max observed in last 5 yrs = 21.3%, min = -22.6%)
DJ Transports (proxy for economic conditions 6 to 9 months hence) chart pattern is healthy again. It closed at very near +2 sigma on Friday.
Russell 2000 Small Caps (proxy for RISK ON/OFF) rallied first two days of the week and then went flat. RISK-ON is back.
A quick note from @Capt_Tiko: What is key to watch here is their CI Diffs.
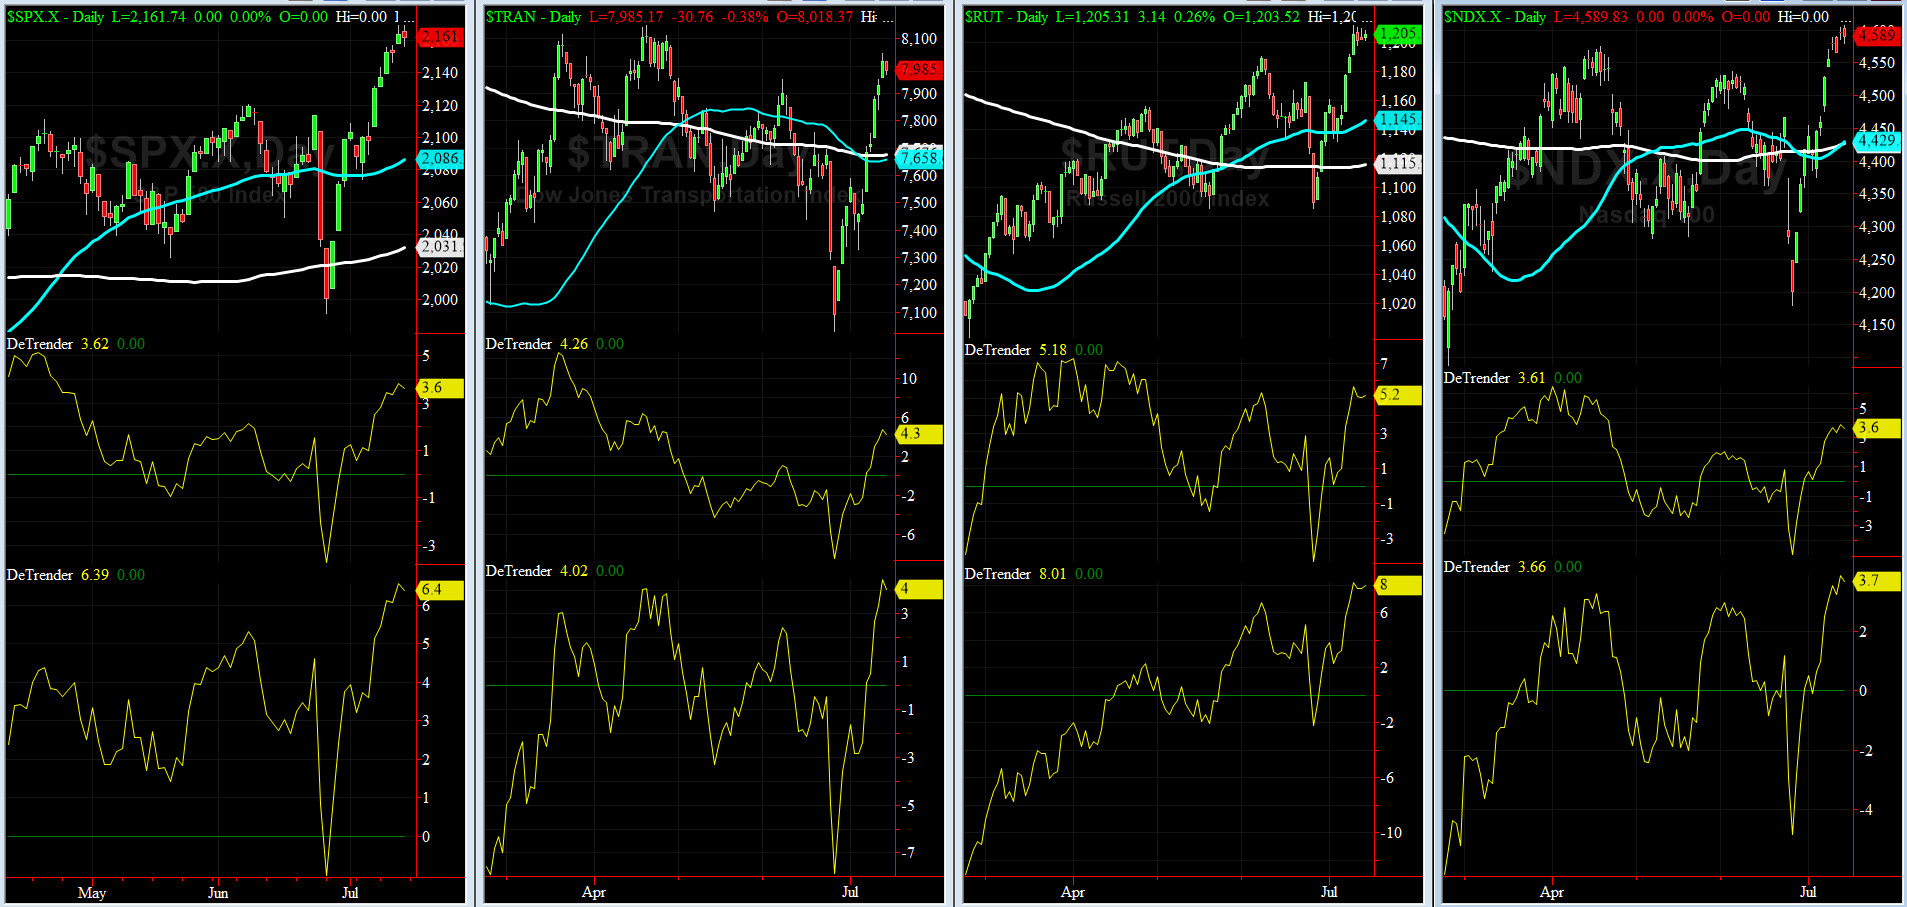
DeTrenders Charts for SPX, NDX, TRAN & RUT Indices
50-Day MA SPX = 2086 or 3.6% below SPX (max observed in last 5 yrs = +8.6%, min = -9.3%)
200-Day MA SPX = 2031 or 6.4% below SPX (max observed in last 5 yrs = 15.2%, min = -14%)
Again, this week ALL of our Eight DeTrenders are POSITIVE. DeTrenders for TRAN & RUT continue to get our attention.
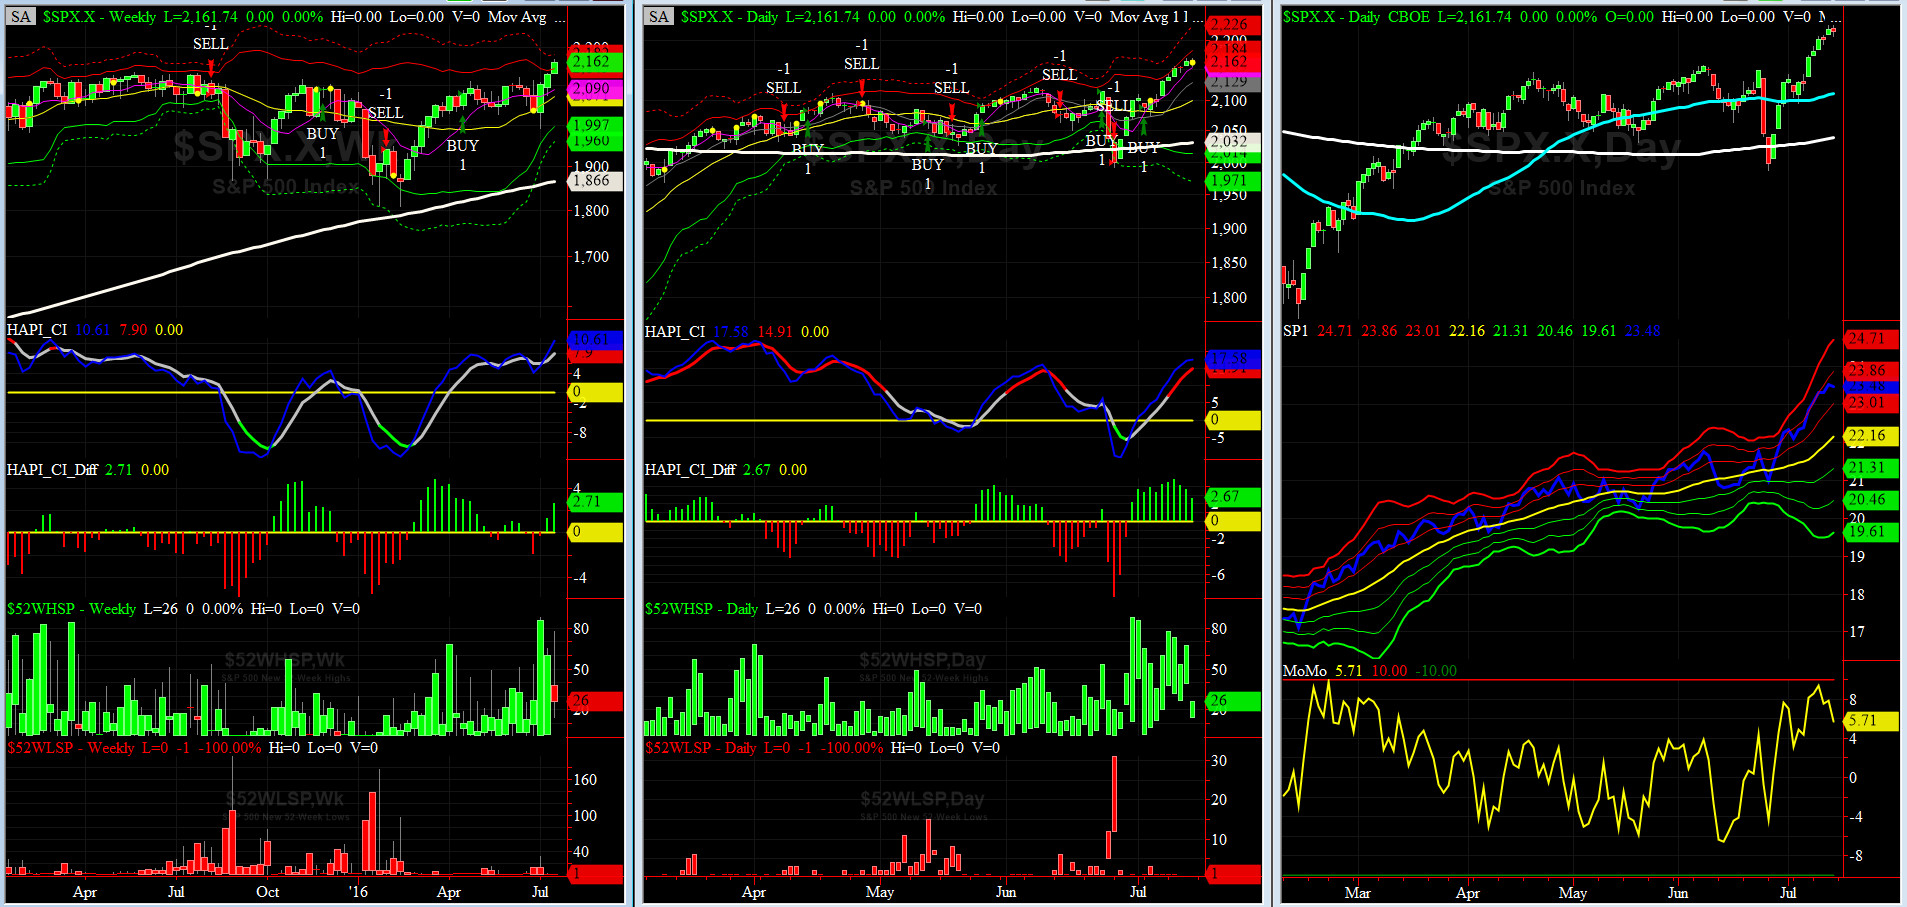
HA_SP1_Momo Chart
WEEKLY Timing Model = on a BUY Signal since Friday 4/15/16 CLOSE
DAILY Timing Model = on a BUY Signal since Tuesday 7/5/16 CLOSE
Max SPX 52wk-highs reading last week = 78 (over 120-140, the local maxima is in)
Max SPX 52wk-Lows reading last week = 1 (over 40-60, the local minima is in)
HA_SP1 = at its +1.5 sigma channels
HA_Momo = +5.7 (reversals most likely occur above +10 or below -10)
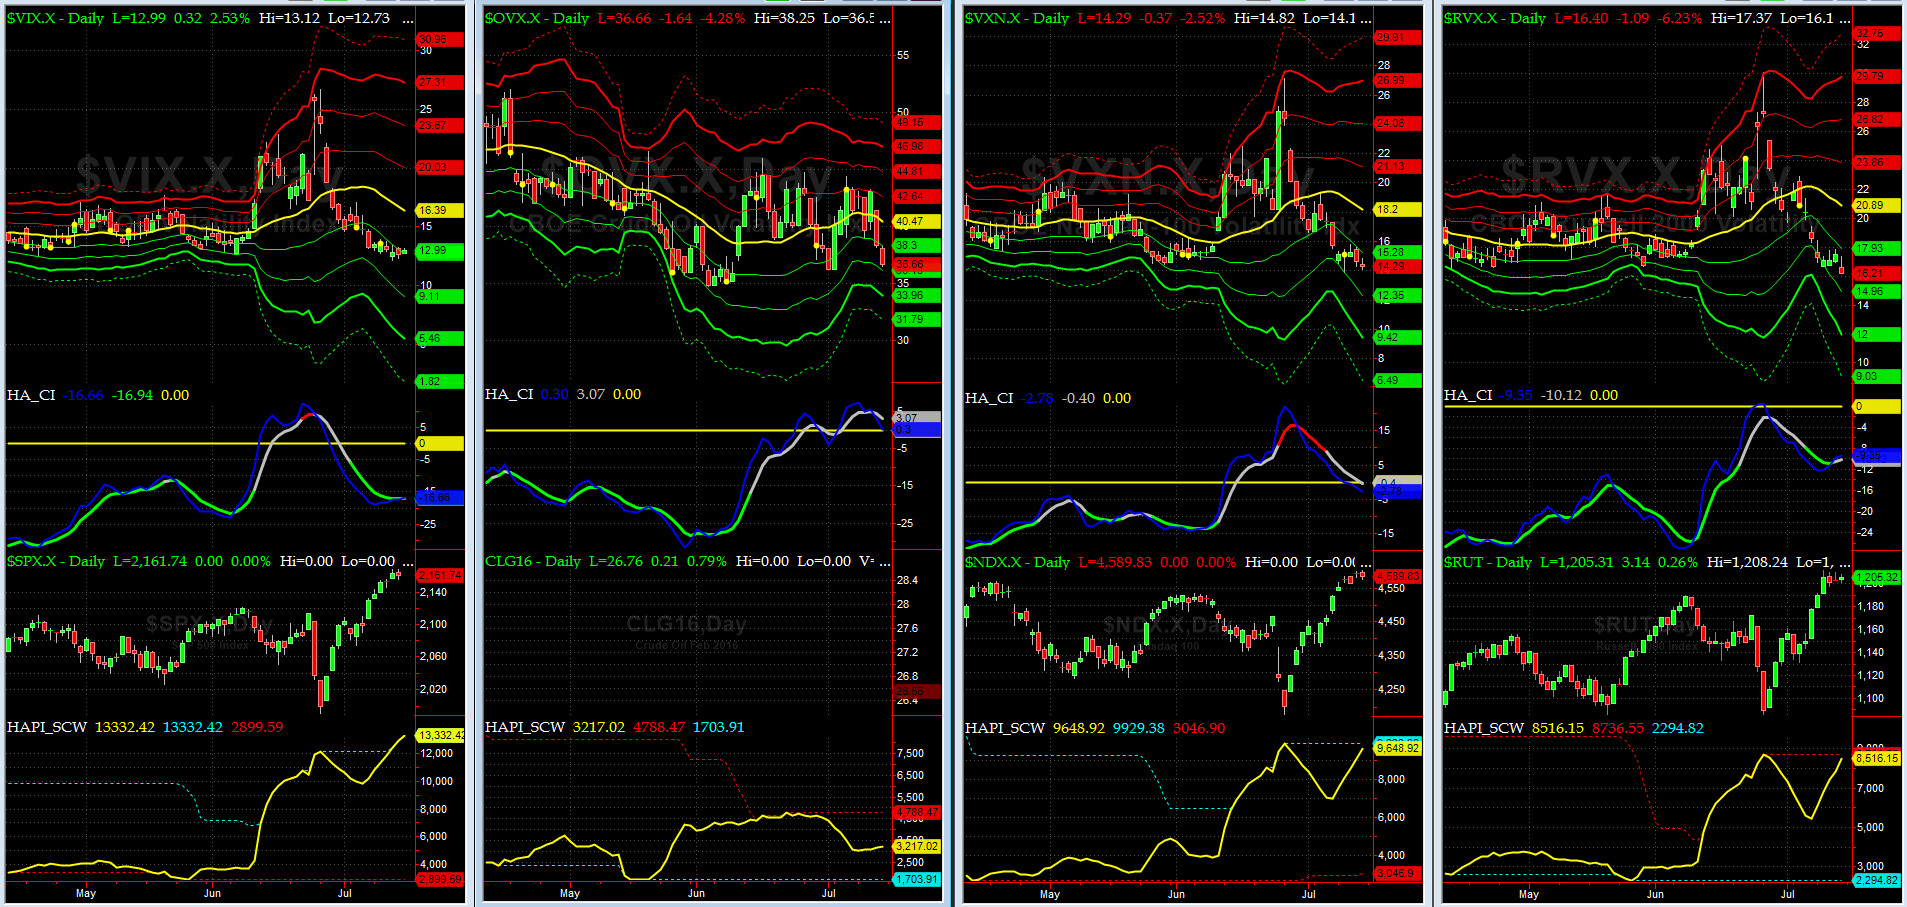
Vol of the Vols Chart
VIX = 12.85 is now at its -1 sigma (remember it�s the VIX�s vol pattern (its sigma channels) that matters, and not the level of VIX itself (this is per Dr. Robert Whaley, a great mentor and the inventor of original VIX, now called VXO). VIX usually peaks around a test of its +4 sigma).
VIX had a relatively quiet week. For OVX (vol index for crude), that was a different story.
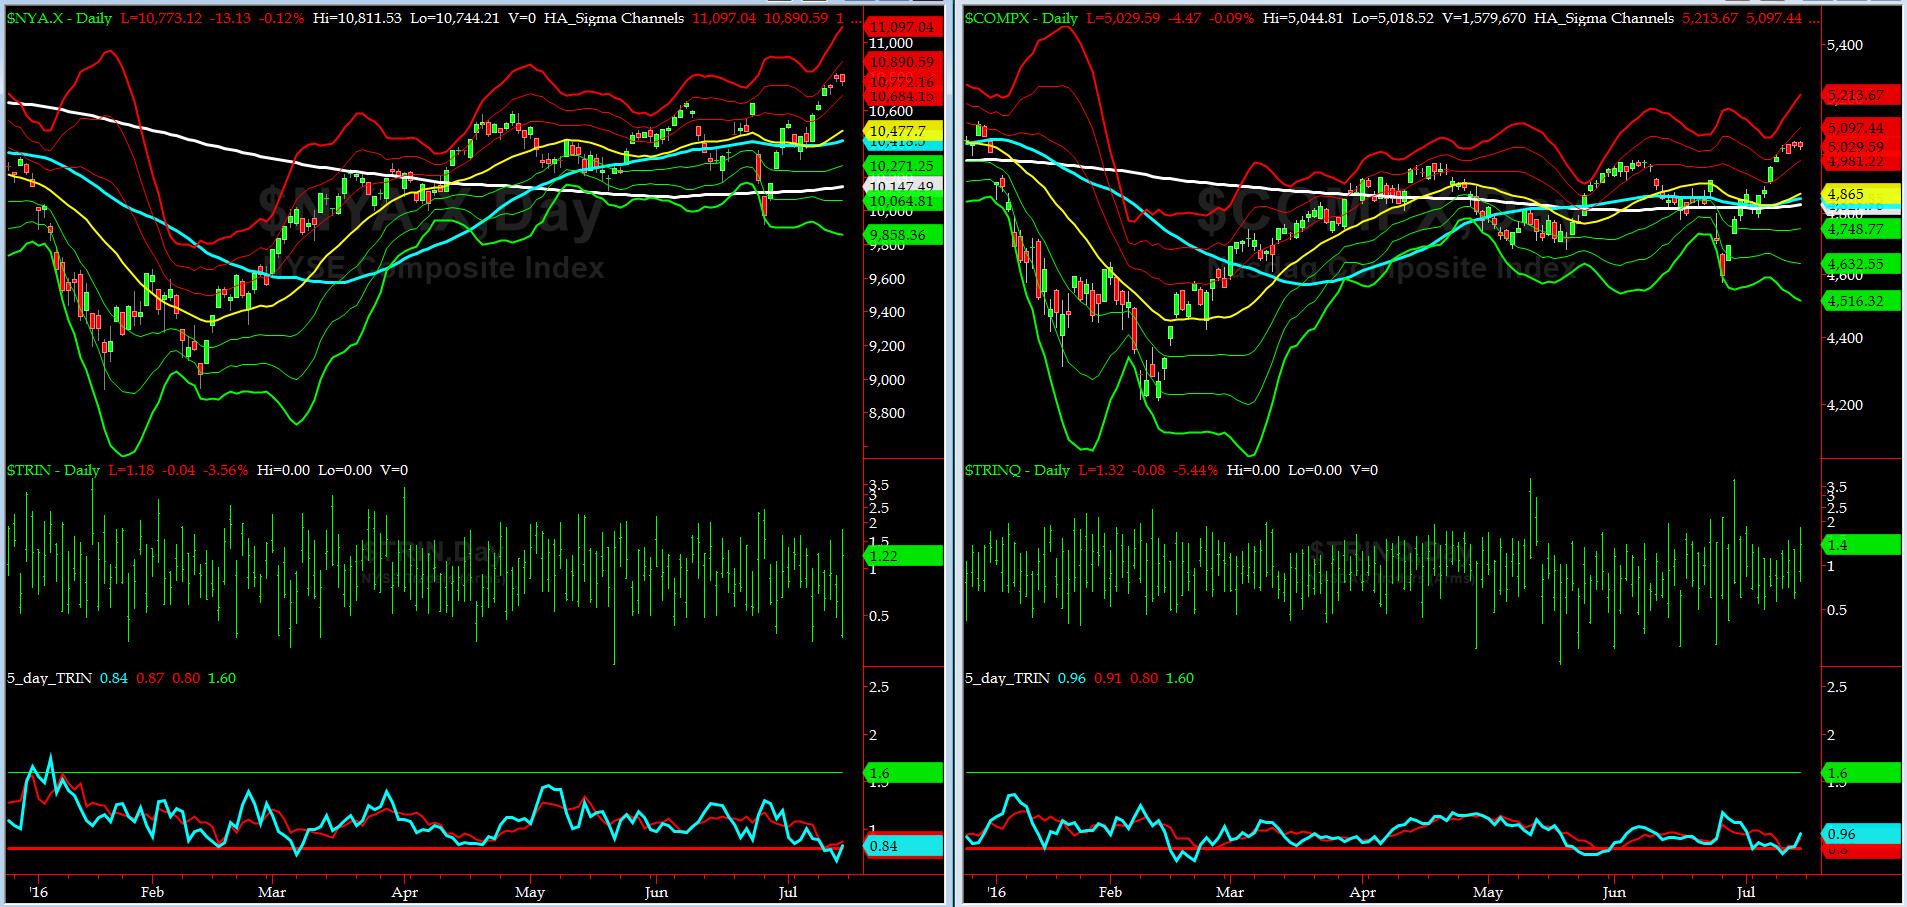
5-day TRIN & TRINQ Charts
BOTH charts continue to give SELL SIGNALs here........
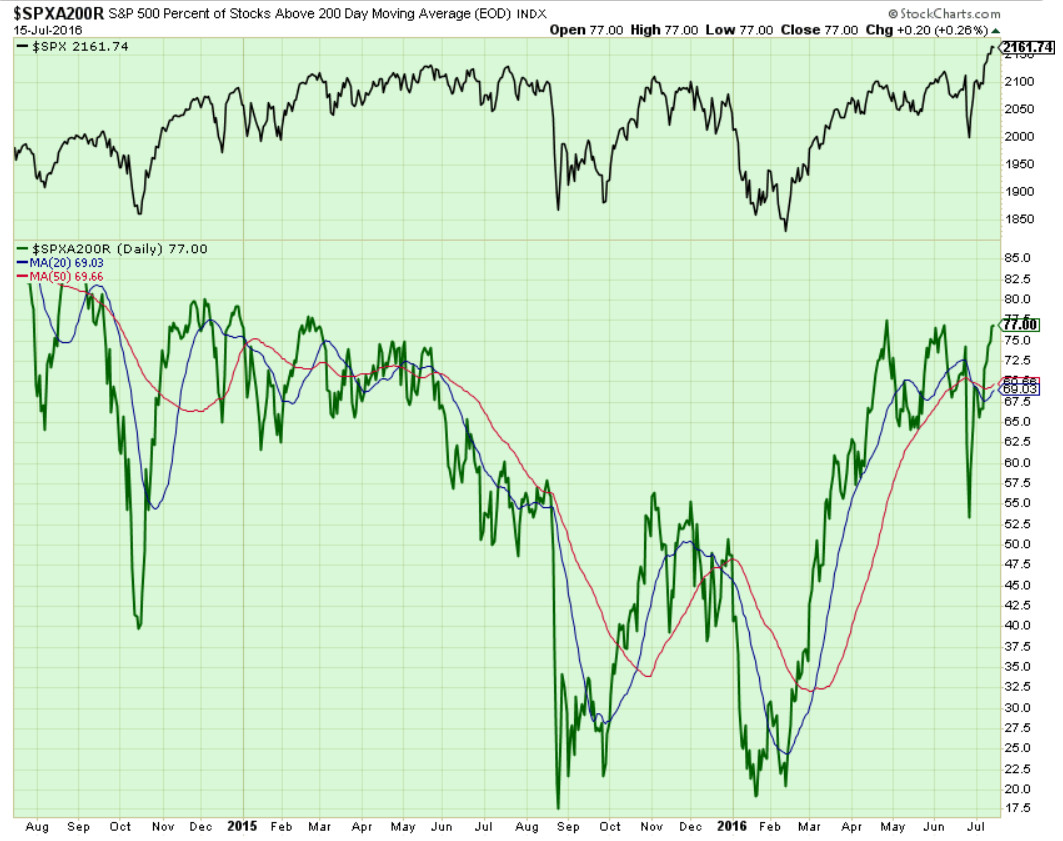
Components of SPX above their respective 200day MA Chart
This scoring indicator is back up to 77% now. A close above here and all bearish divergences will be reset.
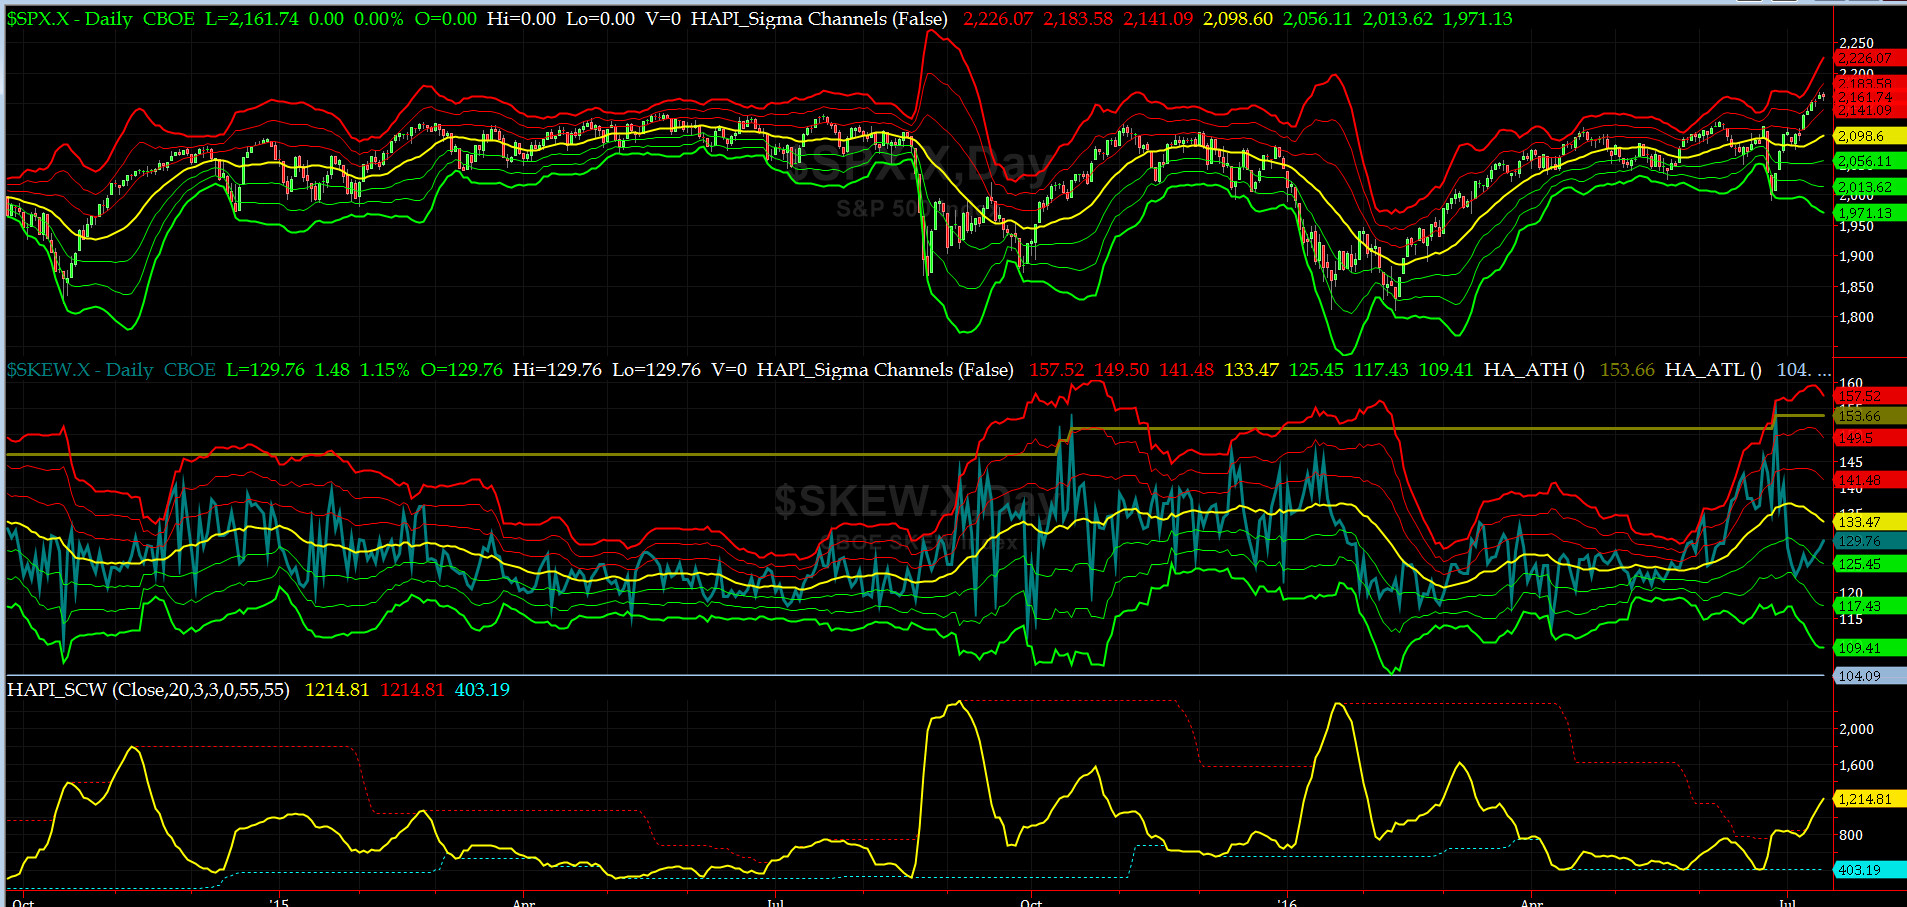
SPX SKEW (Tail Risk) Chart
SPX SKEW (Tail Risk) = rose to 130 after sinking to 123 (its -1 sigma on July 6th right before June NFP) (normal = 120-125, range 100-150)
All Quiet on the Mid-Western Front? Smart Money thinks so.
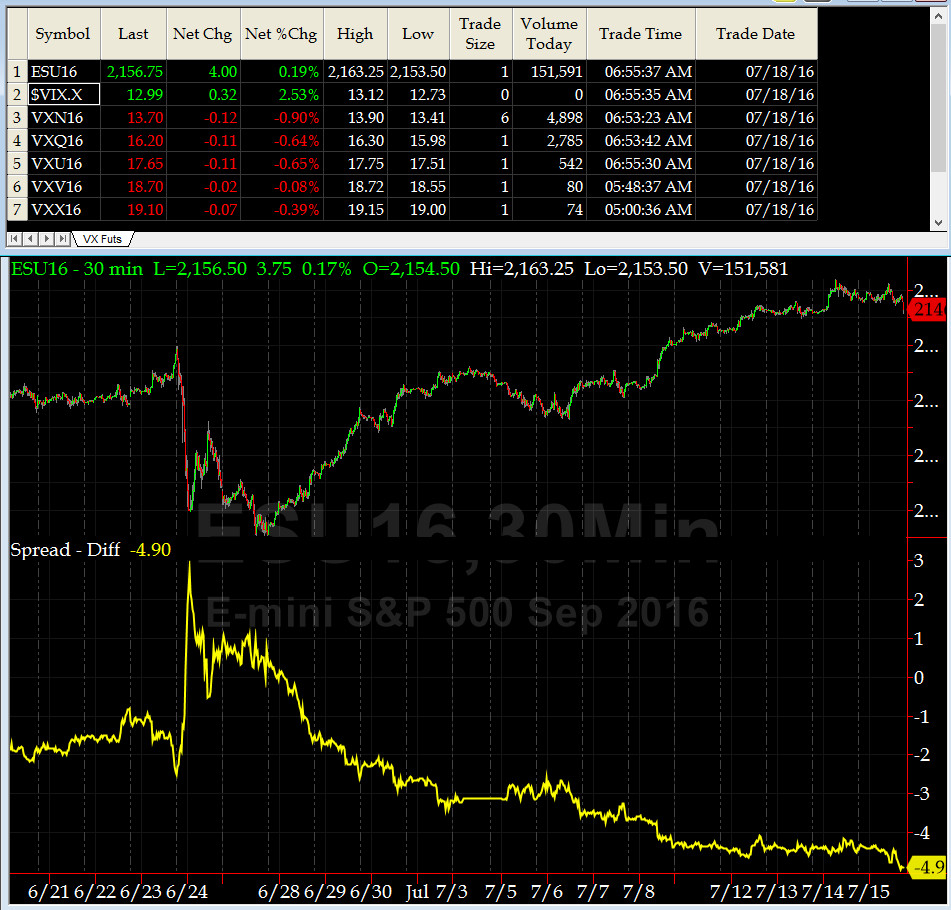
3-month VIX Futures Spread(VX) Chart
Our 3-month VIX Futures Spread (LONG JUL16 & SHORT OCT16) closed at -4.9 on Friday. As you can tell, this indicator says we are extremely overbought.
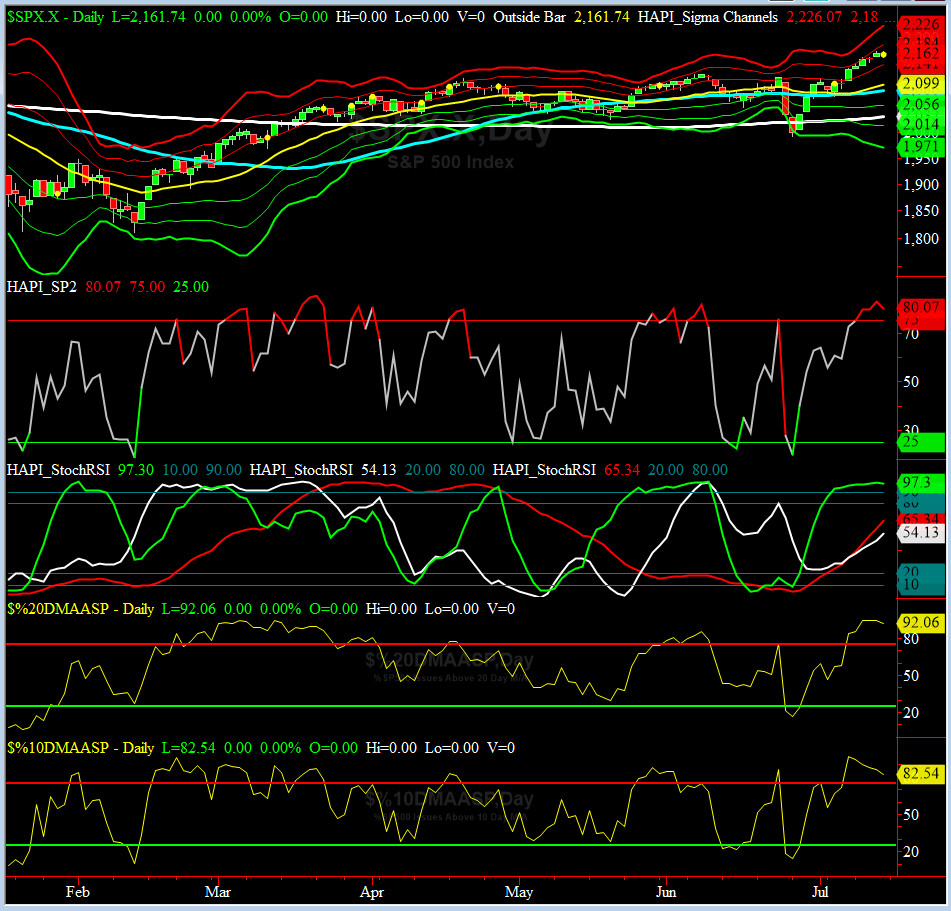
HA_SP2 Chart
HA_SP2 = 80 (Buy signal <= 25, Sell Signal >= 75)
This indicator also says we are extremely Overbought territory.
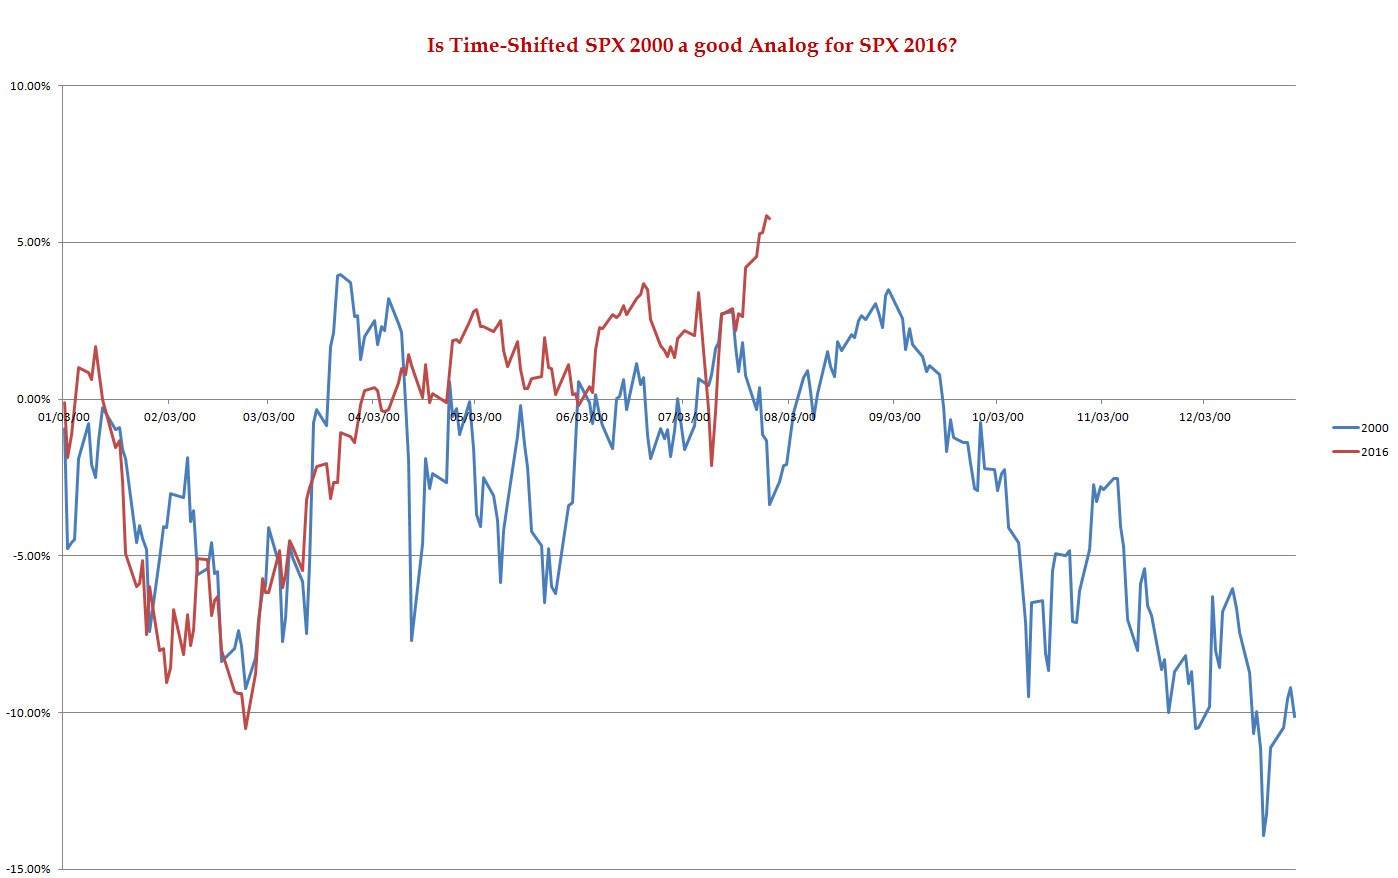
SPX 2000 Analog for SPX 2016
Simply Speechless
We may just trash this analog. We never liked a market that did not listen....LOL.

US Treasury T-Notes & T-Bonds Yields Chart
For the first time in so many weeks, we saw a healthy move in the US Treasury Complex.
Fari Hamzei
|


 Proactive Market Timing


