|
Saturday, July 30, 2016, 2115ET
Market Timing Charts, Analysis & Commentary for Issue #153

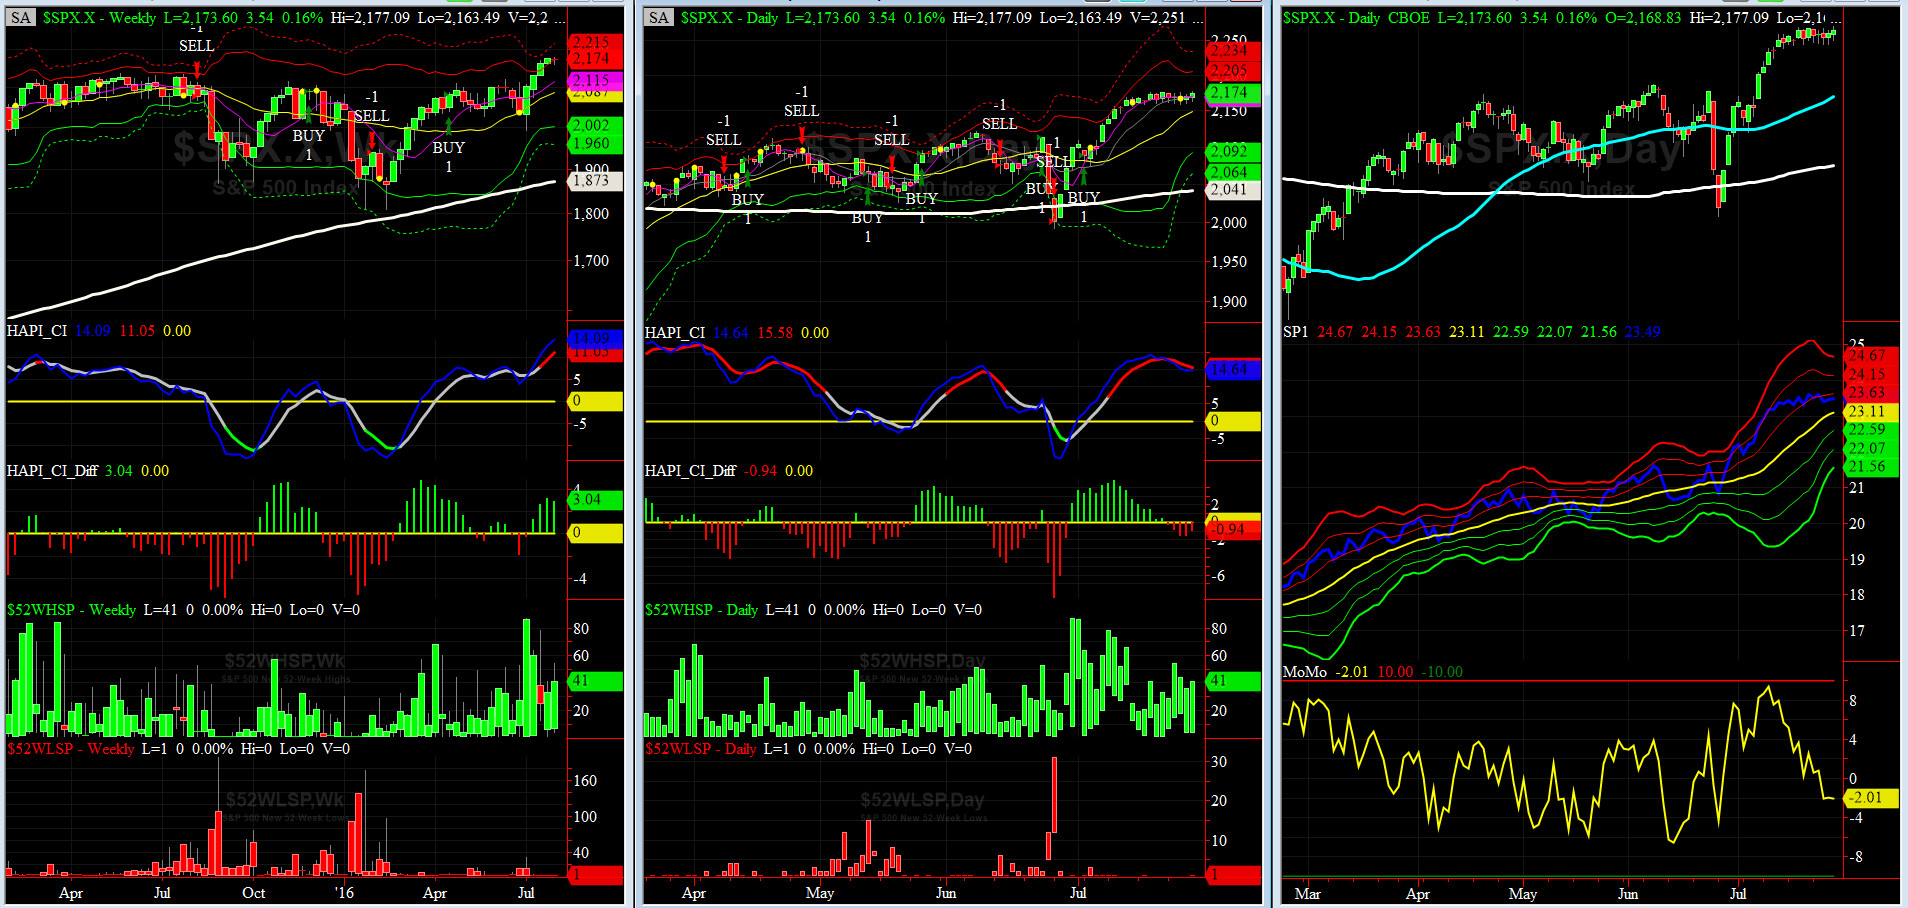
Timer Charts of S&P-500 Cash Index (SPX) & NASDAQ-100 Cash Index (NDX)
Most recent S&P-500 Cash Index (SPX): 2173.60 down -1.43 (down -0.06%) for the week ending on Friday, July 29th, 2016, which closed at its +1 sigma.
SPX ALL TIME INTRADAY HIGH = 2177.09 (reached on Friday, July 29, 2016)
SPX ALL TIME CLOSING HIGH = 2175.03 (reached on Friday, July 22, 2016)
Current DAILY +2 Sigma SPX = 2205 with WEEKLY +2 Sigma = 2172
Current DAILY 0 Sigma (20 day MA) SPX = 2149 with WEEKLY 0 Sigma = 2087
Current DAILY -2 Sigma SPX = 2092 with WEEKLY -2 Sigma = 2002
NYSE McClellan Oscillator = -9 (-150 is start of the O/S area; around -275 to -300 area or lower, we go into the �launch-pad� mode, over +150, we are in O/B area)
NYSE Breadth Thrust = 54 (40 is considered as oversold and 65 as overbought)
Romans were everywhere this week. Just look at the range.
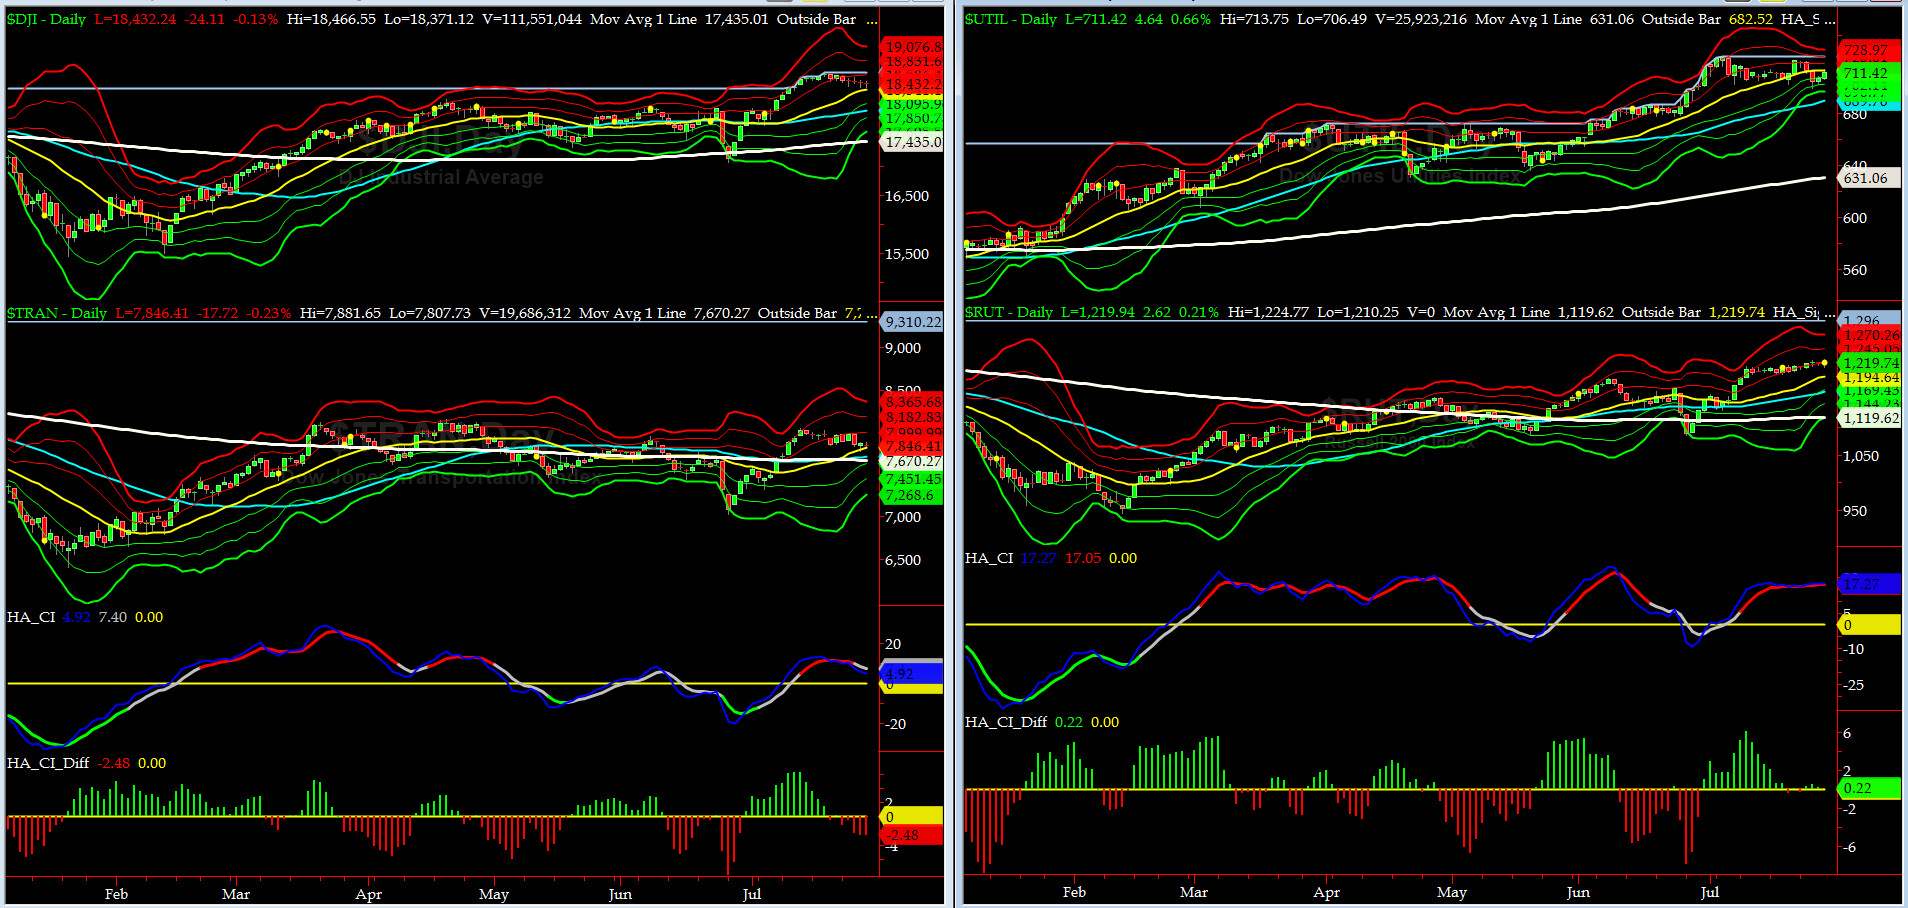
Canaries [in the Coal Mine] Chart for DJ TRAN & RUT Indices
200-Day MA DJ TRAN = 7670 or 2.3% below DJ TRAN (max observed in last 5 yrs = 20.2%, min = -20.3%)
200-Day MA RUT = 1119 or 8.9% below RUT (max observed in last 5 yrs = 21.3%, min = -22.6%)
DJ Transports (proxy for economic conditions 6 to 9 months hence) eased off more during the last week and closed at its zero sigma.
Russell 2000 Small Caps (proxy for RISK ON/OFF) was flat-lined last week at its +1 sigma.
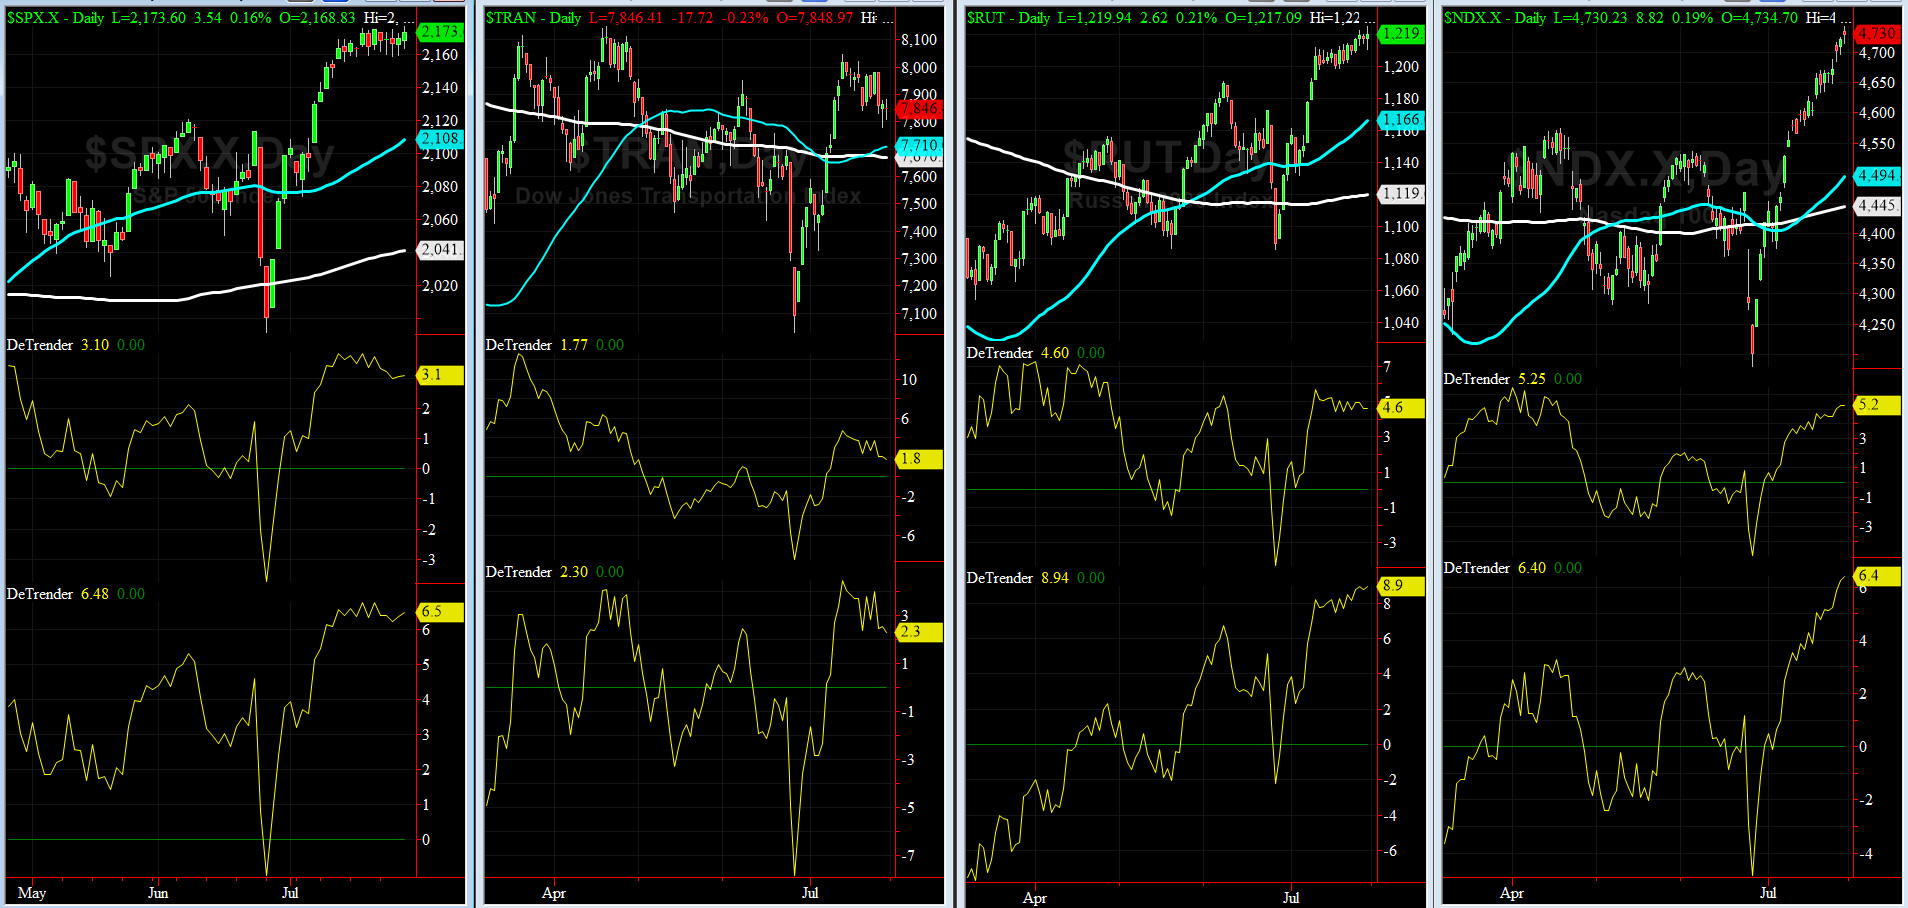
DeTrenders Charts for SPX, NDX, TRAN & RUT Indices
50-Day MA SPX = 2108 or 3.1% below SPX (max observed in last 5 yrs = +8.6%, min = -9.3%)
200-Day MA SPX = 2041 or 6.5% below SPX (max observed in last 5 yrs = 15.2%, min = -14%)
Again, this week ALL of our Eight DeTrenders are POSITIVE.
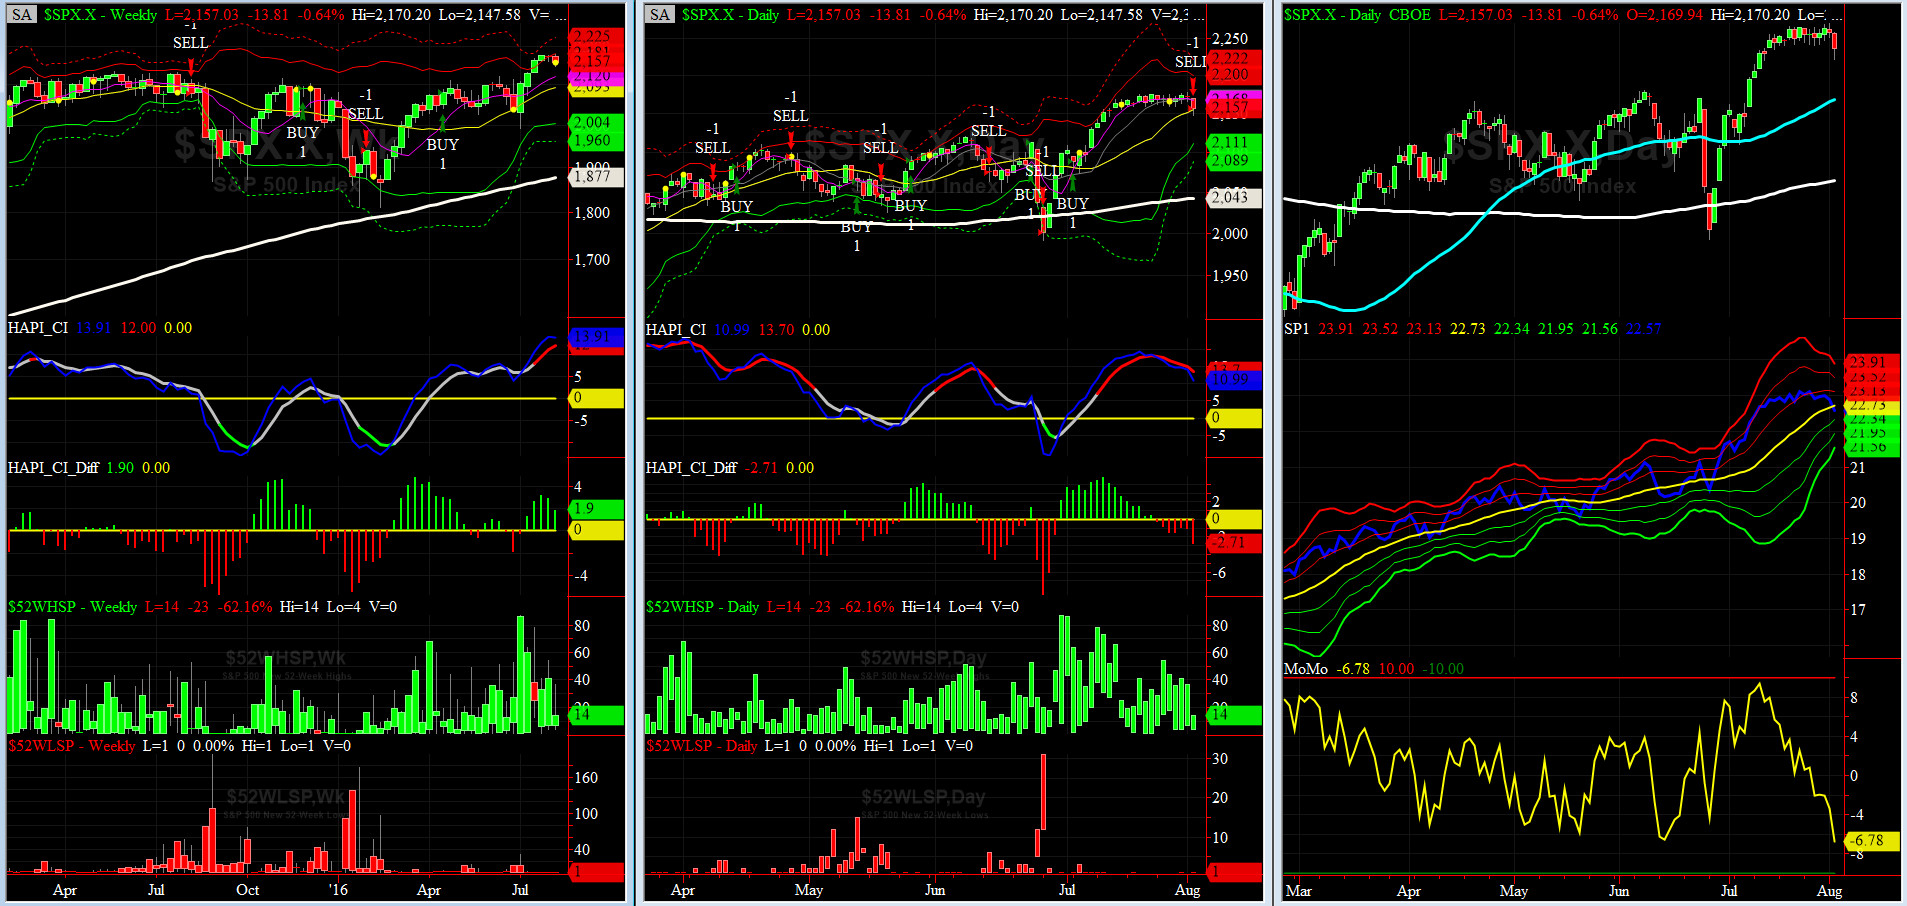
HA_SP1_Momo Chart
WEEKLY Timing Model = on a BUY Signal since Friday 4/15/16 CLOSE
DAILY Timing Model = on a BUY Signal since Tuesday 7/5/16 CLOSE
Max SPX 52wk-highs reading last week = 54 (over 120-140, the local maxima is in)
Max SPX 52wk-Lows reading last week = 1 (over 40-60, the local minima is in)
HA_SP1 = just below its +1 sigma channels
HA_Momo = -2 (reversals most likely occur above +10 or below -10)
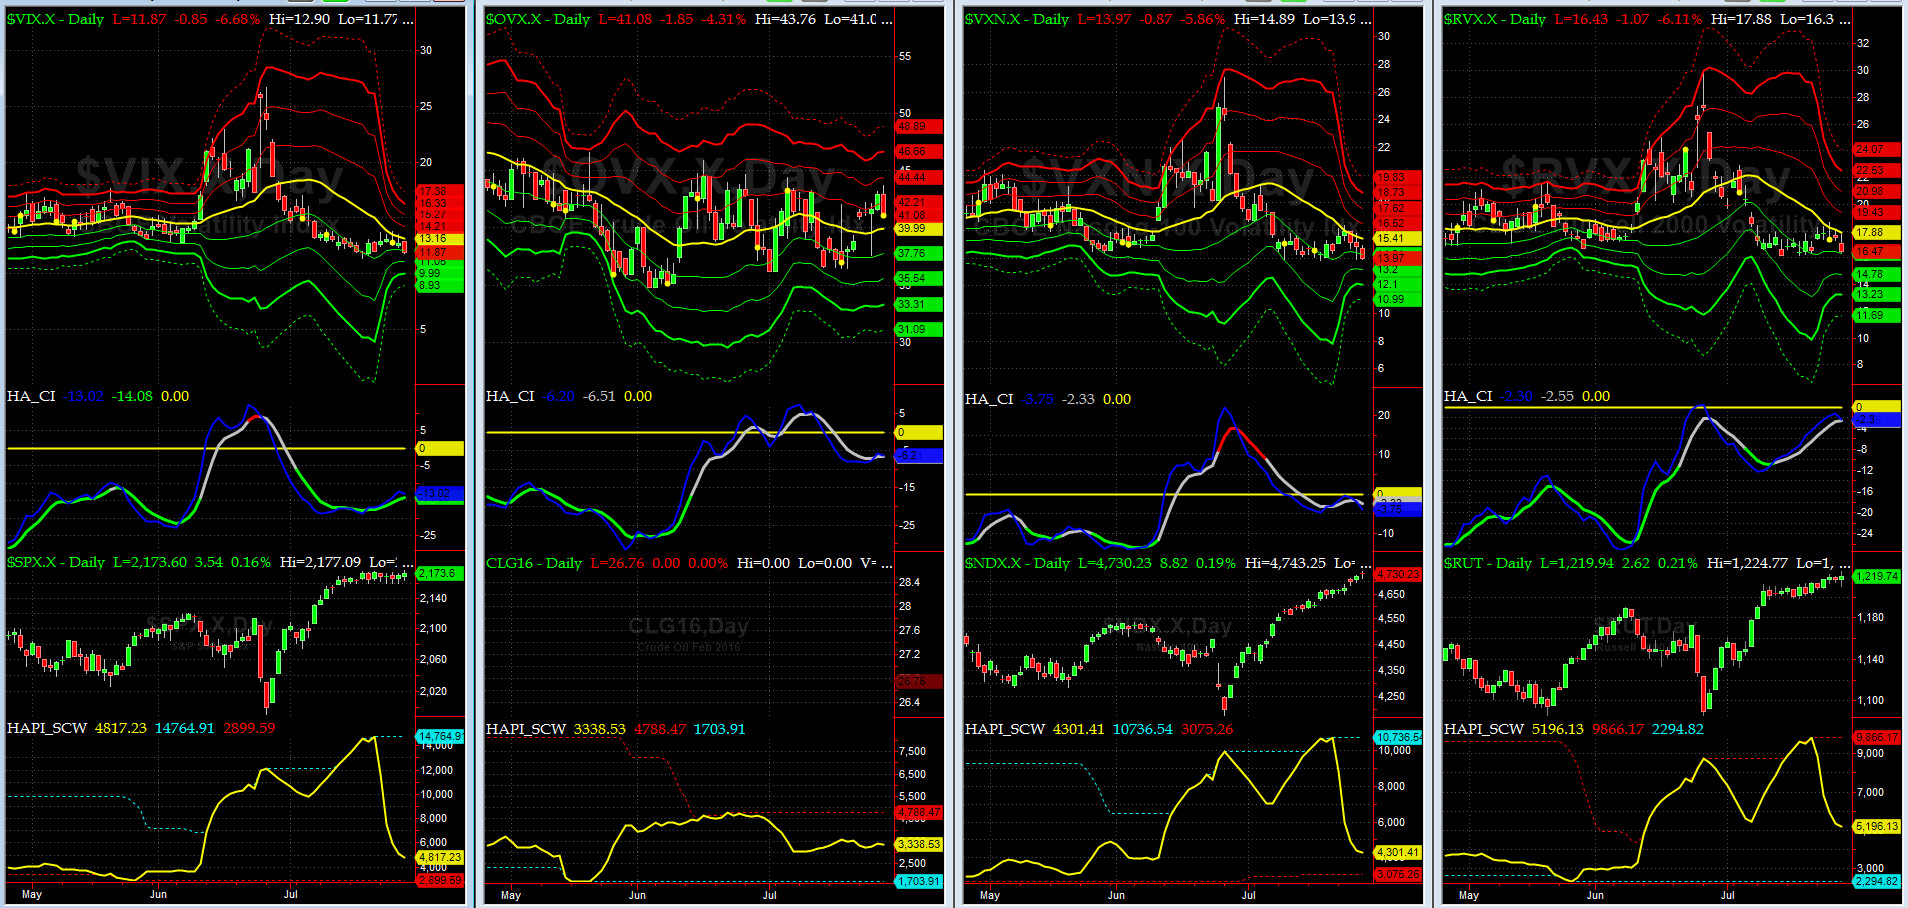
Vol of the Vols Chart
VIX = 11.87 is at its -1 sigma (remember it�s the VIX�s vol pattern (its sigma channels) that matters, and not the level of VIX itself (this is per Dr. Robert Whaley, a great mentor and the inventor of original VIX, now called VXO). VIX usually peaks around a test of its +4 sigma).
All Vol indices had a fairly quiet week. ROMANs occupied every foxhole.
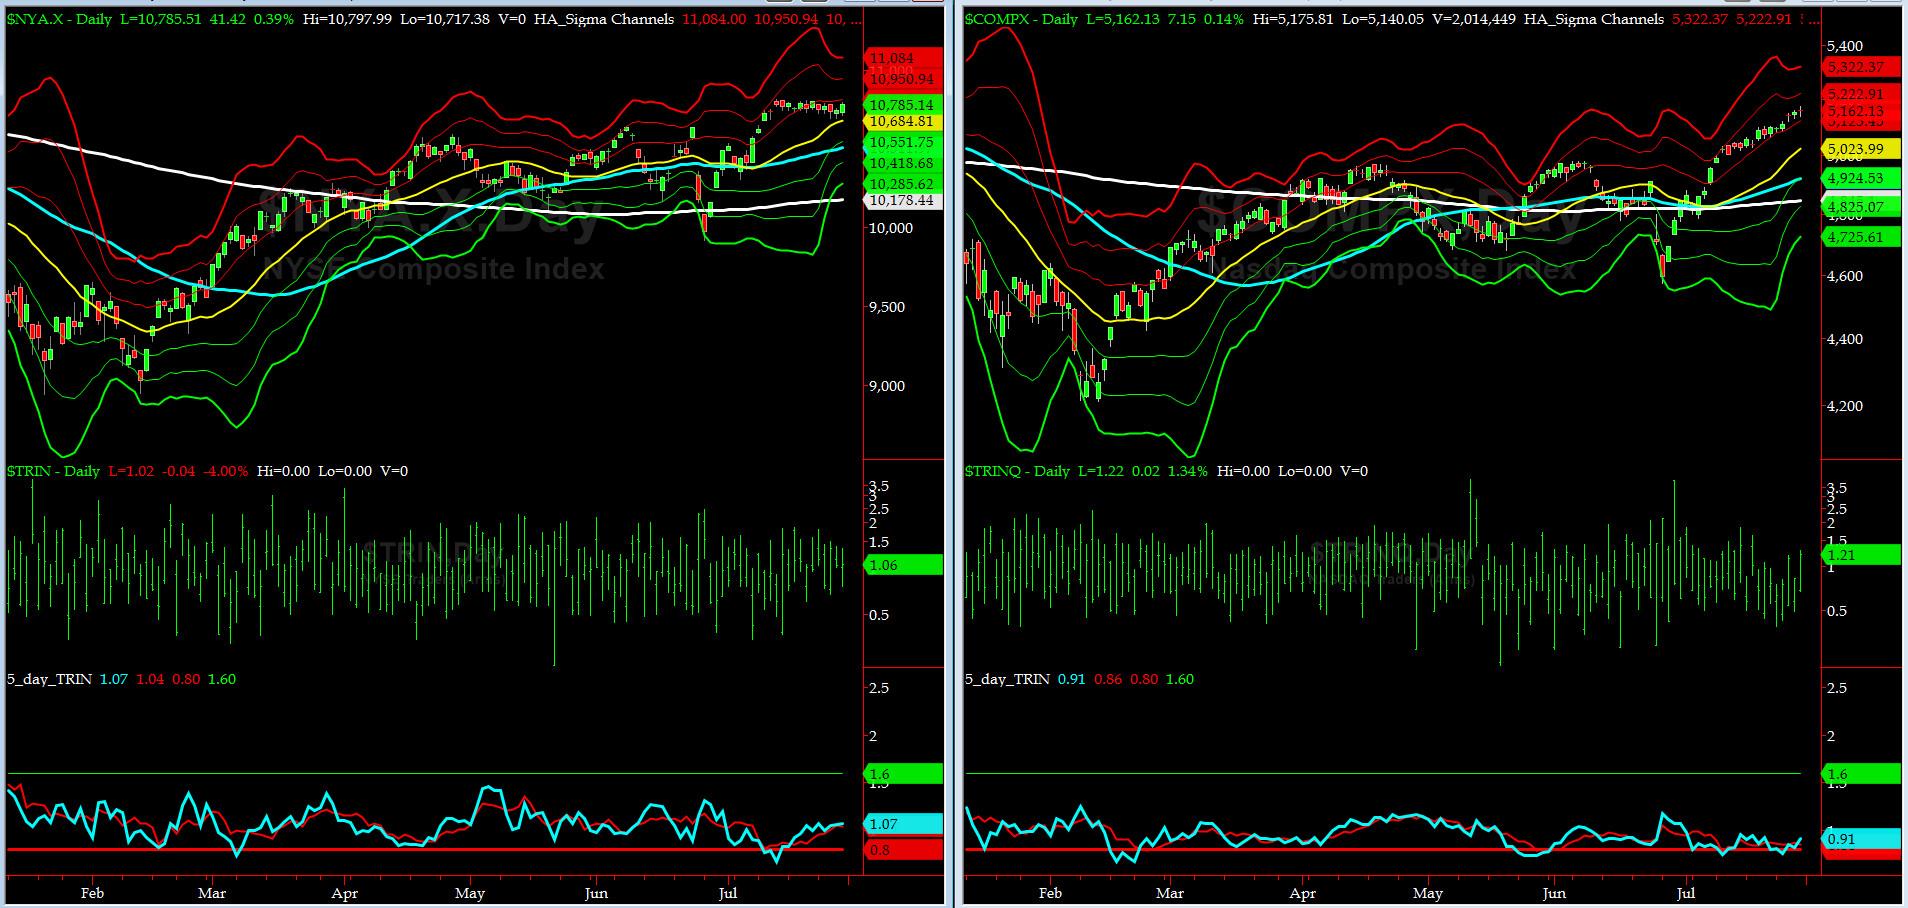
5-day TRIN & TRINQ Charts
BOTH charts are now in neutral reading zones........
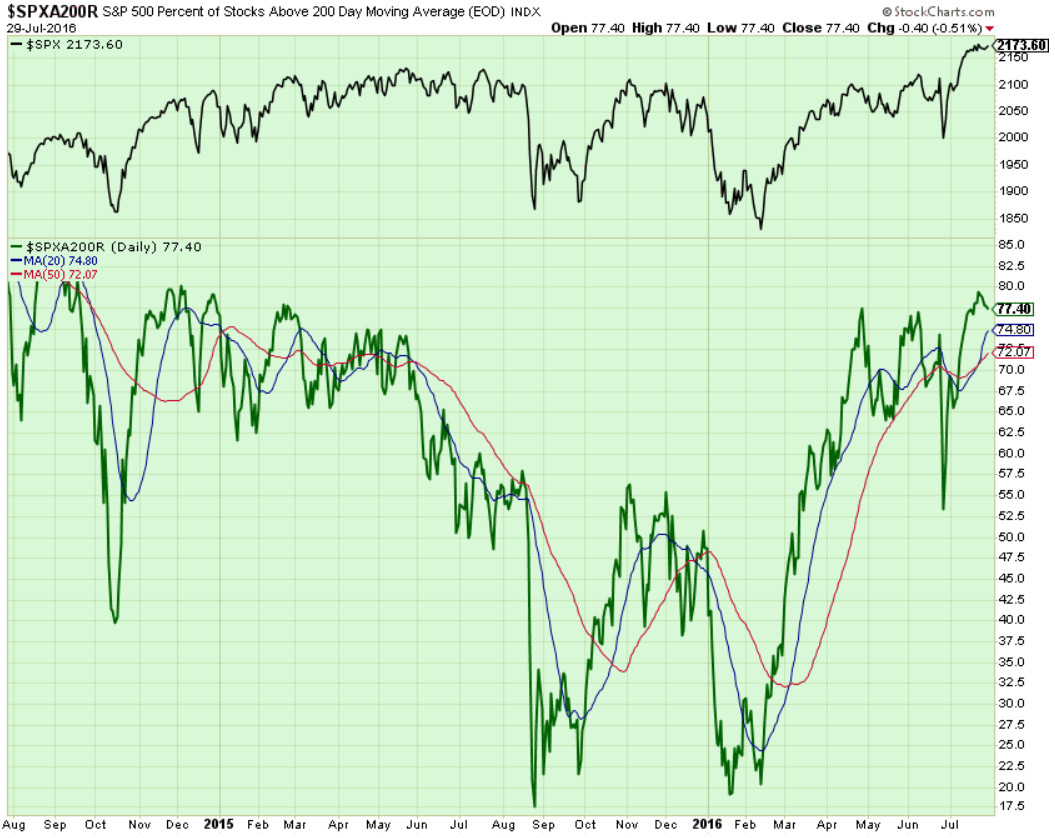
Components of SPX above their respective 200day MA Chart
This scoring indicator never made it past 80% and it is now at 77.4% and thus settign up another bearish divegence (work in progress for now).
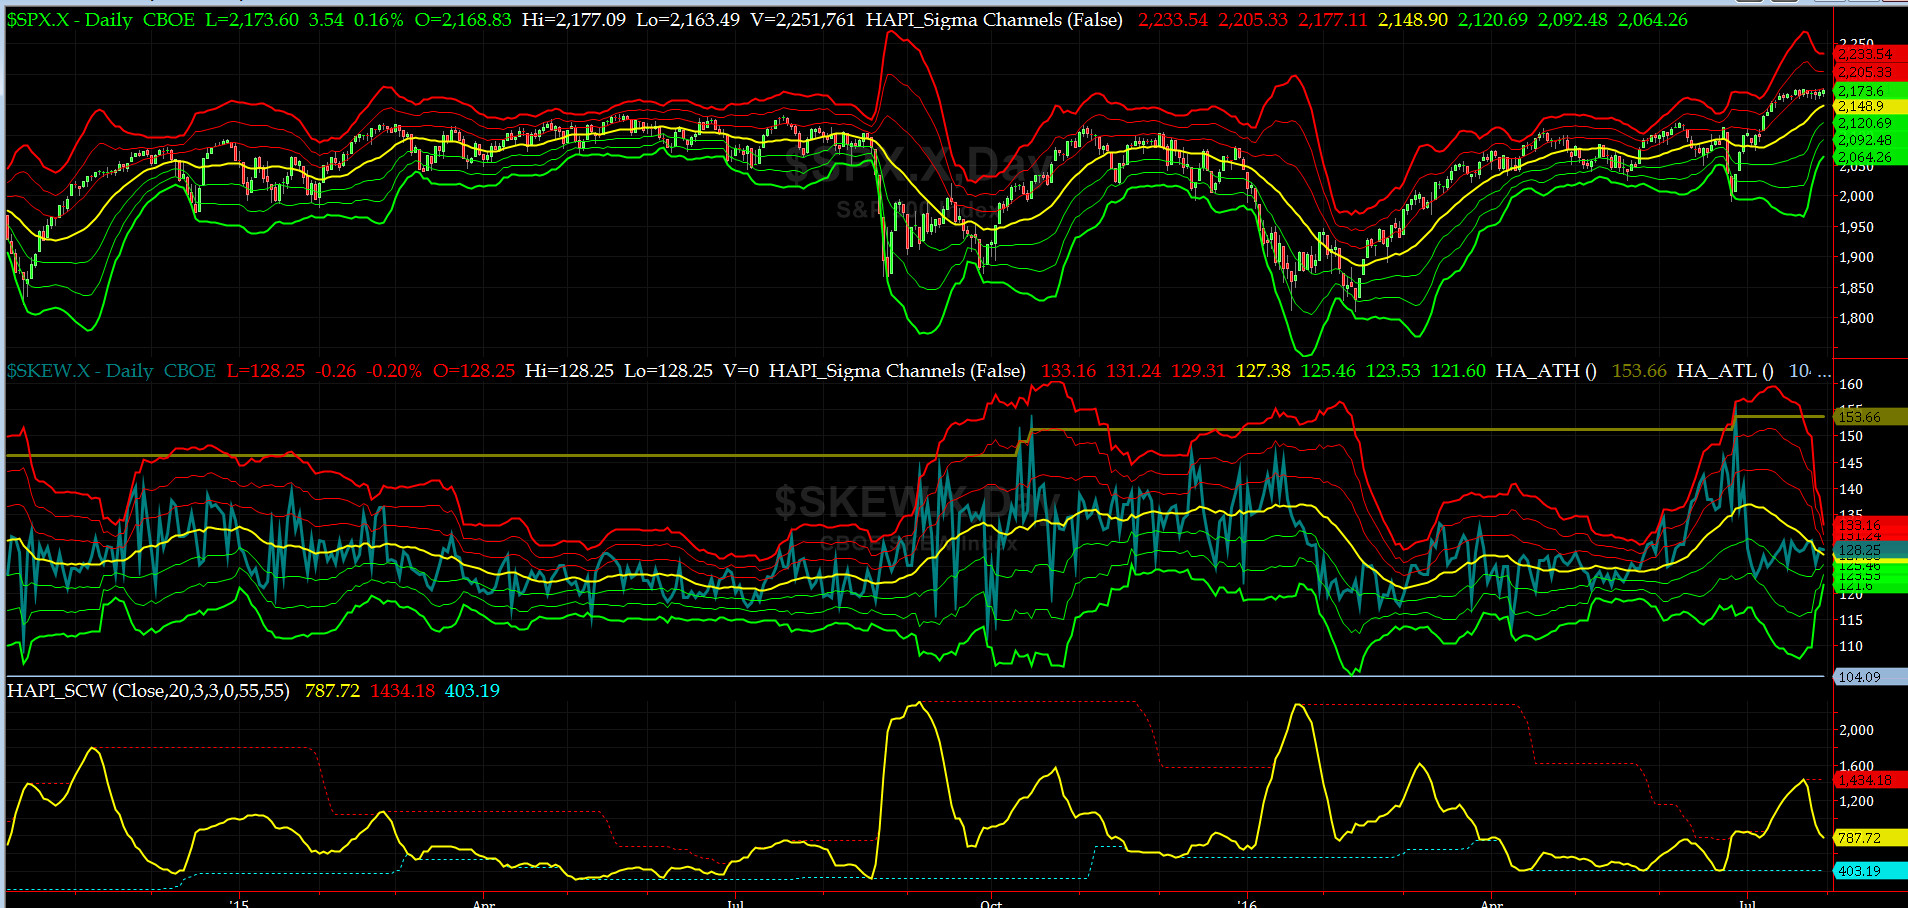
SPX SKEW (Tail Risk) Chart
SPX SKEW (Tail Risk) still flat-lined near 128 (its -1 sigma on July 6th right before June NFP) (normal = 120-125, range 100-150)
All Quiet on the Mid-Western Front? Smart Money contiues to think so.

3-month VIX Futures Spread(VX) Chart
Our 3-month VIX Futures Spread (LONG AUG16 & SHORT NOV16) closed at -4.4 on Friday. This is most extreme reading we have seen in several years of watching this vol spread.
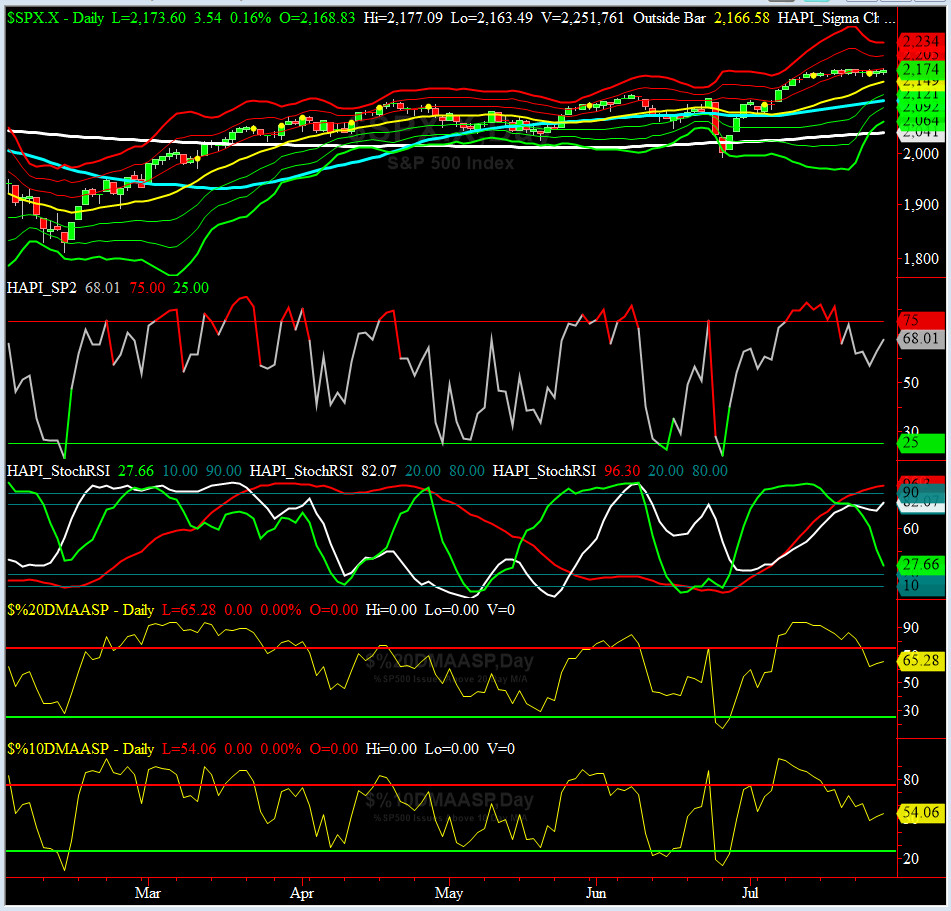
HA_SP2 Chart
HA_SP2 = 68 (Buy signal <= 25, Sell Signal >= 75)
This indicator says we are gong up to near OverBought territory again.
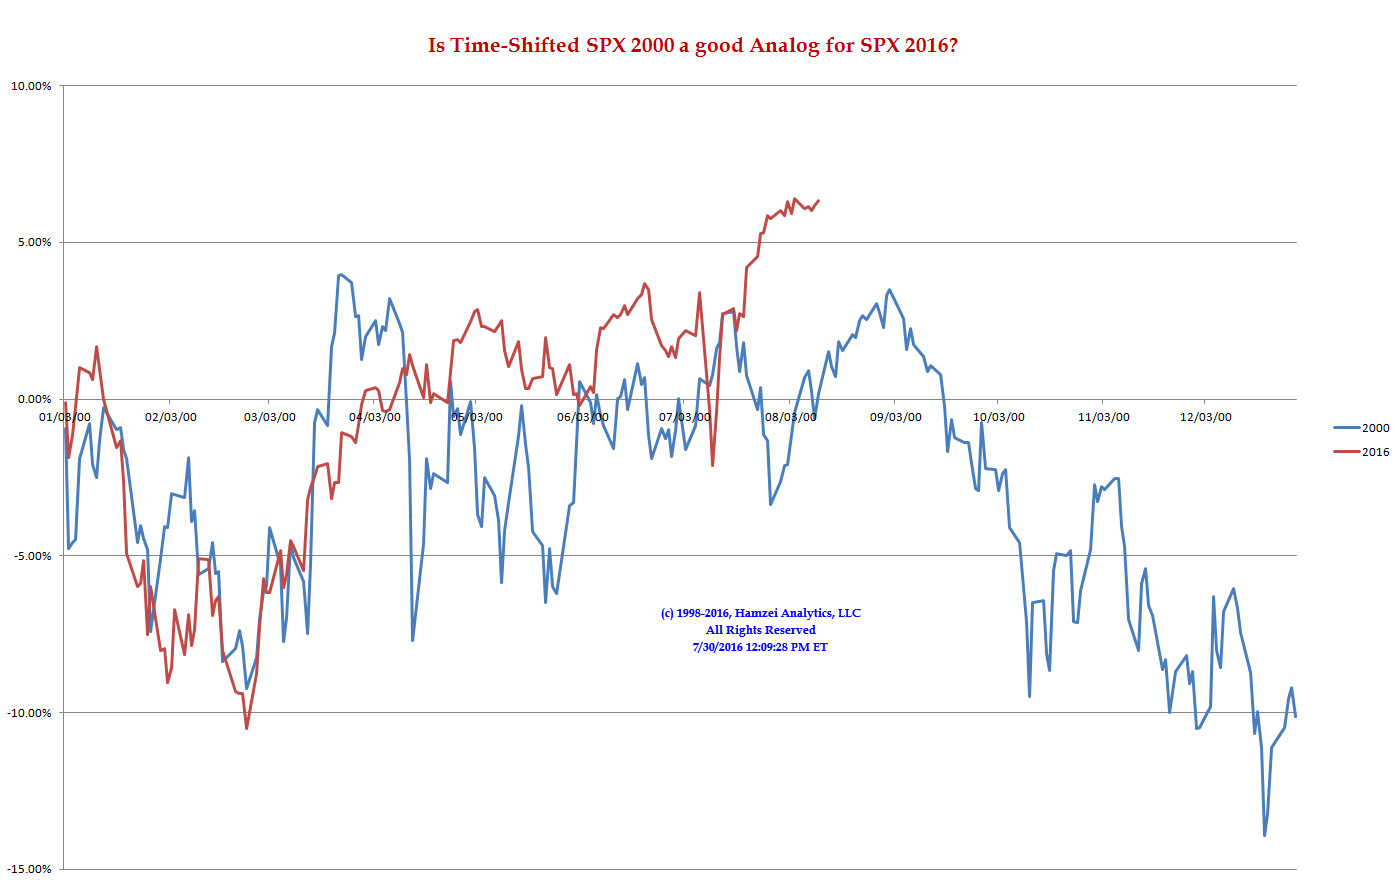
SPX 2000 Analog for SPX 2016
Is this the Clinton or the Trump Rally?
All we know is that the divergences in analog charts never end well.........
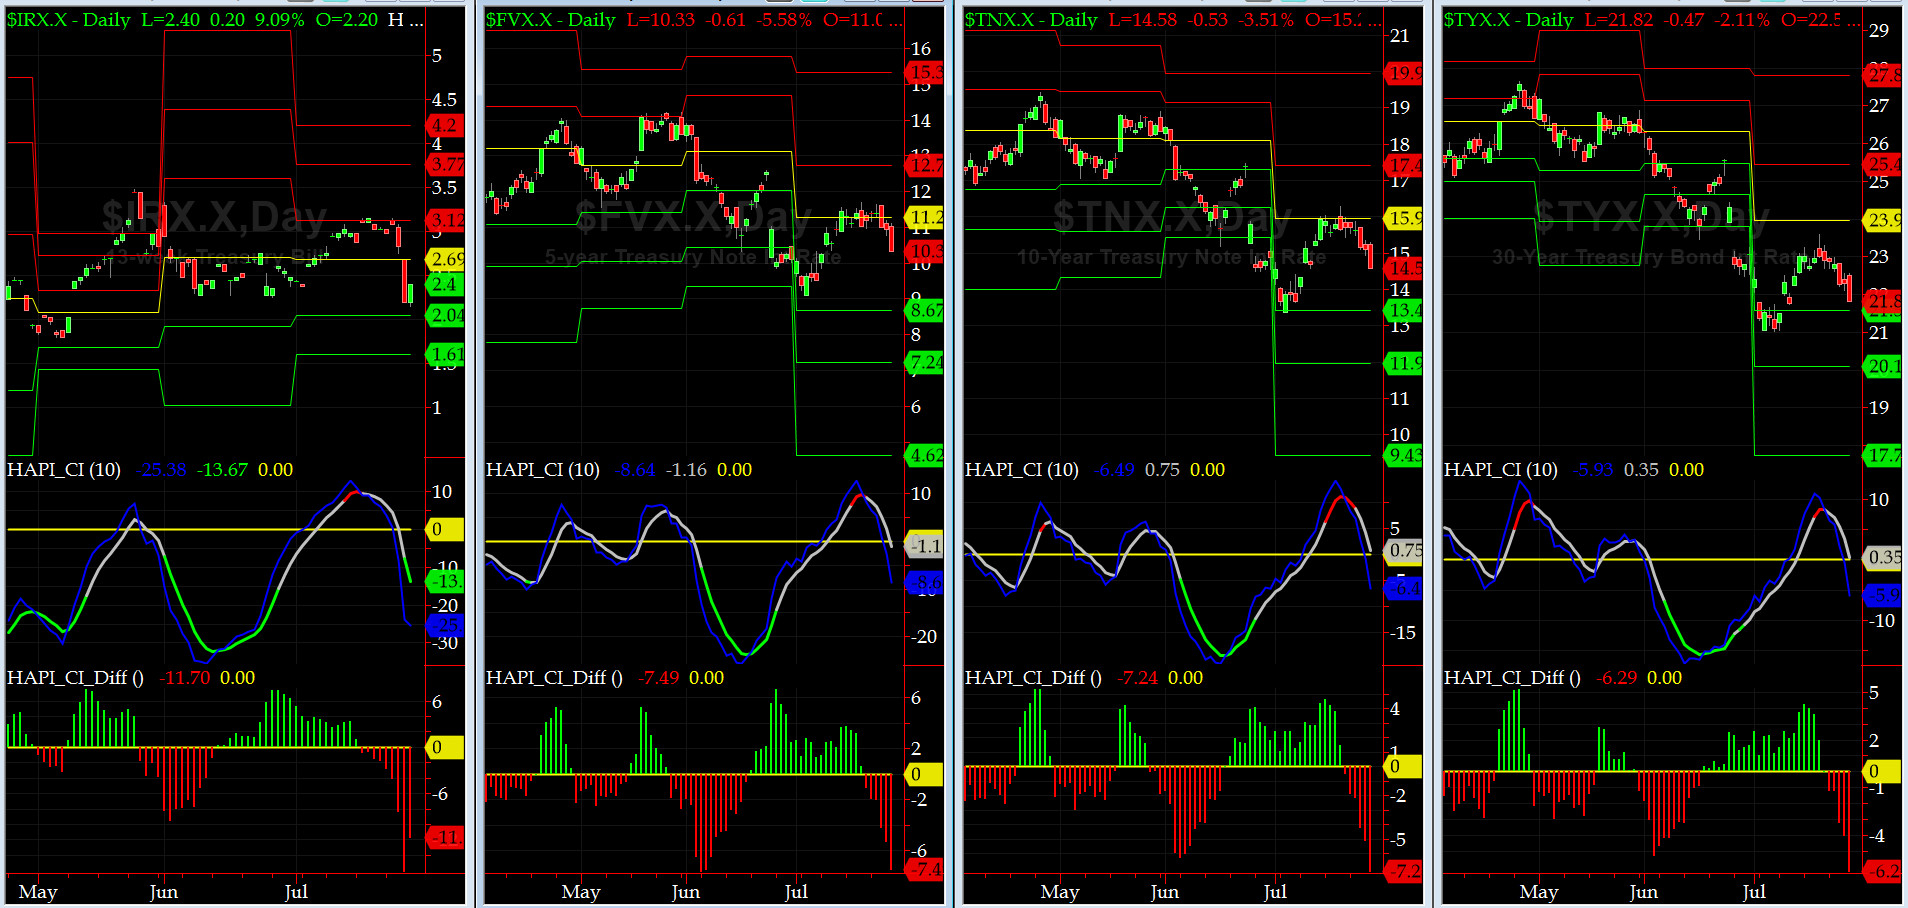
US Treasury T-Notes & T-Bonds Yields Chart
This past week, the US Treasury Complex saw three days of rally in bonds prices and drop in rates.
Fari Hamzei
|


 Proactive Market Timing