|
Saturday, August 20, 2016, 1330ET
Market Timing Charts, Analysis & Commentary for Issue #155
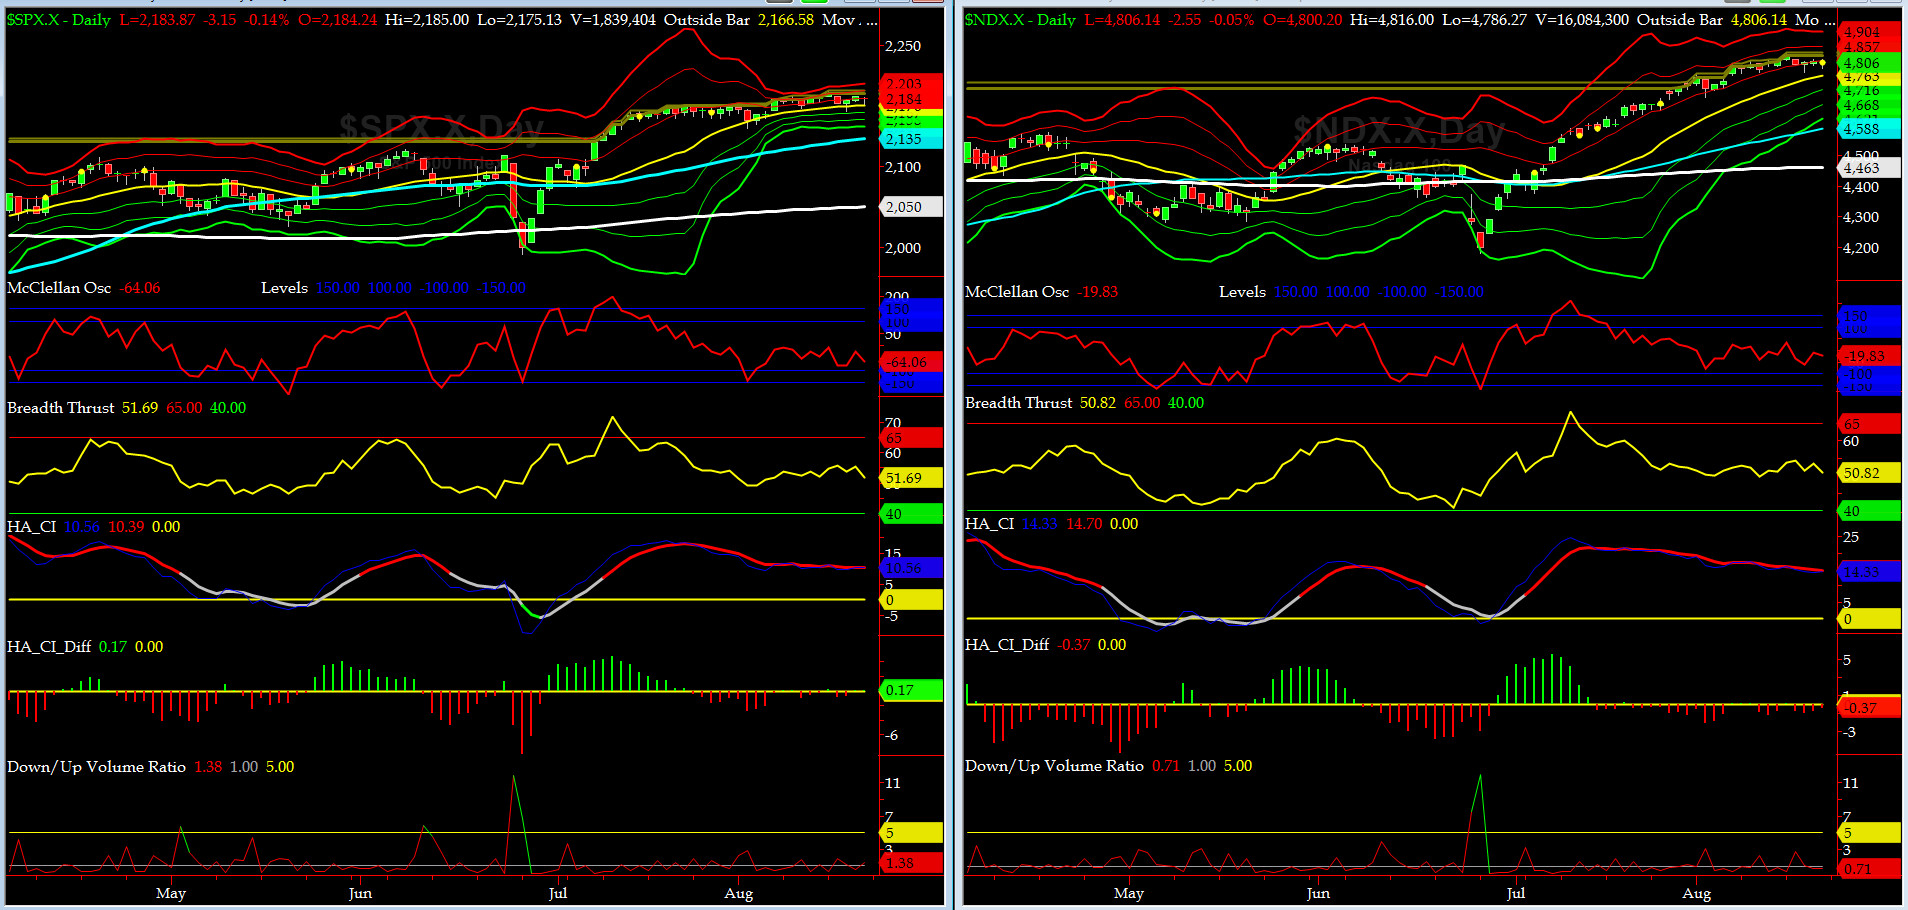
Timer Charts of S&P-500 Cash Index (SPX) + NASDAQ-100 Cash Index (NDX)
Most recent S&P-500 Cash Index (SPX): 2183.87 down -0.18 (down -0.0082%) for the week ending on Friday, August 19th, 2016, which closed near its +1 sigma.
SPX ALL TIME INTRADAY HIGH = 2193.81 (reached on Monday, August 15, 2016)
SPX ALL TIME CLOSING HIGH = 2190.15 (reached on Monday, August 15, 2016)
Current DAILY +2 Sigma SPX = 2194 with WEEKLY +2 Sigma = 2209
Current DAILY 0 Sigma (20 day MA) SPX = 2176 with WEEKLY 0 Sigma = 2107
Current DAILY -2 Sigma SPX = 2158 with WEEKLY -2 Sigma = 2005
NYSE McClellan Oscillator = -64 (-150 is start of the O/S area; around -275 to -300 area or lower, we go into the �launch-pad� mode, over +150, we are in O/B area)
NYSE Breadth Thrust = 51.7 (40 is considered as oversold and 65 as overbought)
On Monday SPX made new All-Time-Highs.... so all is well in the Mid-Western Front? 80% of US Equities Benchmark (SPX) thinks so. Do you?
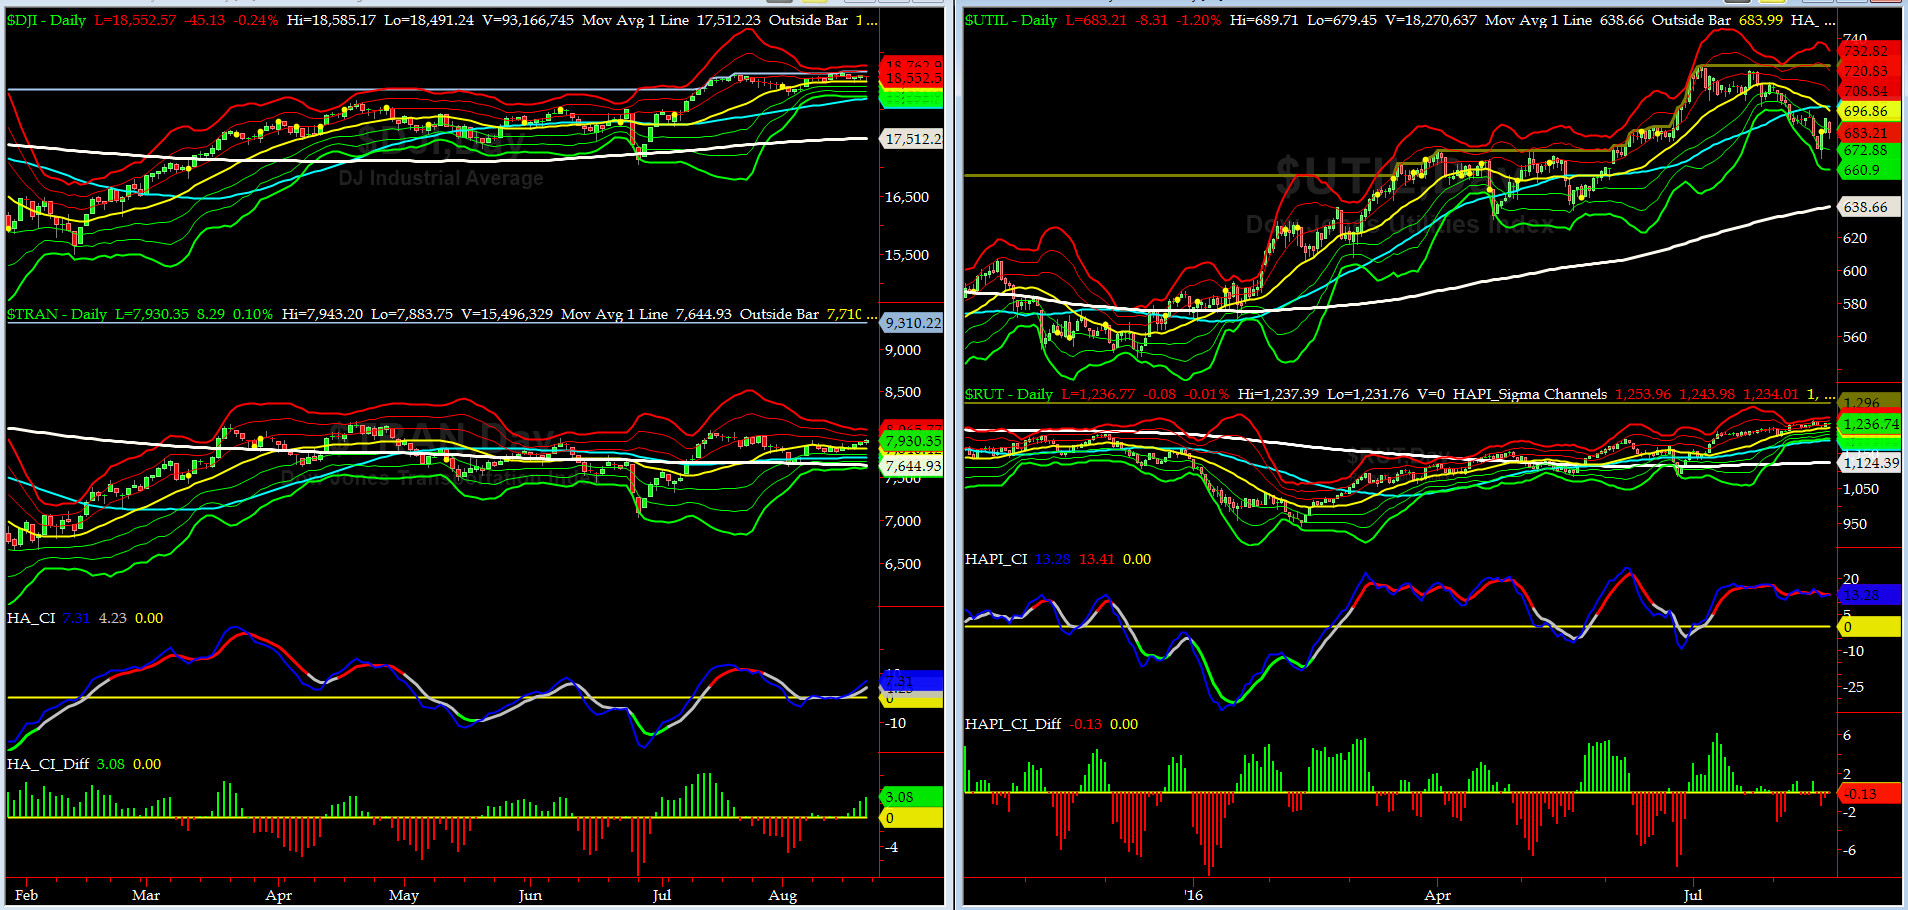
Canaries [in the Coal Mine] Chart for DJ TRAN & RUT Indices
200-Day MA DJ TRAN = 7644 or 3.7% below DJ TRAN (max observed in last 5 yrs = 20.2%, min = -20.3%)
200-Day MA RUT = 1124 or 10% below RUT (max observed in last 5 yrs = 21.3%, min = -22.6%)
DJ Transports (proxy for economic conditions 6 to 9 months hence) chart pattern is still in a divergence with SPX but at less pronounced.
Russell 2000 Small Caps (proxy for RISK ON/OFF) contiued to rise, albeit, only slightly at the margin. RISK-ON trade is back.
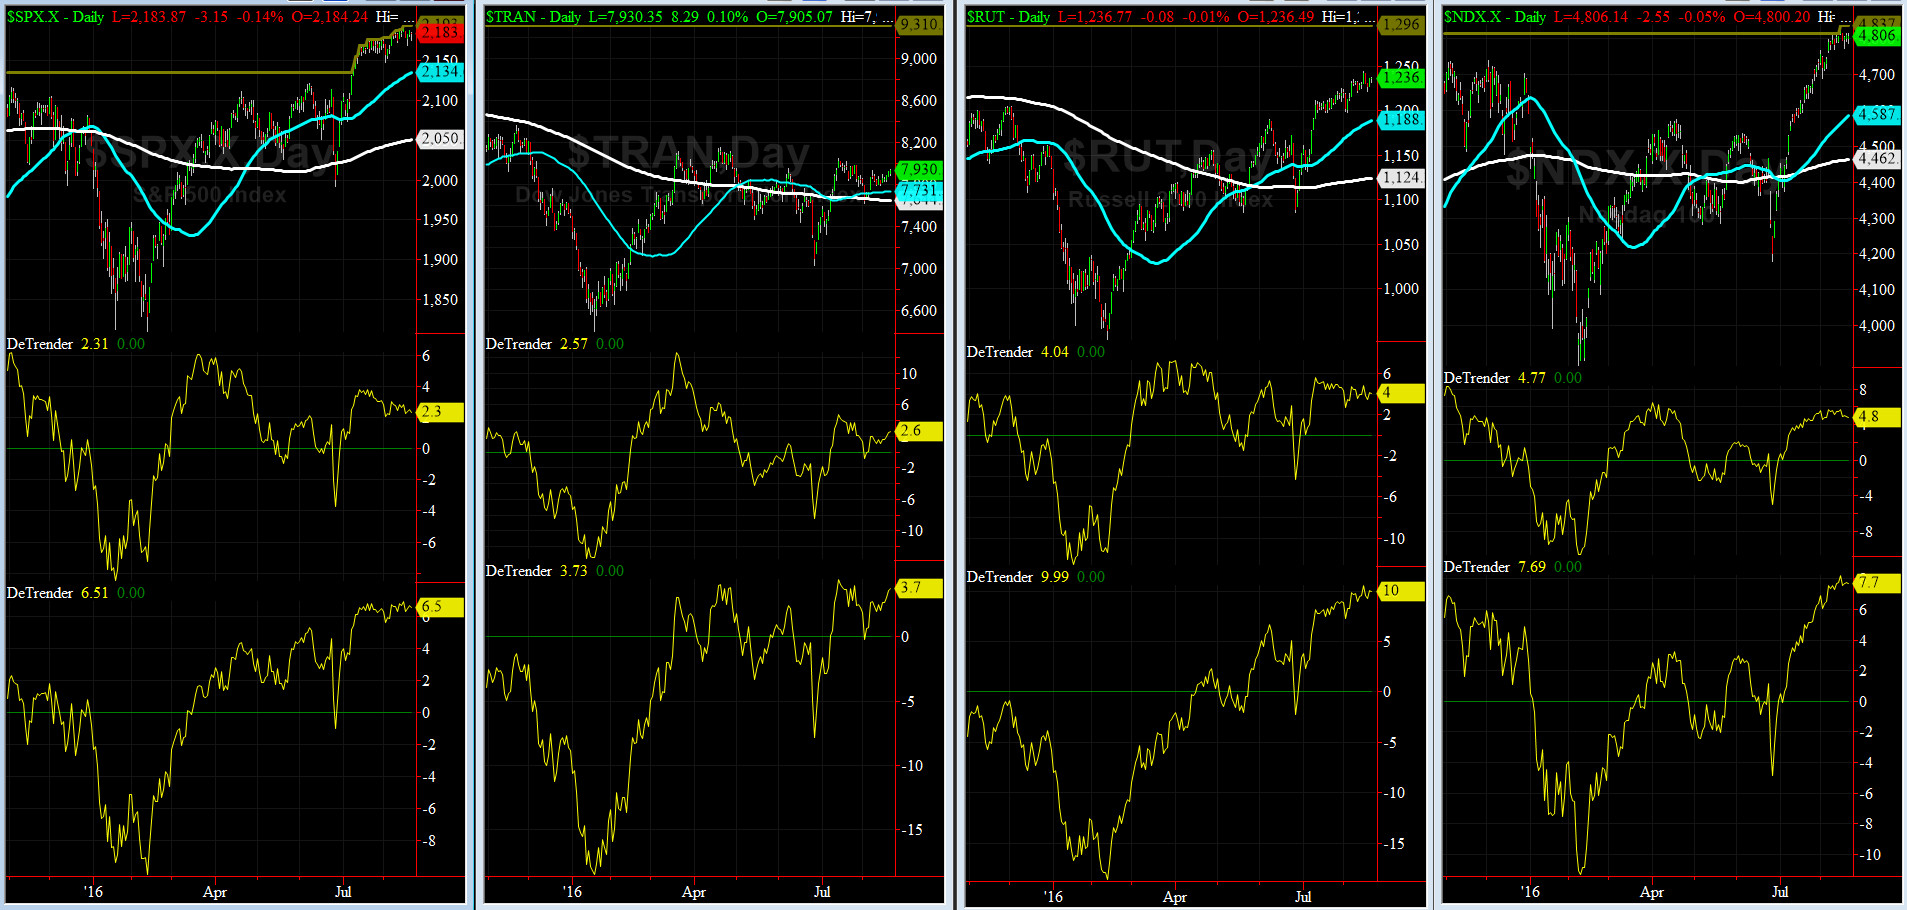
DeTrenders Charts for SPX, NDX, TRAN & RUT Indices
50-Day MA SPX = 2134 or 2.3% below SPX (max observed in last 5 yrs = +8.6%, min = -9.3%)
200-Day MA SPX = 2050 or 6.5% below SPX (max observed in last 5 yrs = 15.2%, min = -14%)
This week ALL of our Eight DeTrenders continue to stay POSITIVE. DeTrenders for TRAN & RUT continue to get our constant attention.
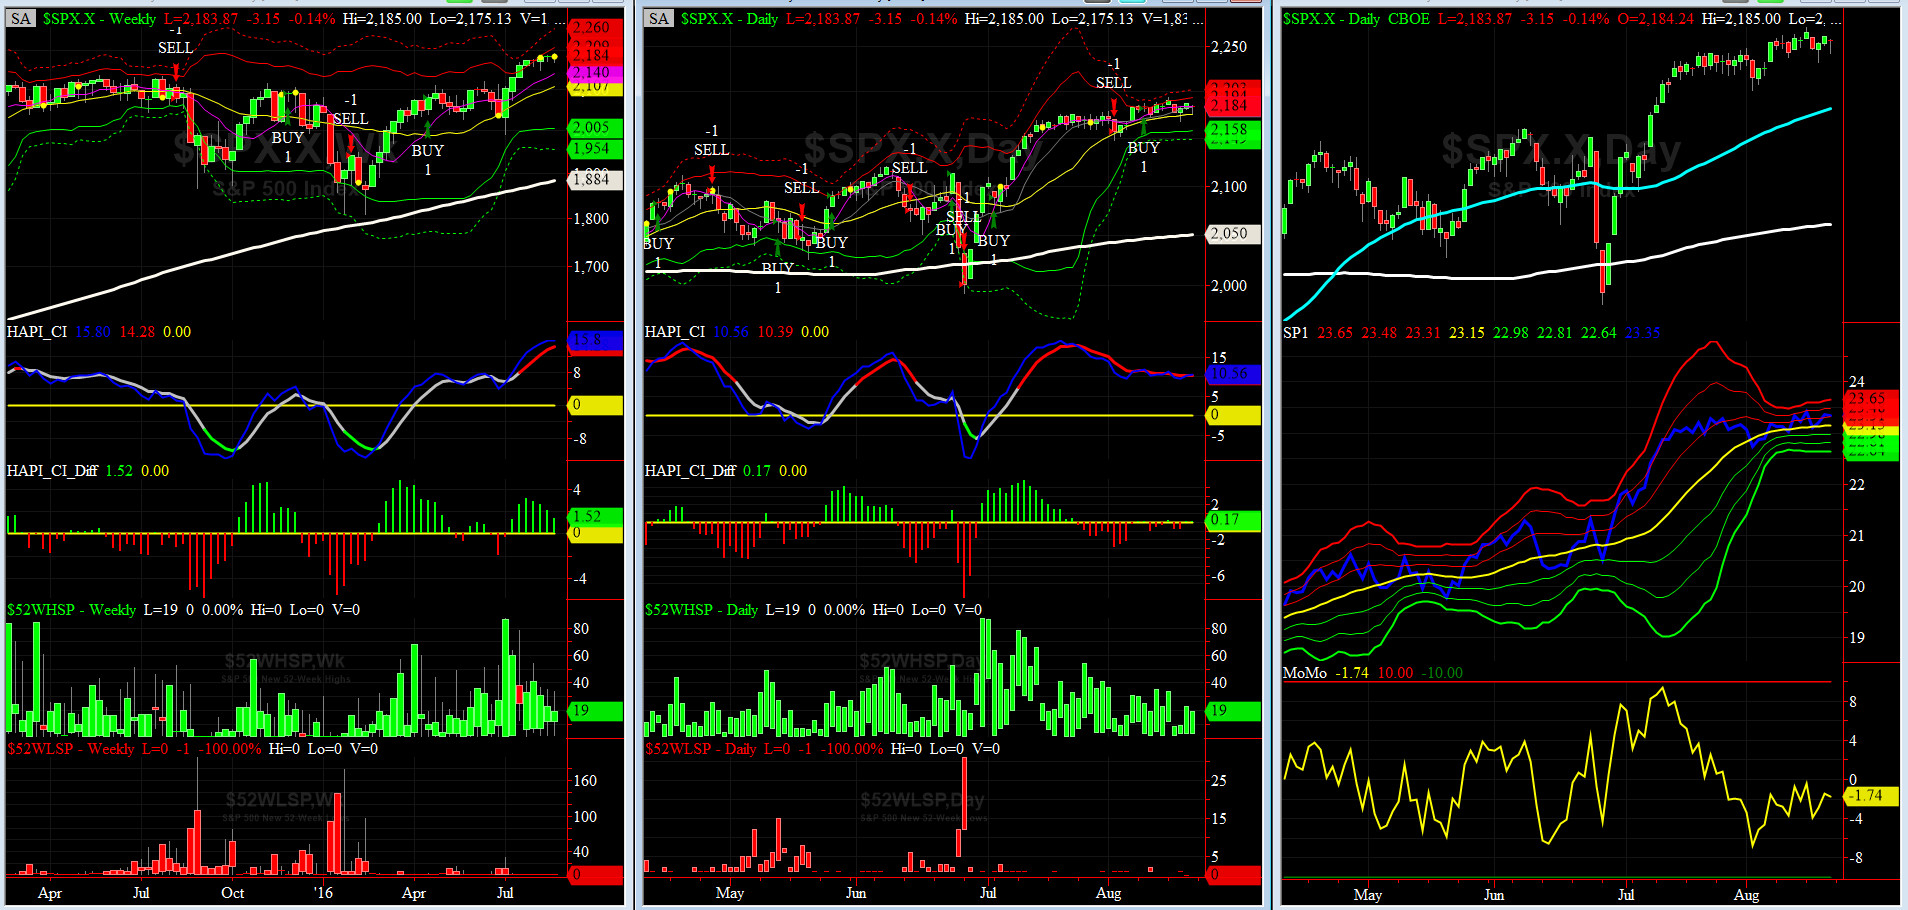
HA_SP1_Momo Chart
WEEKLY Timing Model = on a BUY Signal since Friday 4/15/16 CLOSE at 2081
DAILY Timing Model = on a BUY Signal since Tuesday 8/9/16 CLOSE at 2181
Max SPX 52wk-highs reading last week = 34 (over 120-140, the local maxima is in)
Max SPX 52wk-Lows reading last week = 1 (over 40-60, the local minima is in)
HA_SP1 = just above its +1 sigma channels
HA_Momo = -1.74 (reversals most likely occur above +10 or below -10)
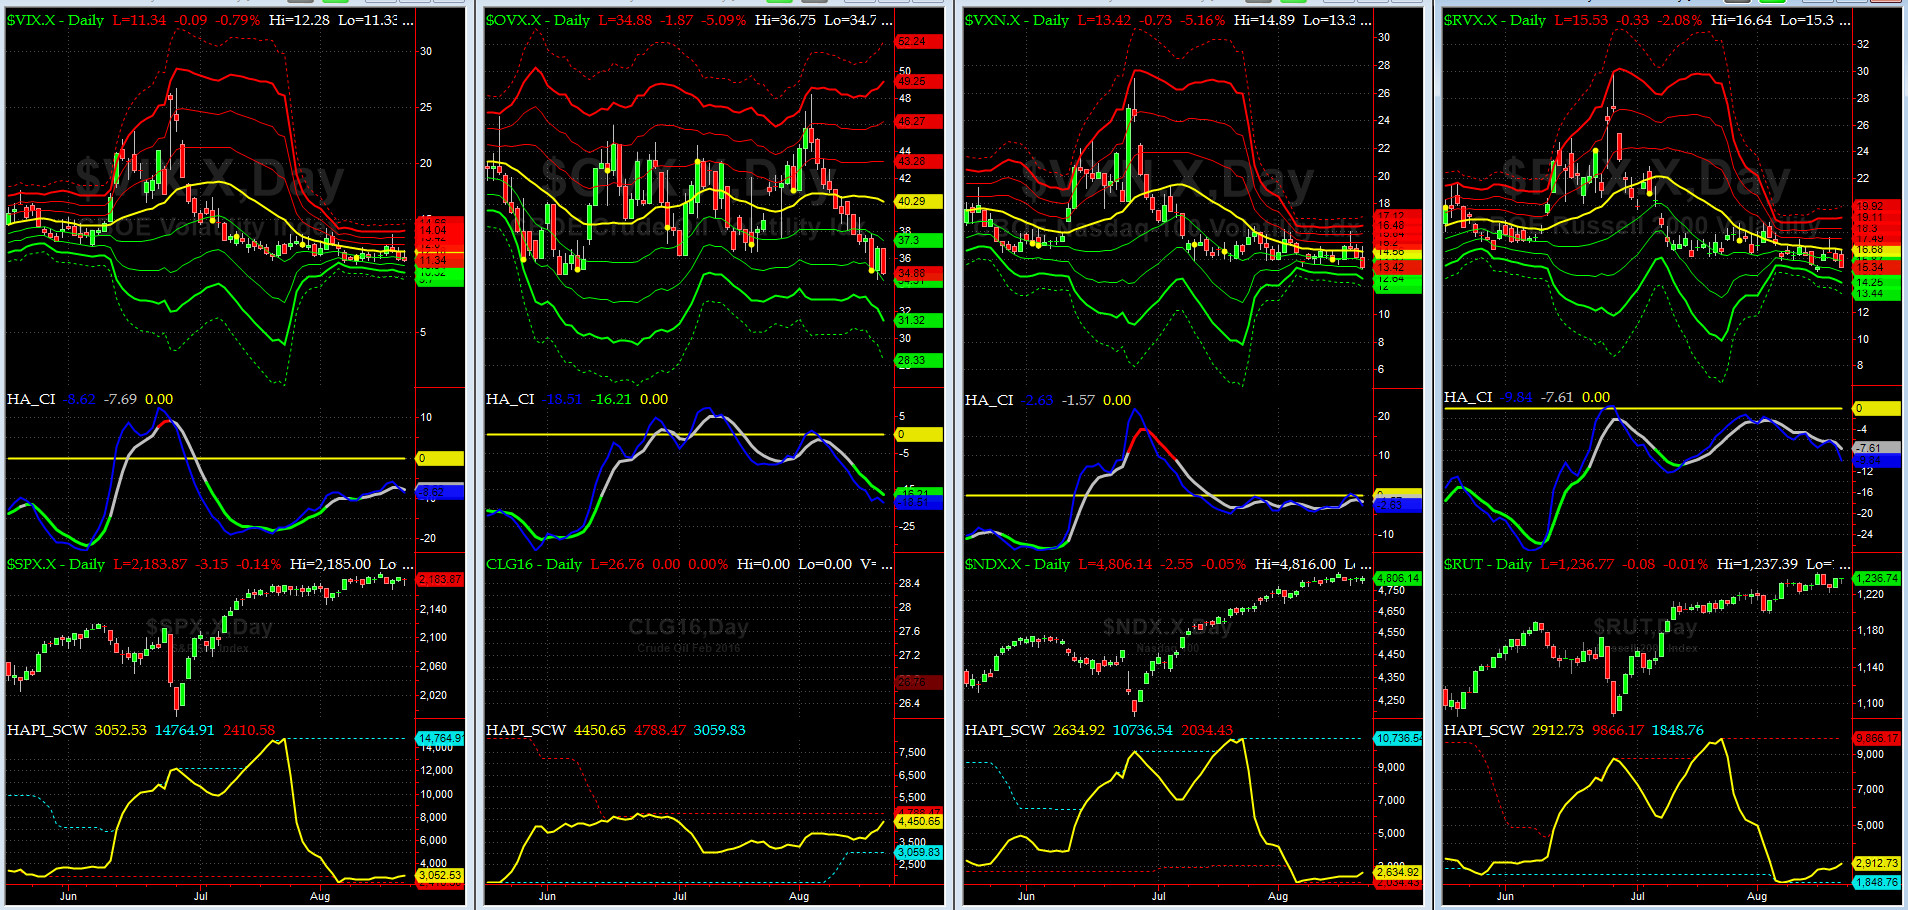
Vol of the Vols Chart
VIX = 11.34 is at its -1 sigma (remember it�s the VIX�s vol pattern (its sigma channels) that matters, and not the level of VIX itself (this is per Dr. Robert Whaley, a great mentor and the inventor of original VIX, now called VXO). VIX usually peaks around a test of its +4 sigma).
VIX had another quiet week. OVX (vol index for crude) continues to got crushed.
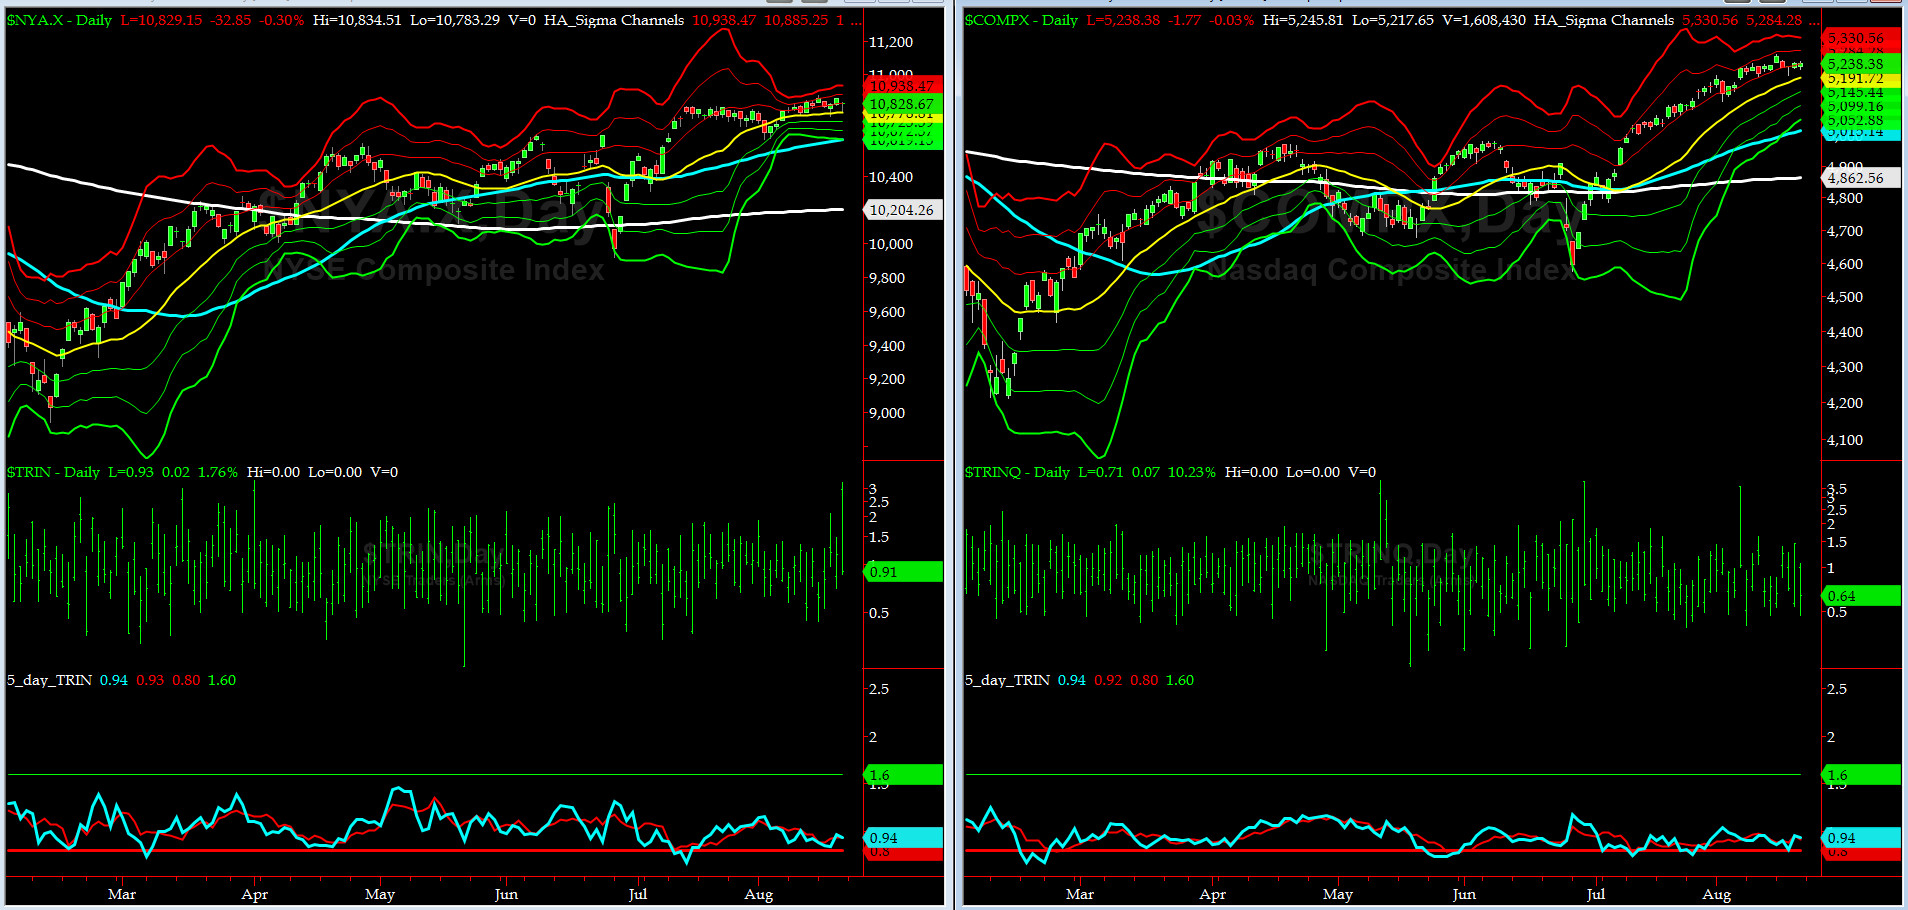
5-day TRIN & TRINQ Charts
Both charts are just a tad over SELL signal zones (0.80)........
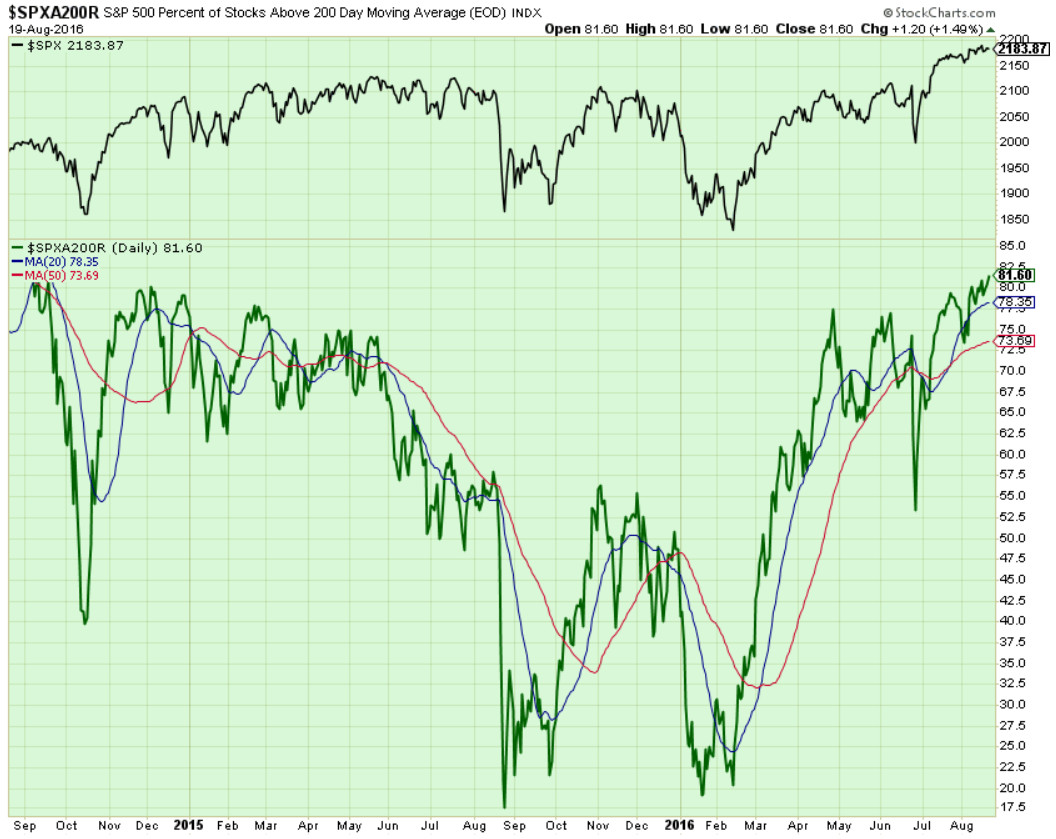
Components of SPX above their respective 200day MA Chart
This scoring indicator is at 81.6% now. All of its previous bearish divergences are history now.
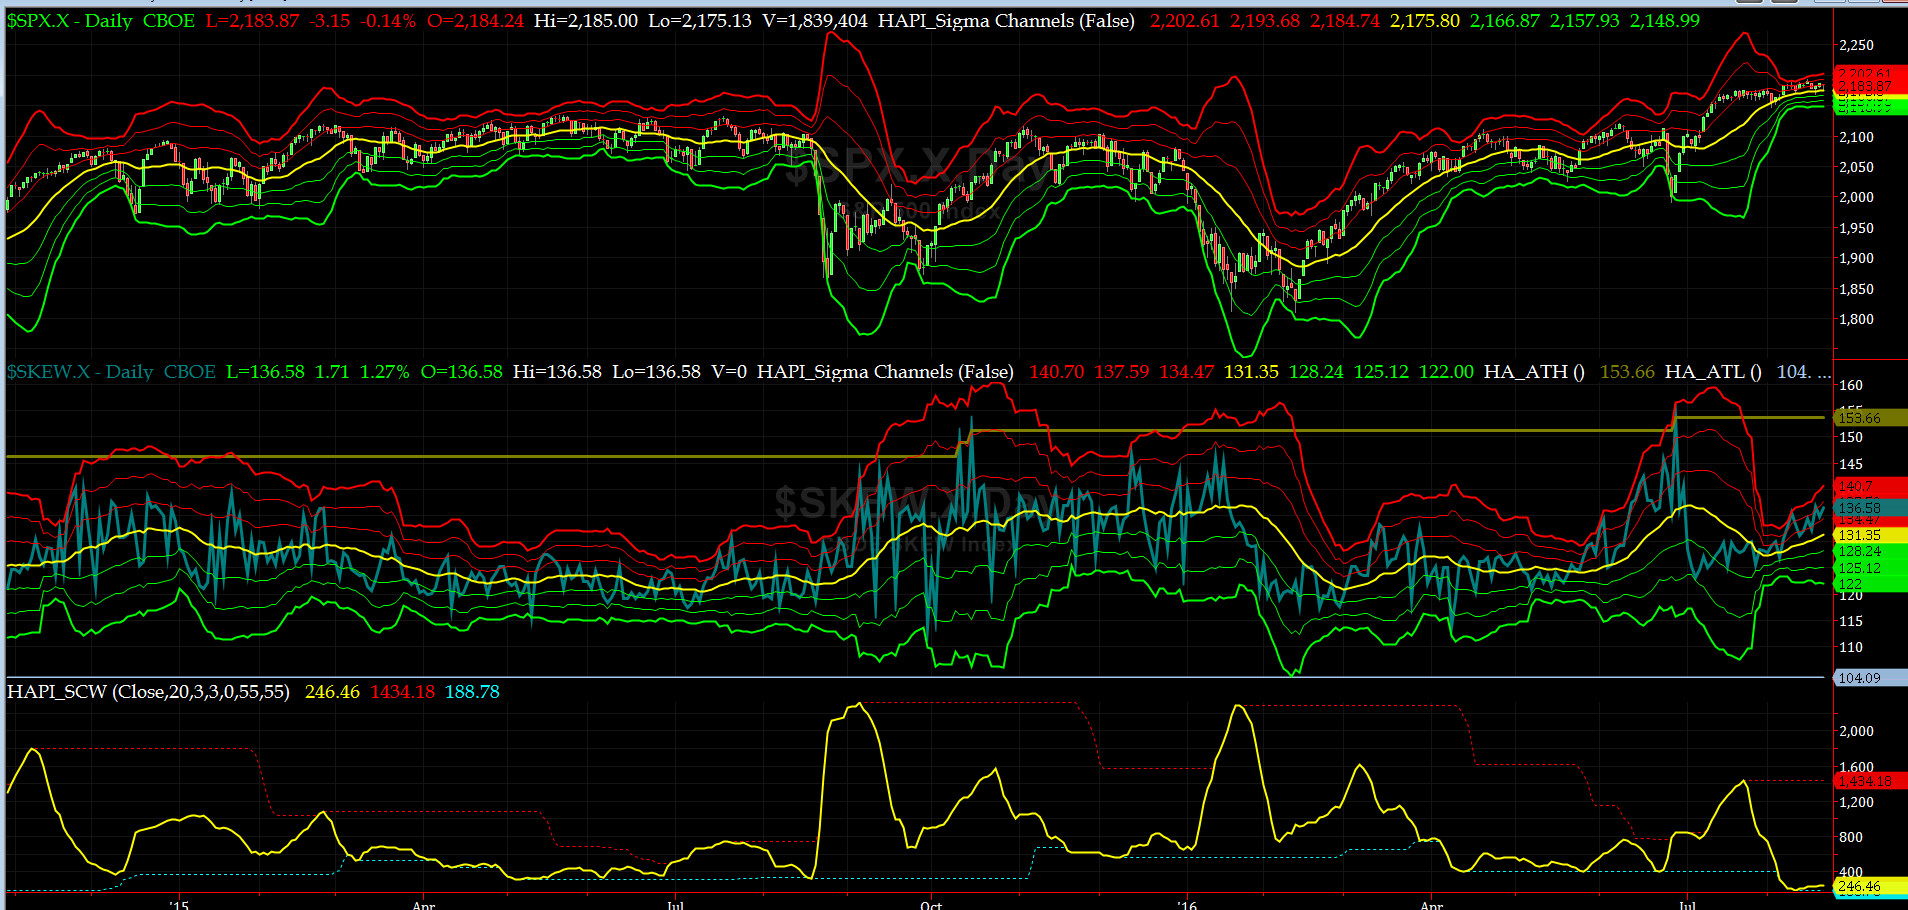
SPX SKEW (Tail Risk) Chart
SPX SKEW (Tail Risk) rose to 136.6 near its +1.5 sigma (normal = 120-125, range 100-150)
All Quiet on the Mid-Western Front? Smart Money is smelling trouble ahead (contested US General Election?)
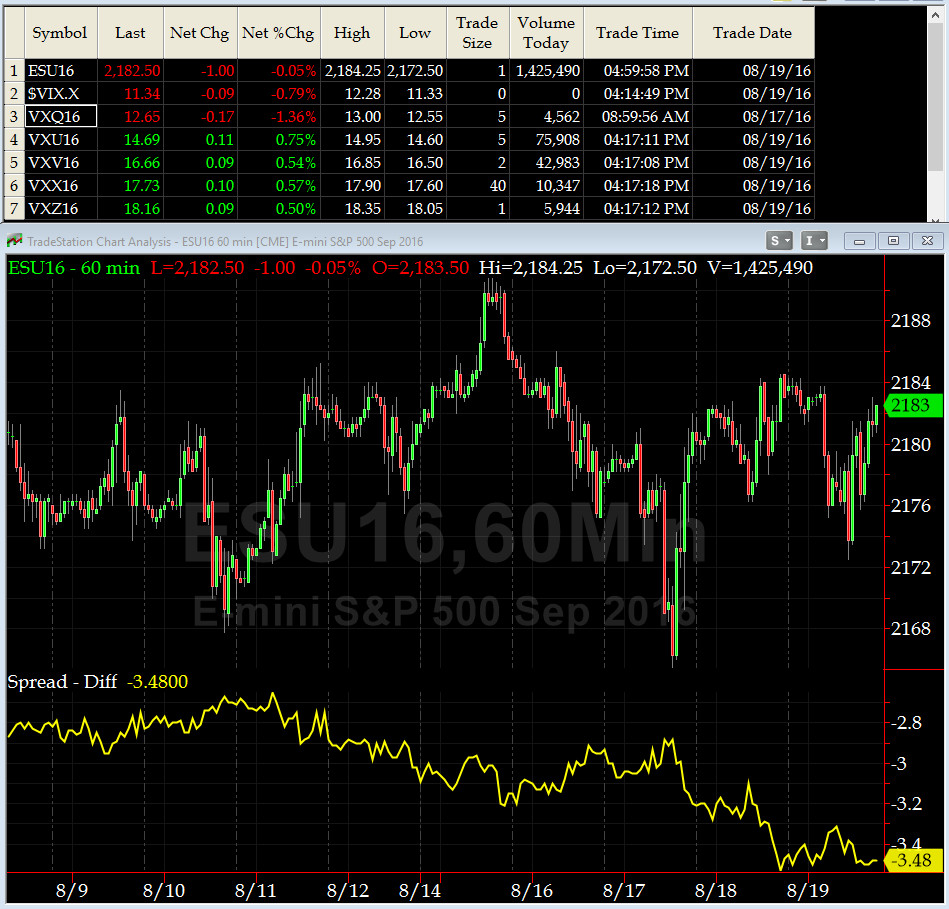
3-month VIX Futures Spread(VX) Chart
Our 3-month VIX Futures Spread (LONG SEPT16 & SHORT DEC16) closed at -3.48 on Friday. As you can tell, this indicator continues to signal that we are extremely overbought.

HA_SP2 Chart
HA_SP2 = 54 (Buy signal <= 25, Sell Signal >= 75)
This indicator continues to be in a big divergence with SPX.
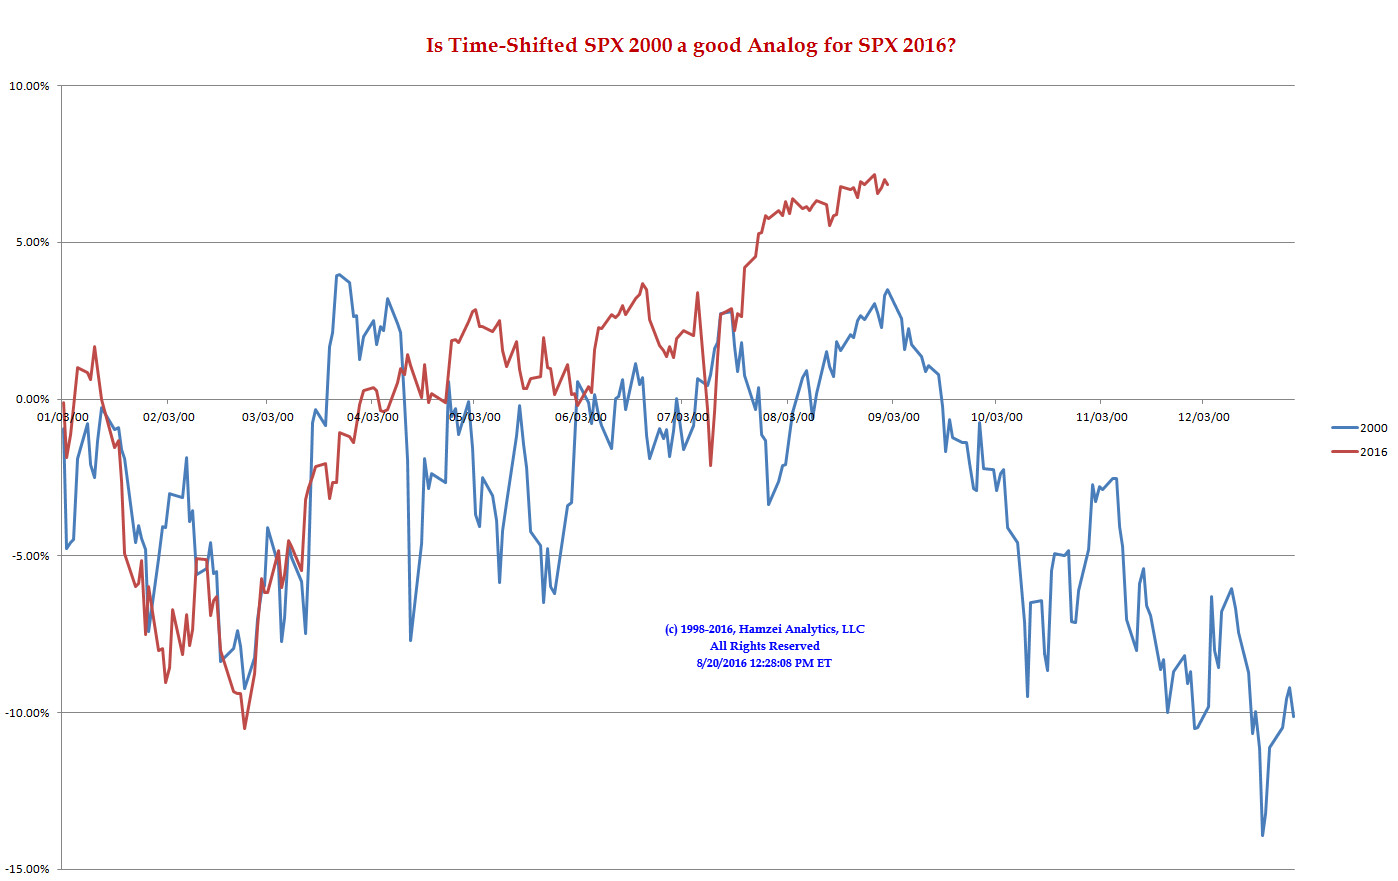
SPX 2000 Analog for SPX 2016
[If this chart is a good analog] then are we ready to Rock 'N' Roll [very soon]?
My XO, @Capt_Tiko, is.....Got Tuna?
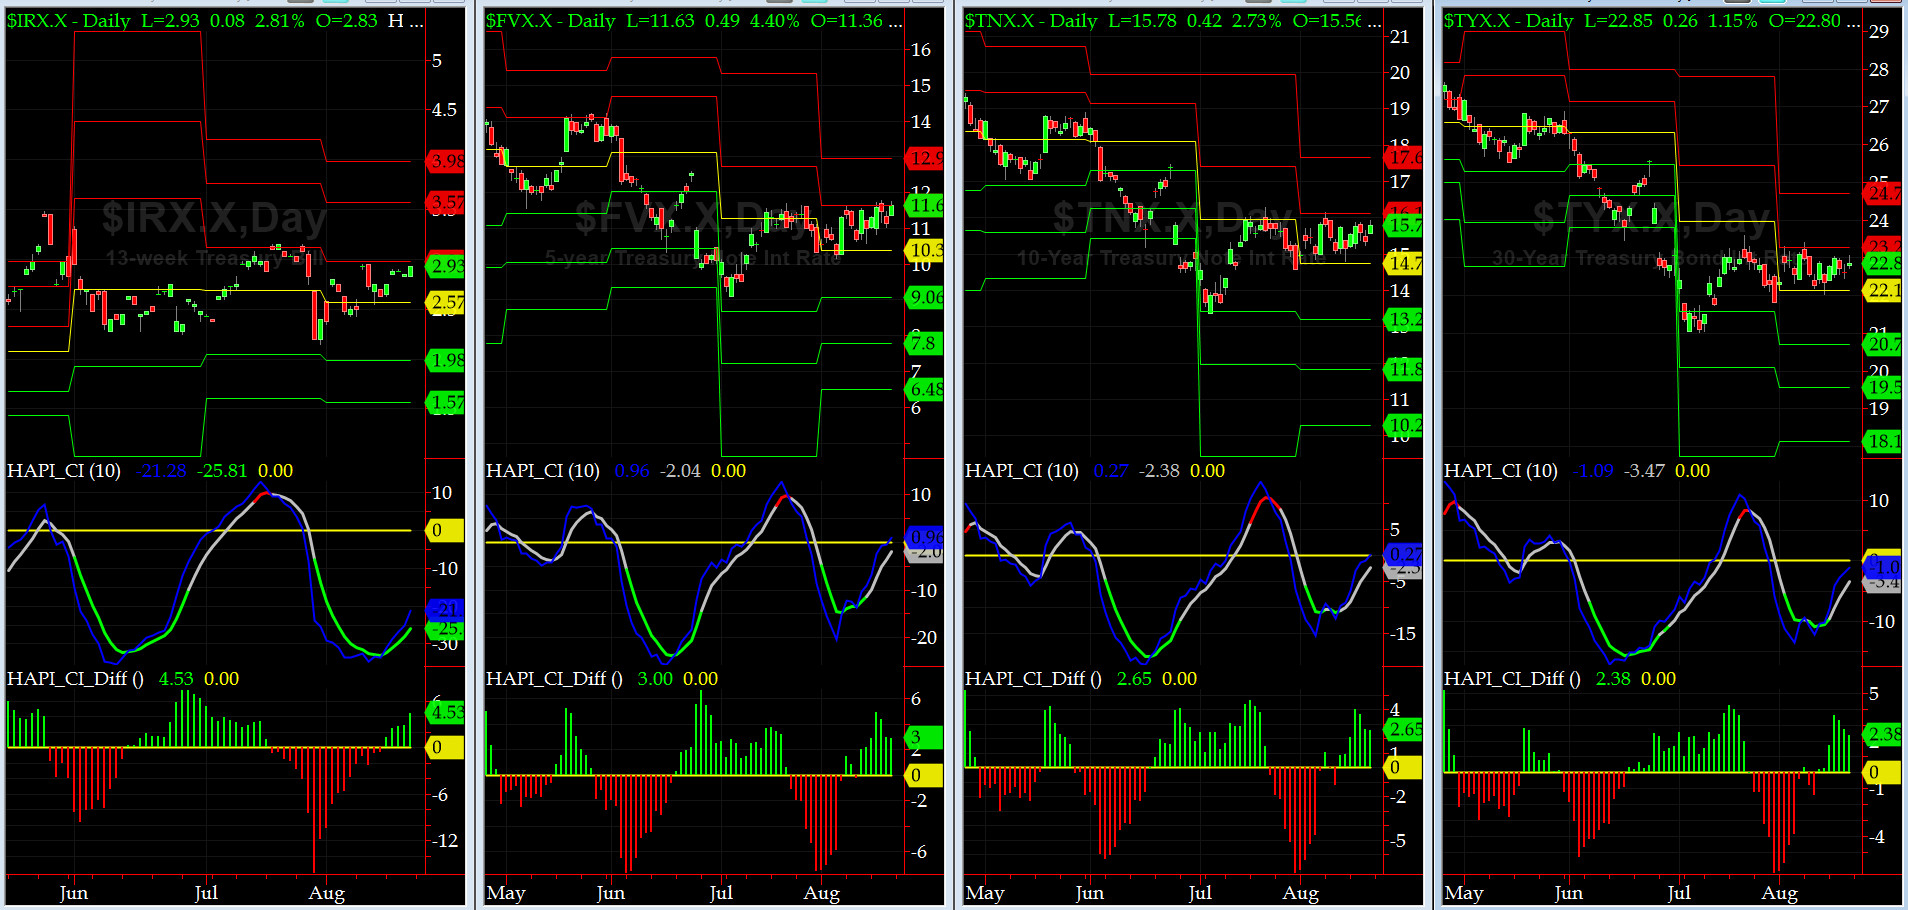
US Treasury T-Notes & T-Bonds Yields Chart
US Treasury Complex was very quiet last week and rose only slightly across the Yield Curve.
Fari Hamzei
|


 Proactive Market Timing


