|
Monday, September 19, 2016, 0830ET
Market Timing Charts, Analysis & Commentary for Issue #159
Timer Charts of S&P-500 Cash Index (SPX) + NASDAQ-100 Cash Index (NDX)
Most recent S&P-500 Cash Index (SPX): 2139.16 up +11.37 (up +0.5%) for the week ending on Friday, September 16th, 2016, which closed below its -1 sigma.
SPX ALL TIME INTRADAY HIGH = 2193.81 (reached on Monday, August 15, 2016)
SPX ALL TIME CLOSING HIGH = 2190.15 (reached on Monday, August 15, 2016)
Current DAILY +2 Sigma SPX = 2208 with WEEKLY +2 Sigma = 2224
Current DAILY 0 Sigma (20 day MA) SPX = 2166 with WEEKLY 0 Sigma = 2120
Current DAILY -2 Sigma SPX = 2125 with WEEKLY -2 Sigma = 2023
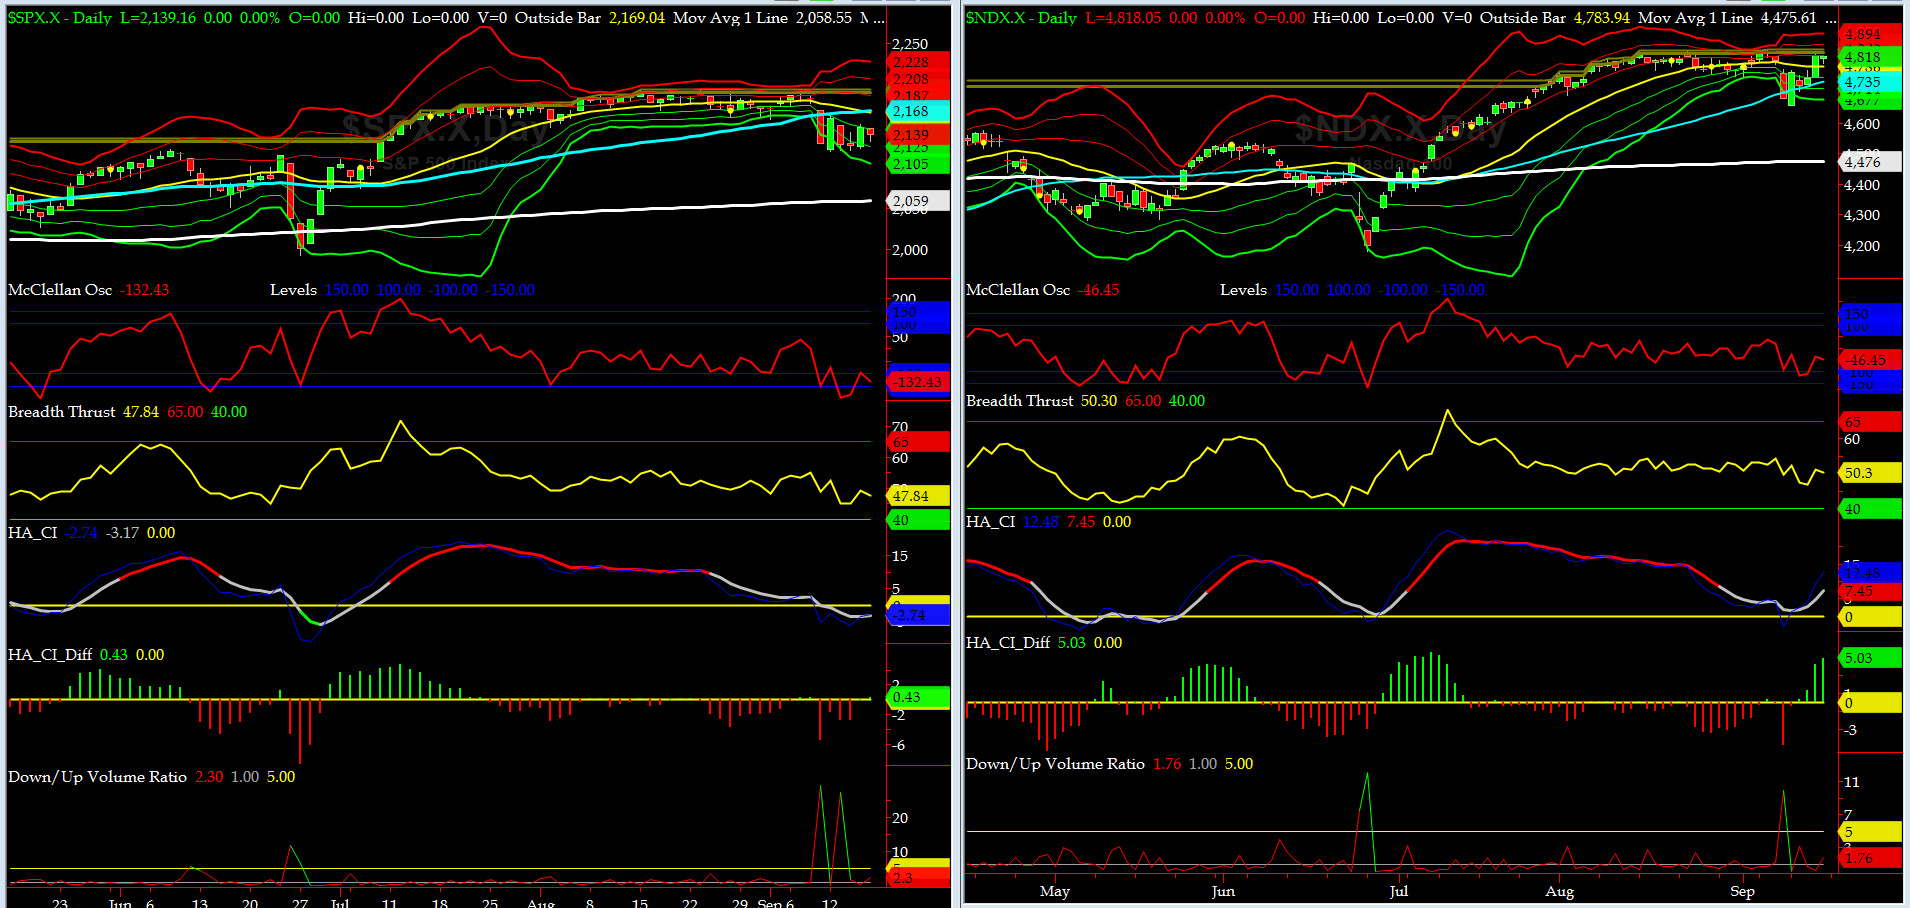
NYSE McClellan Oscillator = -132 (-150 is start of the O/S area; around -275 to -300 area or lower, we go into the �launch-pad� mode, over +150, we are in O/B area)
NYSE Breadth Thrust = 48 (40 is considered as oversold and 65 as overbought)
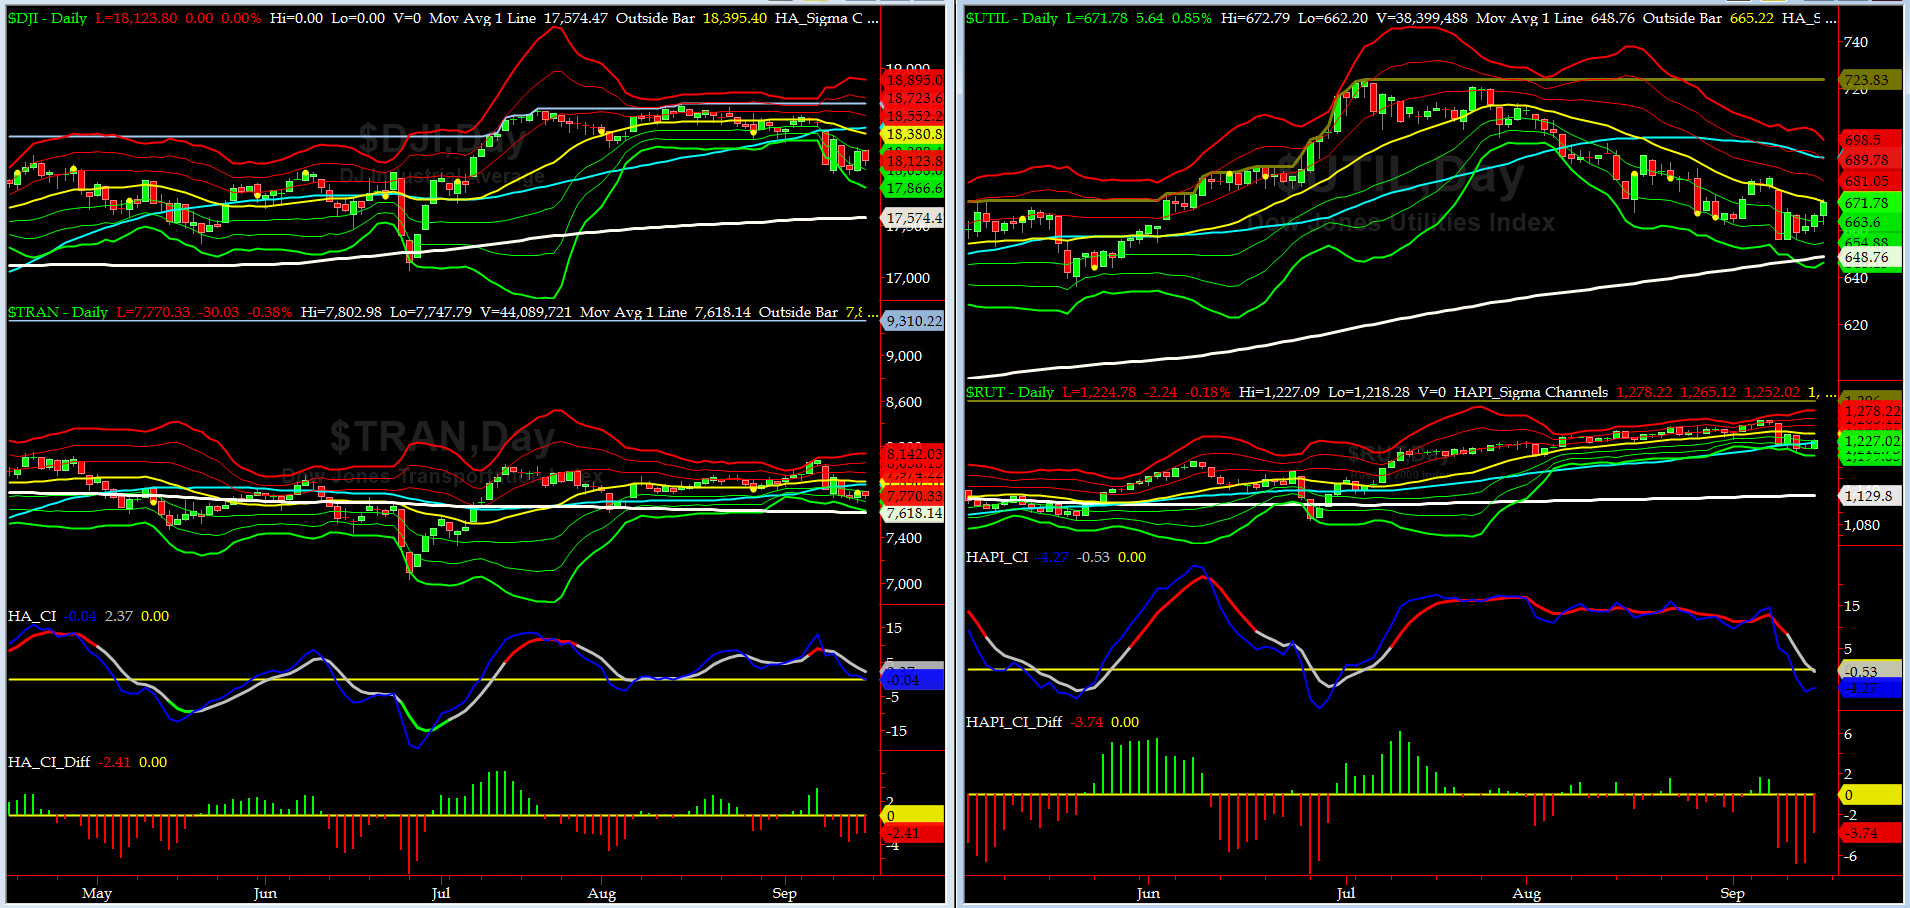
Canaries [in the Coal Mine] Chart for DJ TRAN & RUT Indices
200-Day MA DJ TRAN = 7618 or 2% below DJ TRAN (max observed in last 5 yrs = 20.2%, min = -20.3%)
200-Day MA RUT = 1129 or 8.4% below RUT (max observed in last 5 yrs = 21.3%, min = -22.6%)
DJ Transports (proxy for economic conditions 6 to 9 months hence) once SPX drop subsided, stayed in a very tight range in the last three trading days.
Russell 2000 Small Caps (proxy for RISK ON/OFF) had a very tumultuous week!
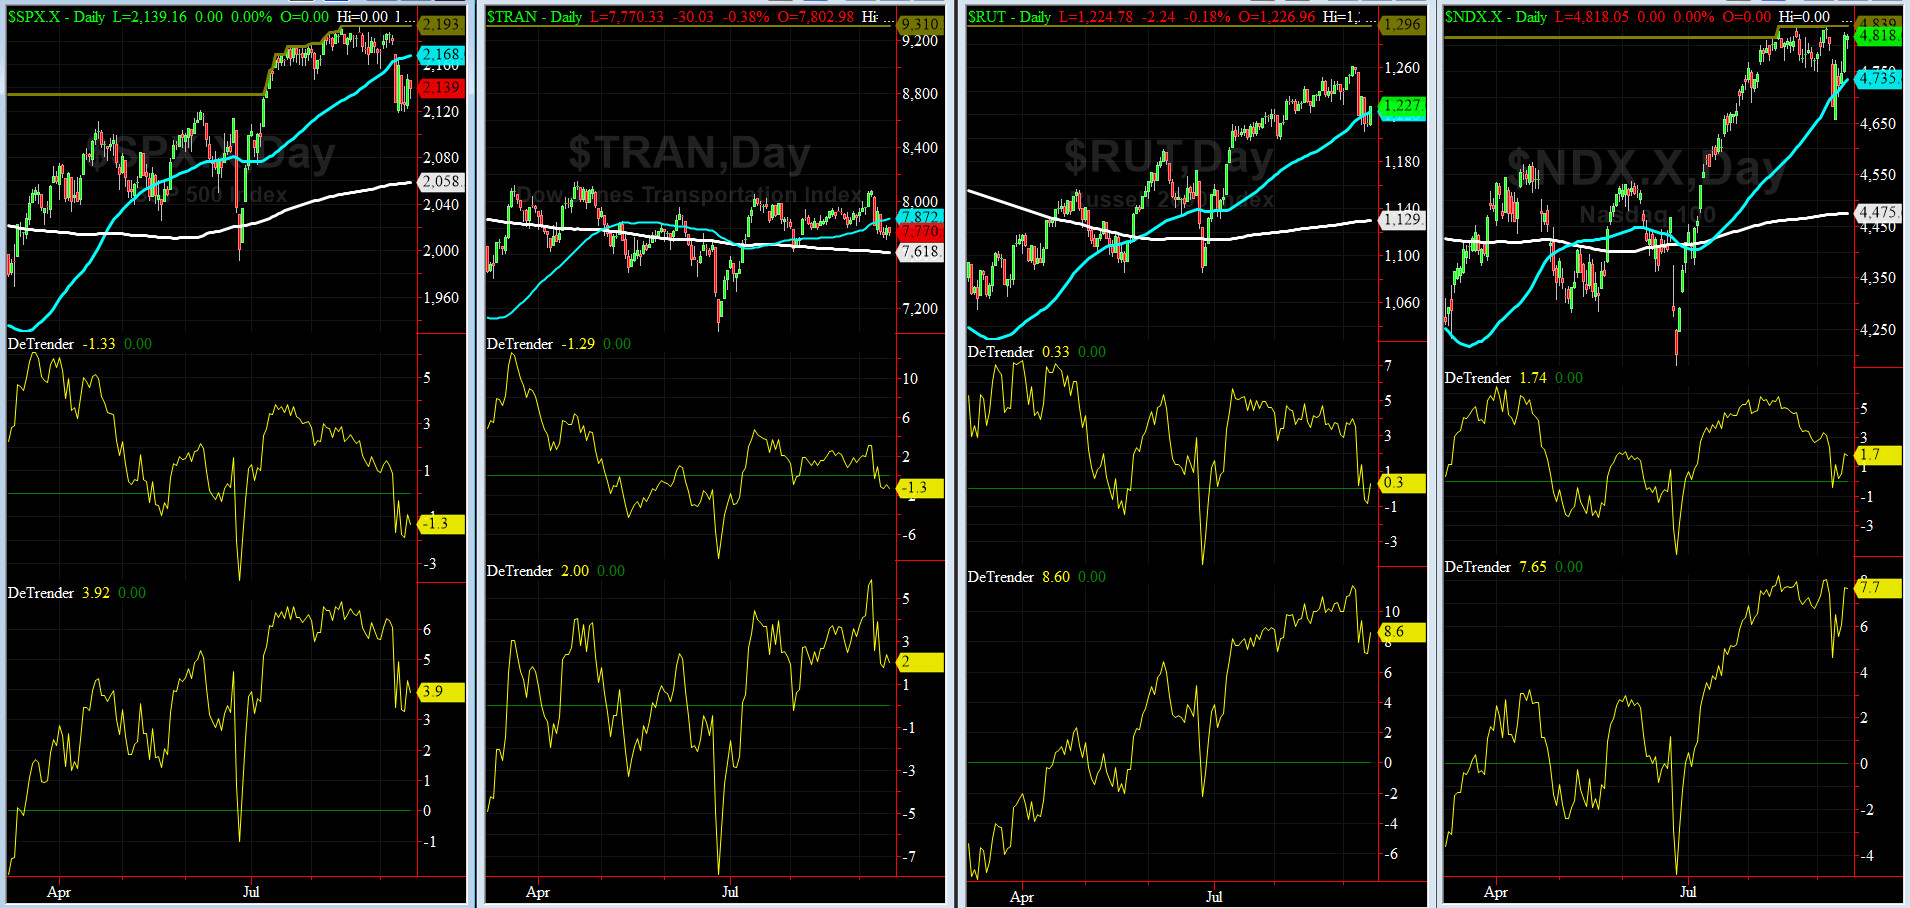
DeTrenders Charts for SPX, NDX, TRAN & RUT Indices
50-Day MA SPX = 2168 or 1.3% above SPX (max observed in last 5 yrs = +8.6%, min = -9.3%)
200-Day MA SPX = 2058 or 3.9% below SPX (max observed in last 5 yrs = 15.2%, min = -14%)
On Friday, only 2 of our 8 DeTrenders were negative. DeTrenders for TRAN & RUT continue to remain on our radar as we monitor their price action with caution.
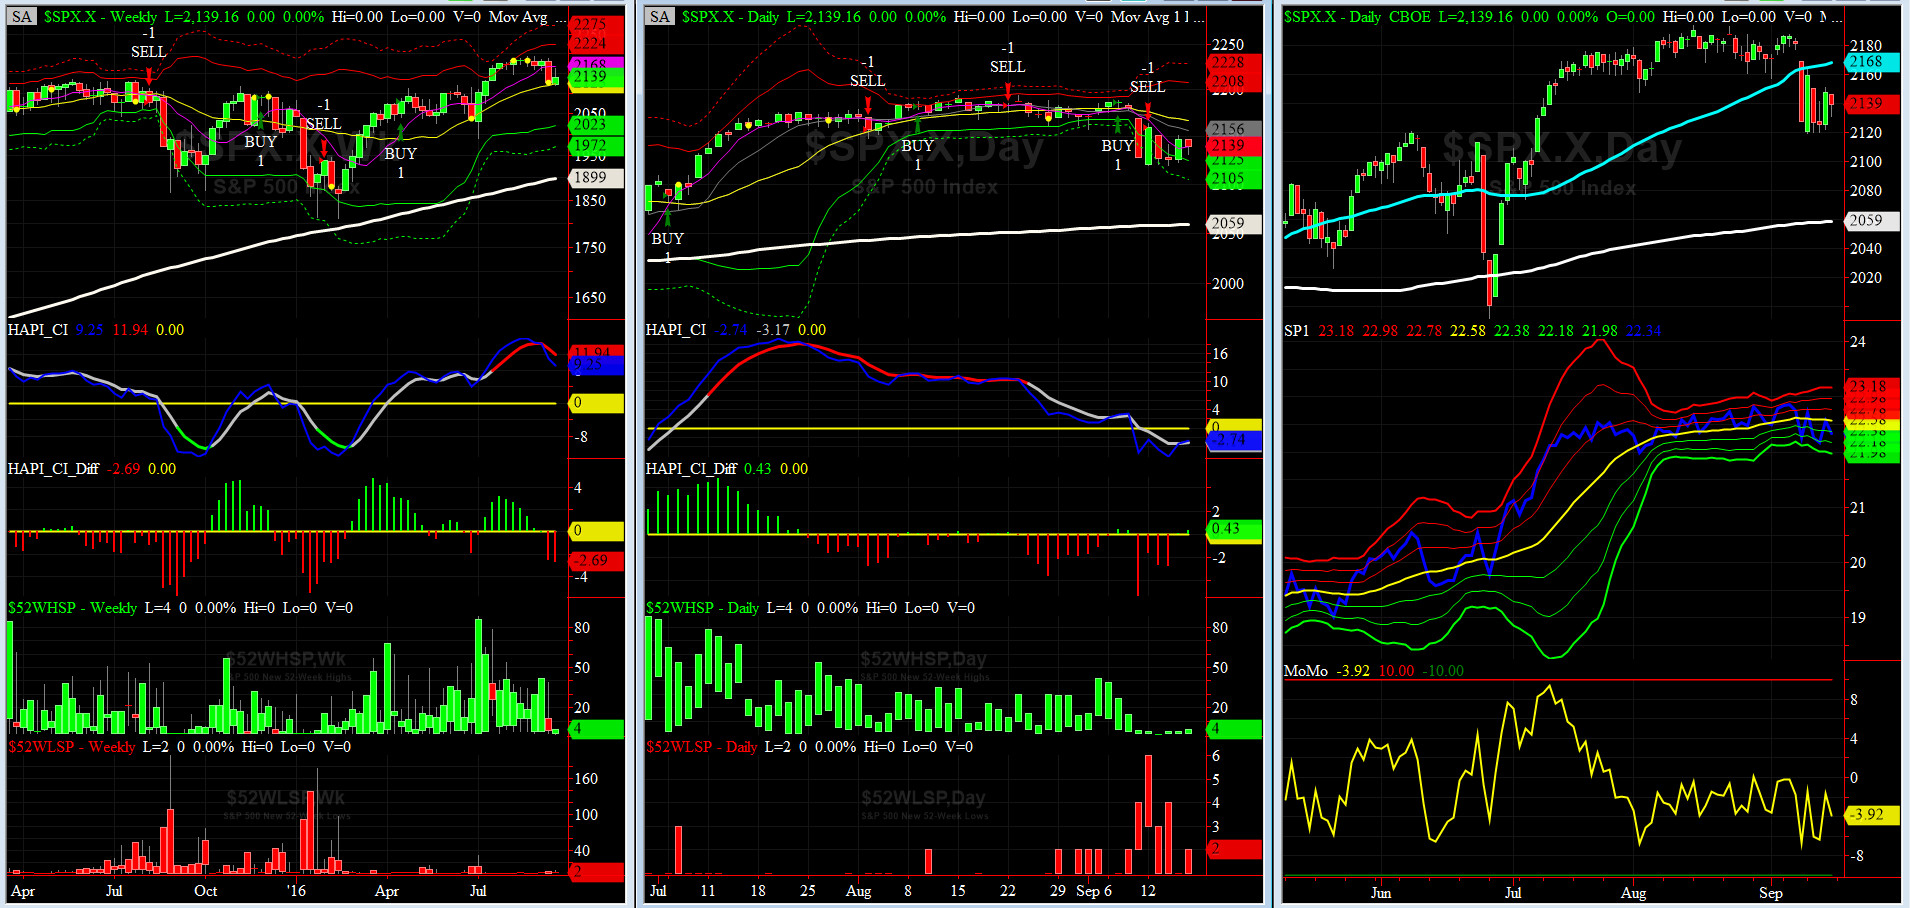
HA_SP1_Momo Chart
WEEKLY Timing Model = on a BUY Signal since Friday 4/15/16 CLOSE at 2081
DAILY Timing Model = on a BUY Signal since Monday 9/12/16 CLOSE at 2159
Max SPX 52wk-highs reading last week = 11 (over 120-140, the local maxima is in)
Max SPX 52wk-Lows reading last week = 4 (over 40-60, the local minima is in)
HA_SP1 = just above its -2.5 sigma channels
HA_Momo = -3.9(reversals most likely occur above +10 or below -10)
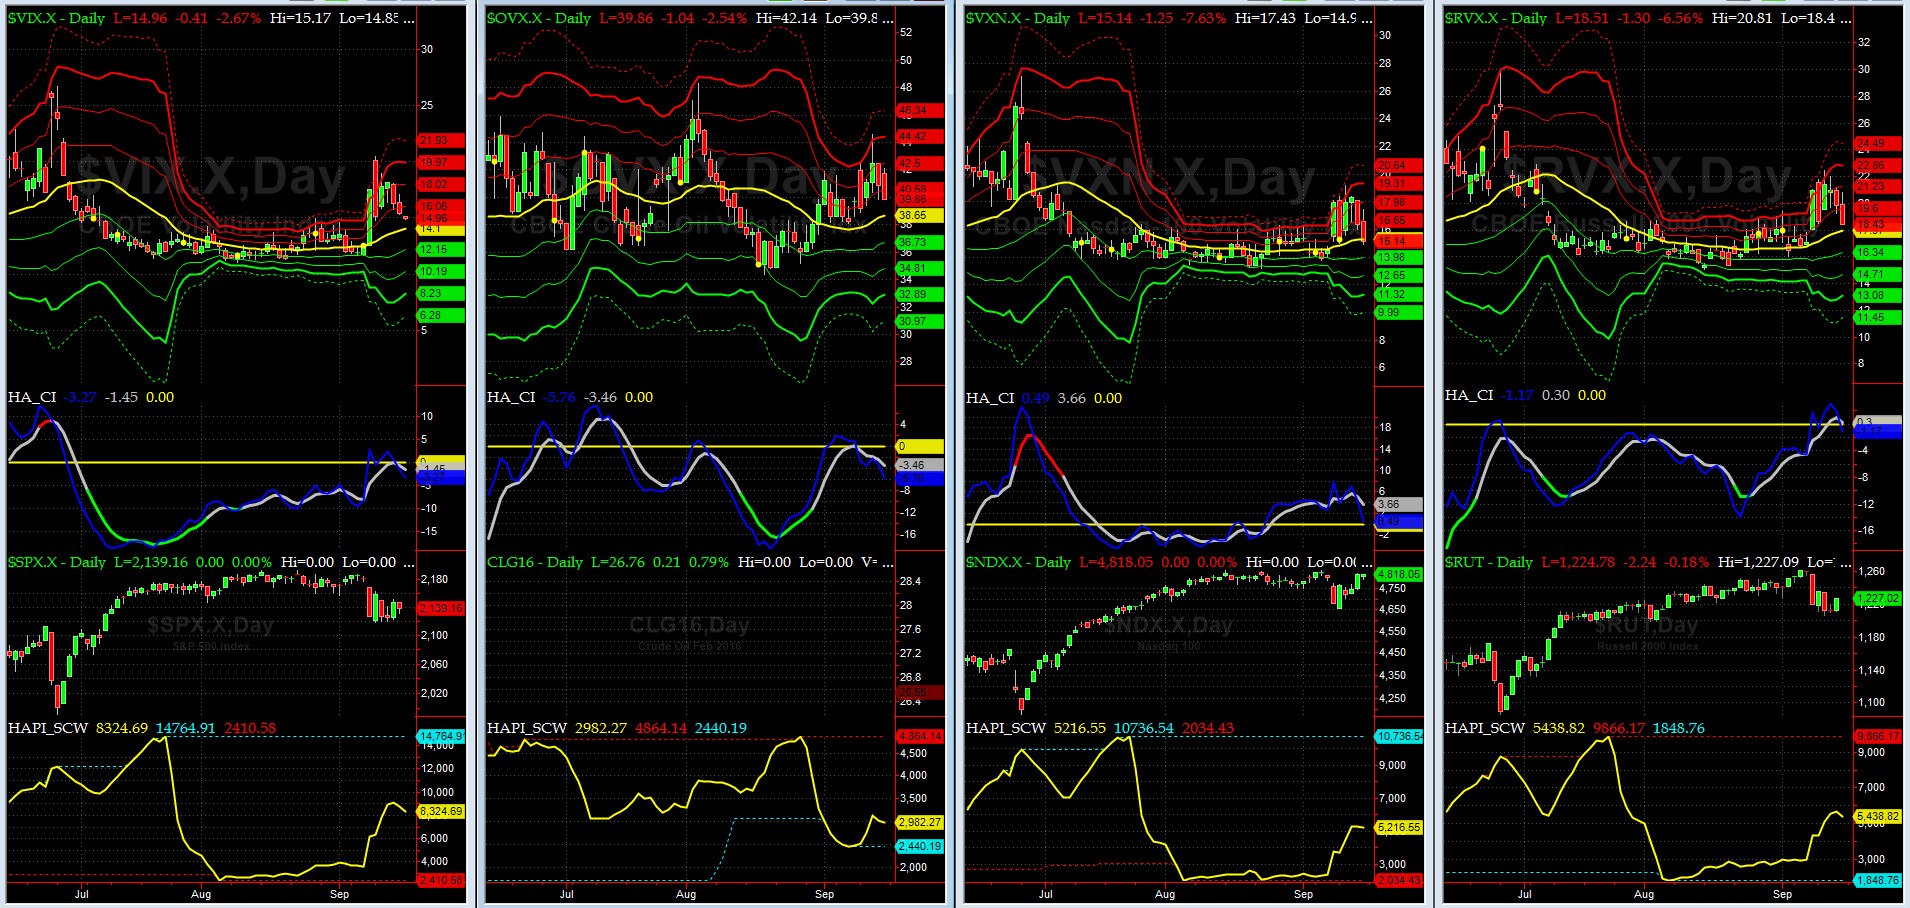
Vol of the Vols Chart
VIX = 15.4 is almost at its +0.5 sigma (remember it�s the VIX�s vol pattern (its sigma channels) that matters, and not the level of VIX itself (this is per Dr. Robert Whaley, a great mentor and the inventor of original VIX, now called VXO). VIX usually peaks around a test of its +4 sigma).
This shockwave is dampening fast.
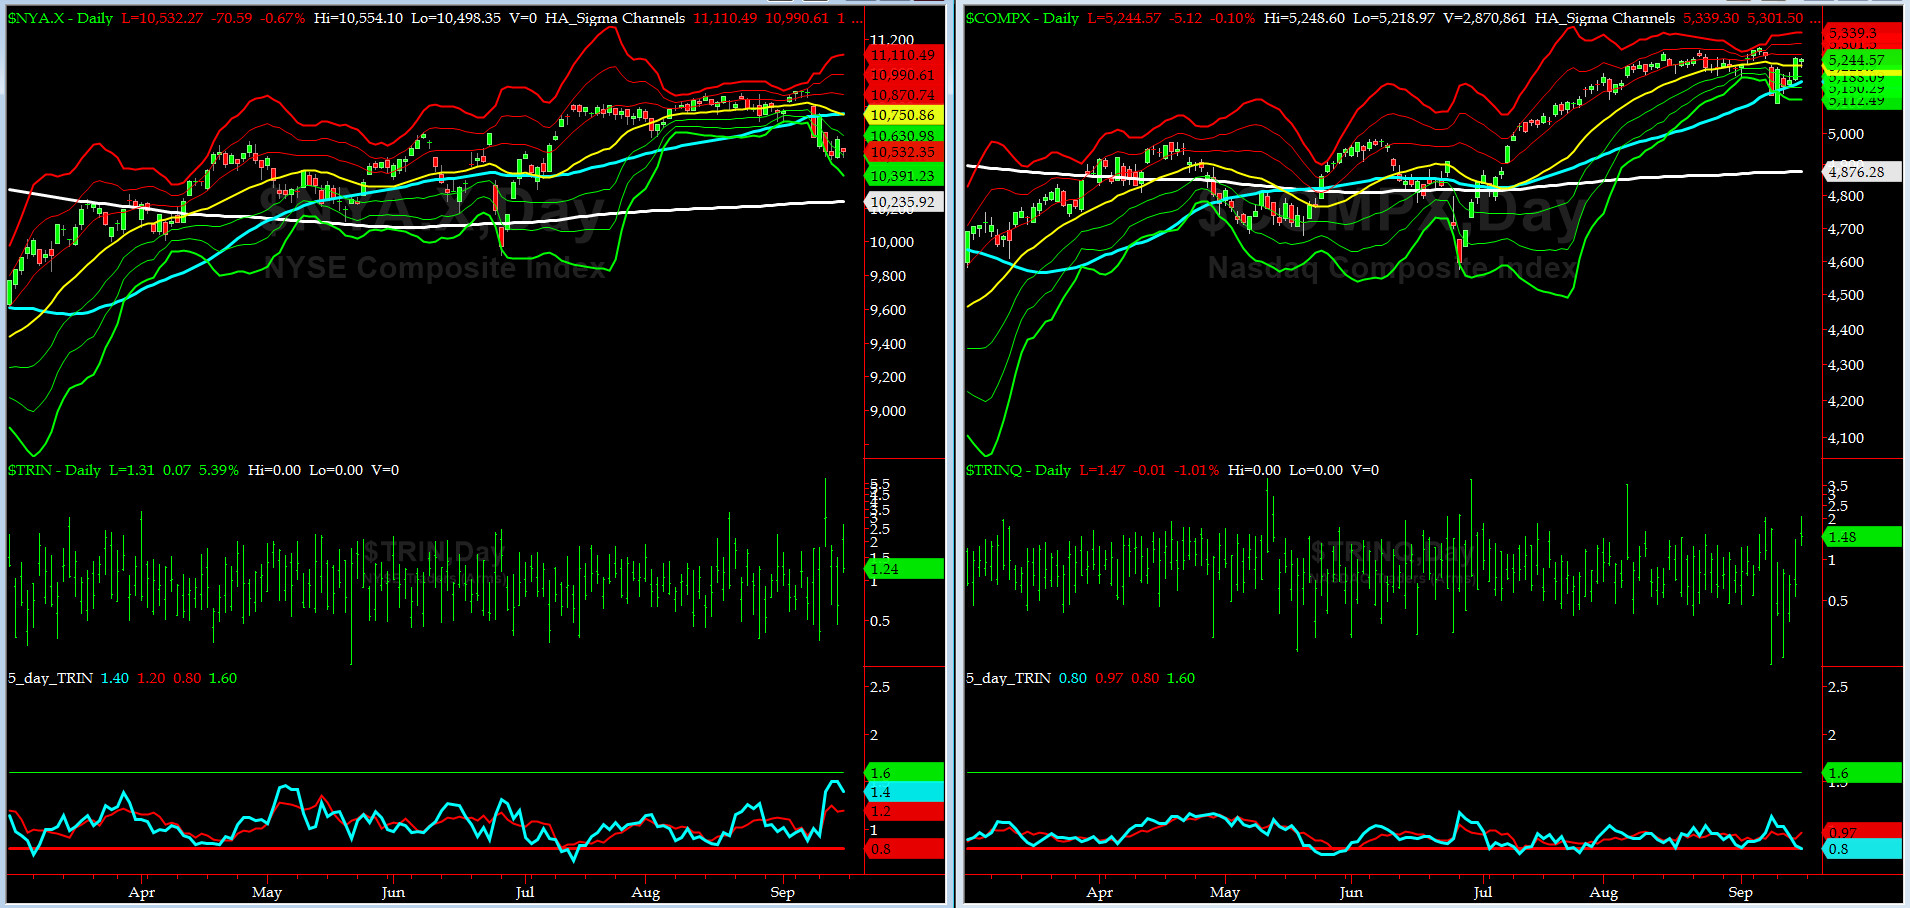
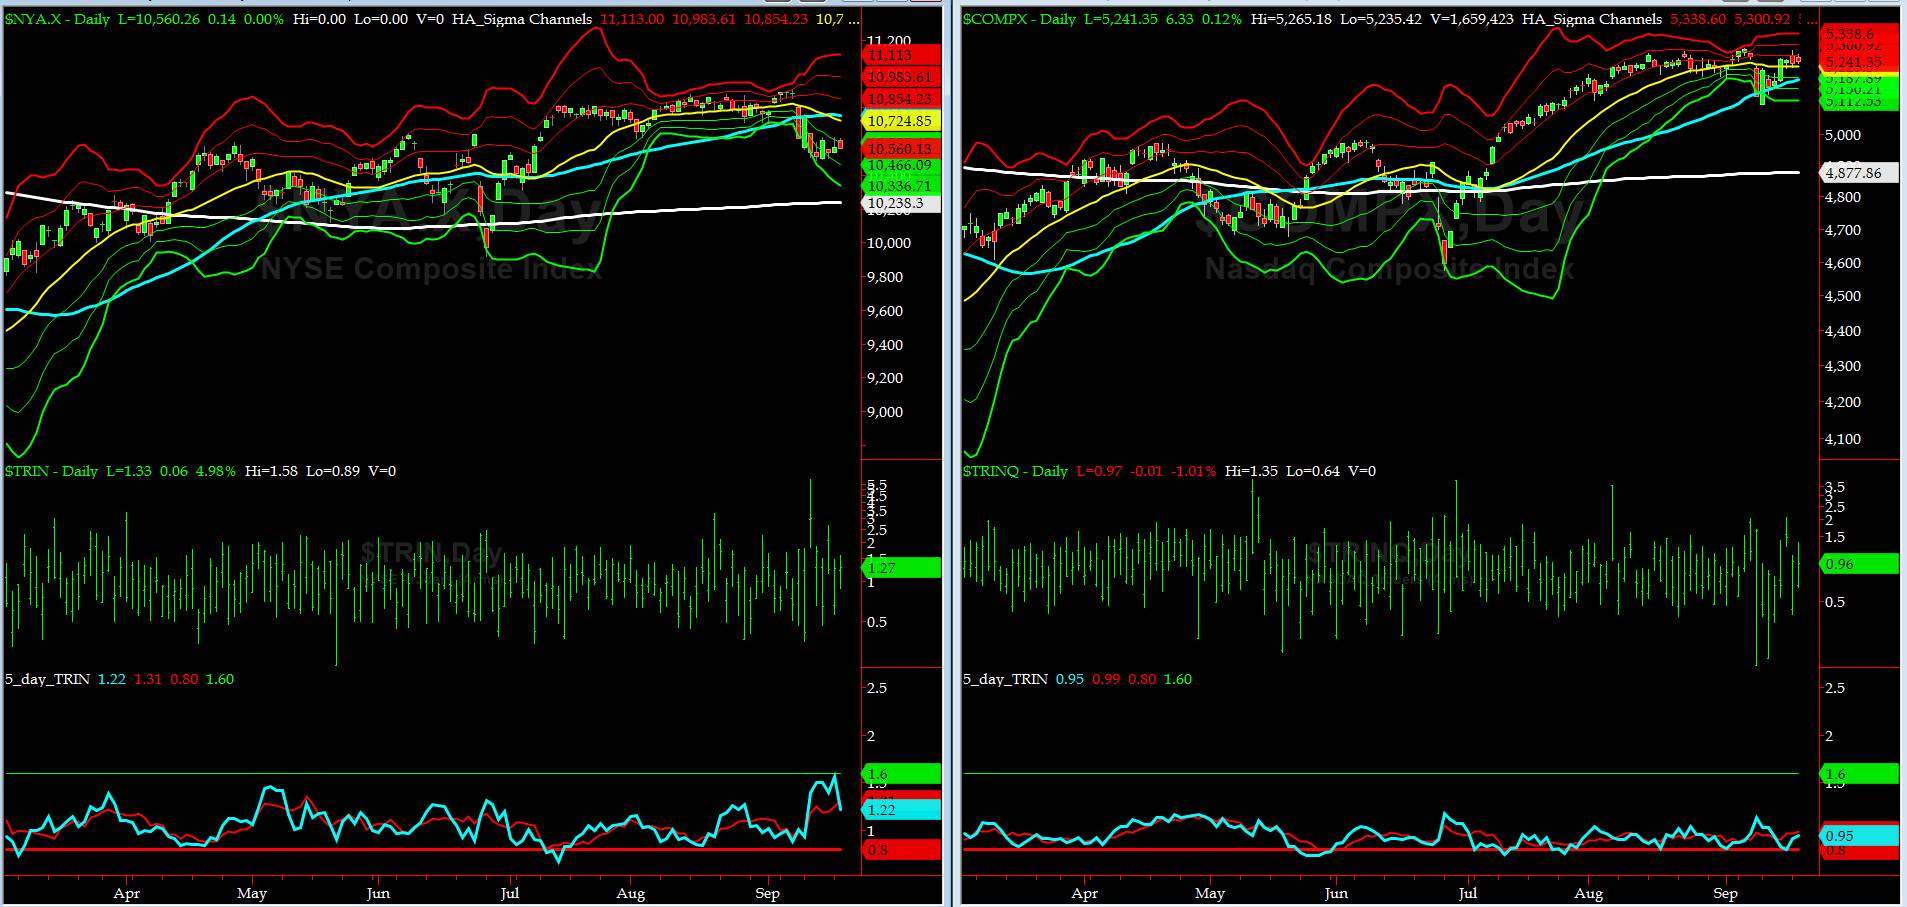
5-day TRIN & TRINQ Charts
NYSE 5-day TRIN is very near a BUY Signal........
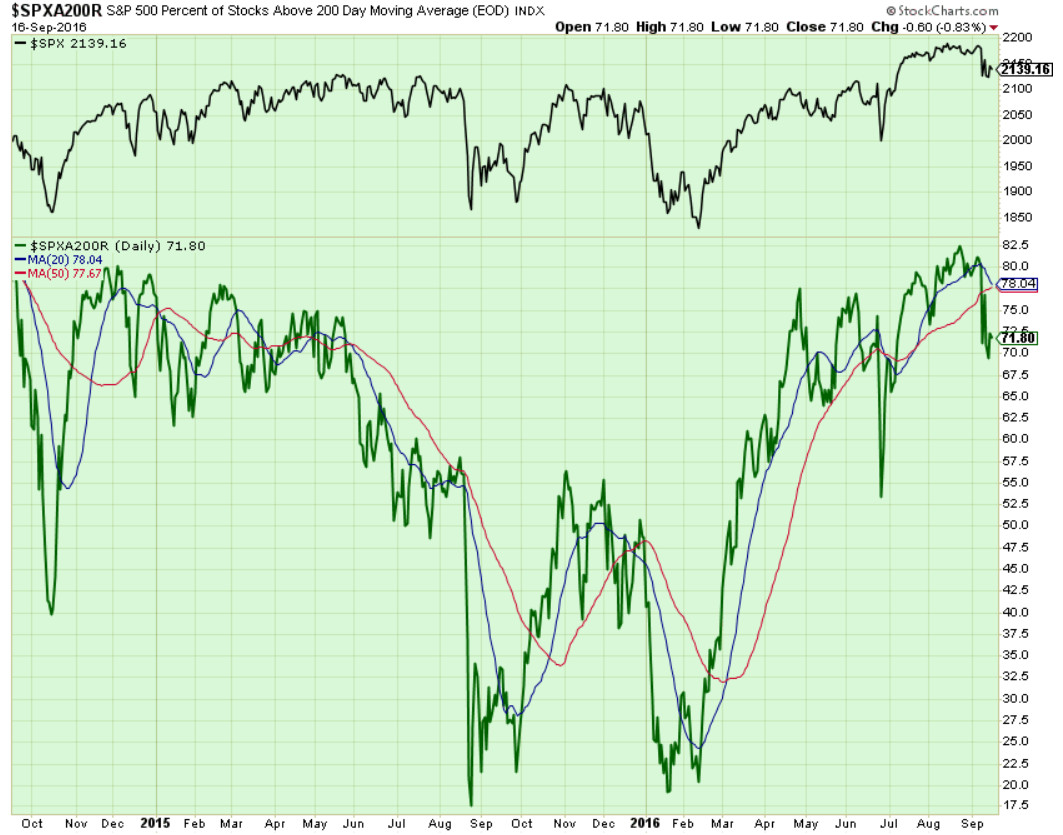
Components of SPX above their respective 200day MA Chart
This scoring indicator basically remained flat this past week.
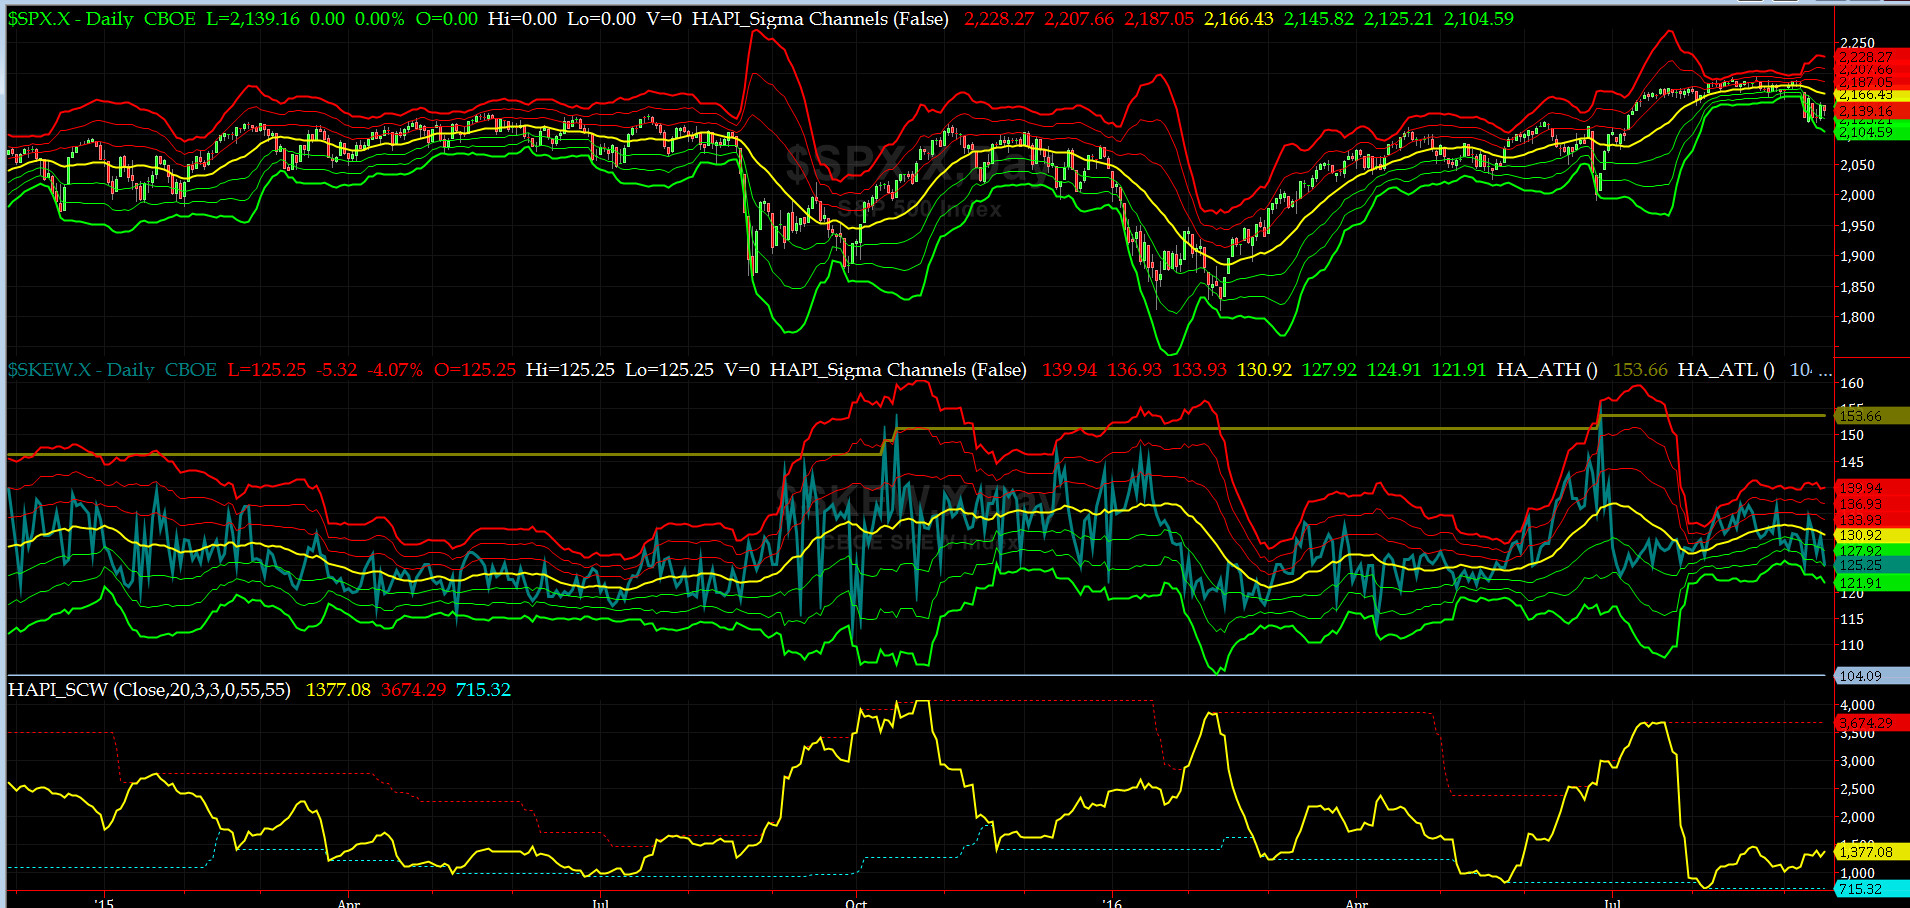
SPX SKEW (Tail Risk) Chart
SPX SKEW (Tail Risk) moved around ~127 and then settled on 125 which is about its -2 sigma (normal = 120-125, range 100-150)
All is NOT Quiet on the Mid-Western Front. Smart Money was correct in discounting near term trouble ahead (contested US General Election?)
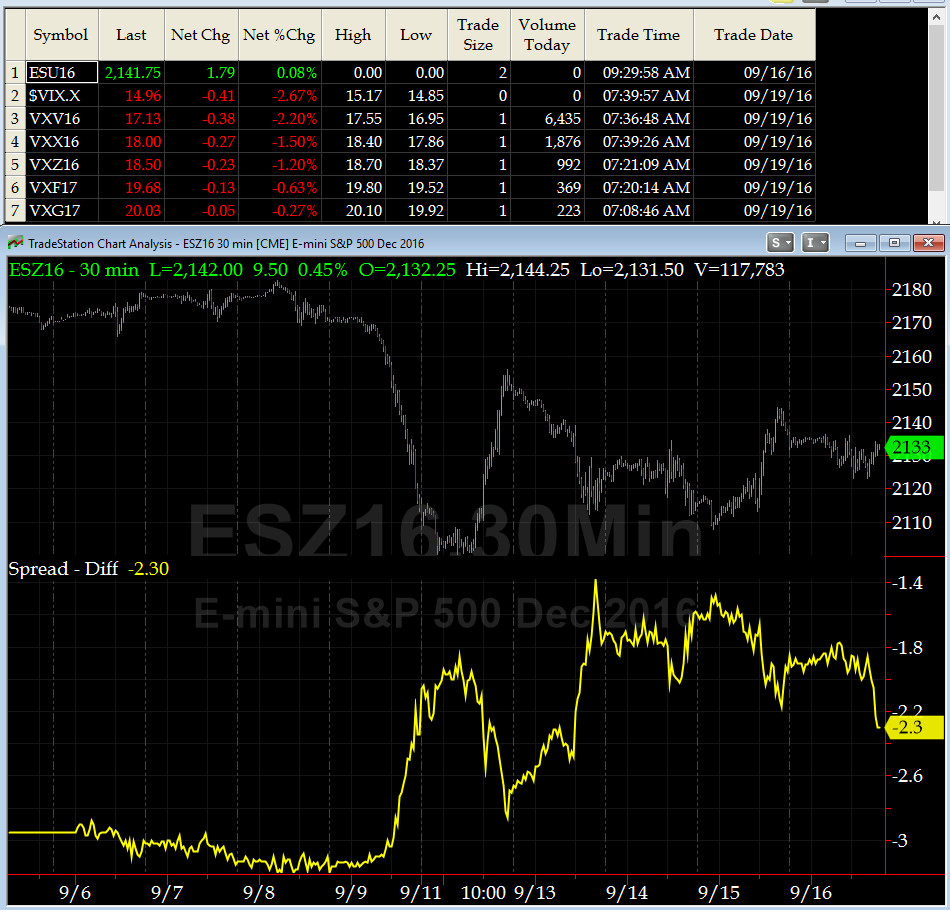
3-month VIX Futures Spread(VX) Chart
Our 3-month VIX Futures Spread (LONG OCT16 & SHORT JAN17) closed at -2.3 on Friday. This is somewhat of a neutral reading.

HA_SP2 Chart
HA_SP2 = 42 (Buy signal <= 25, Sell Signal >= 75)
This indicator is way neutral here.
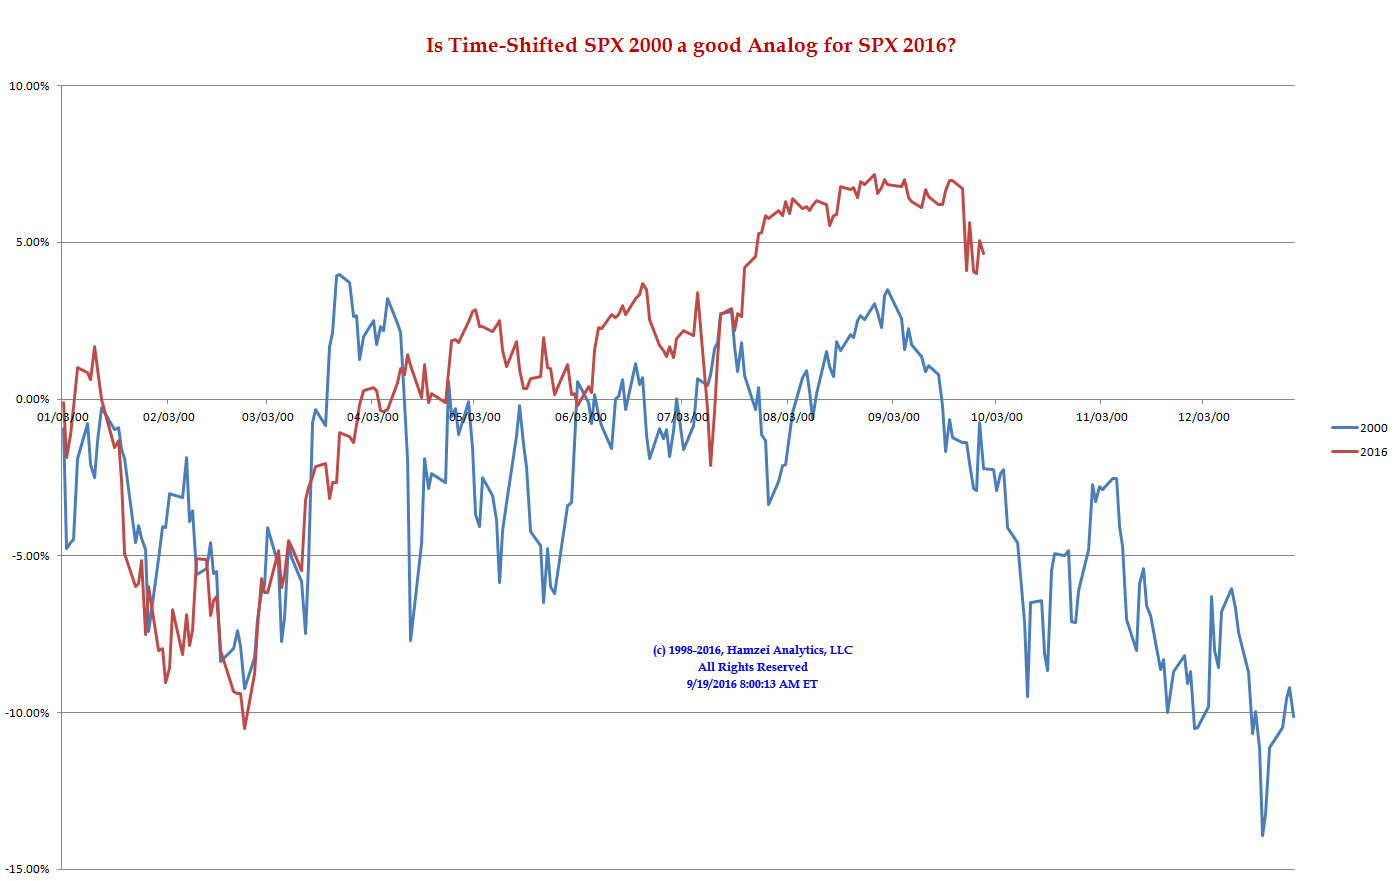
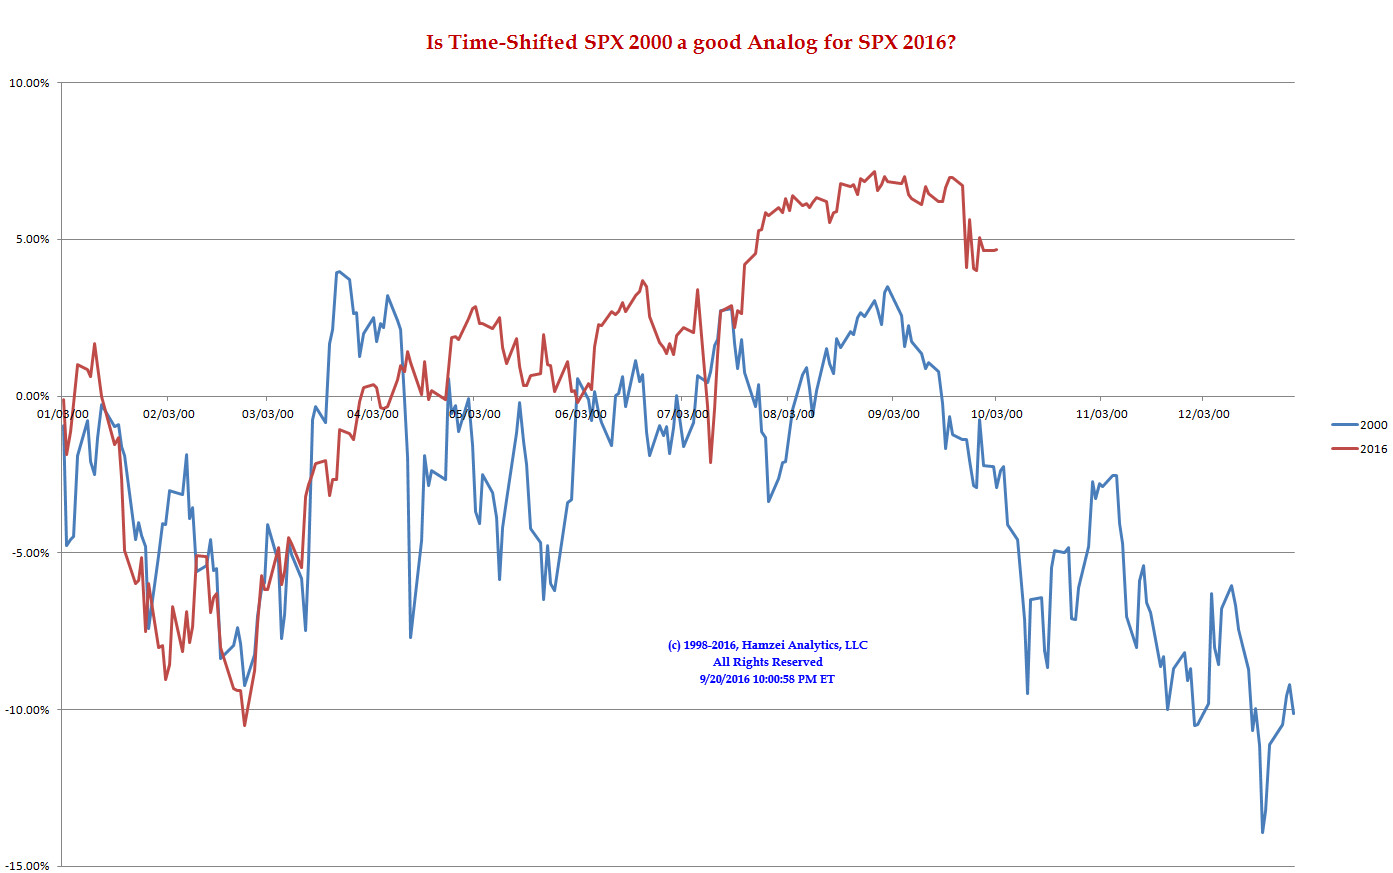
SPX 2000 Analog for SPX 2016
Here is another question from our beloved Capt_Tiko: When will the other shoe drop?
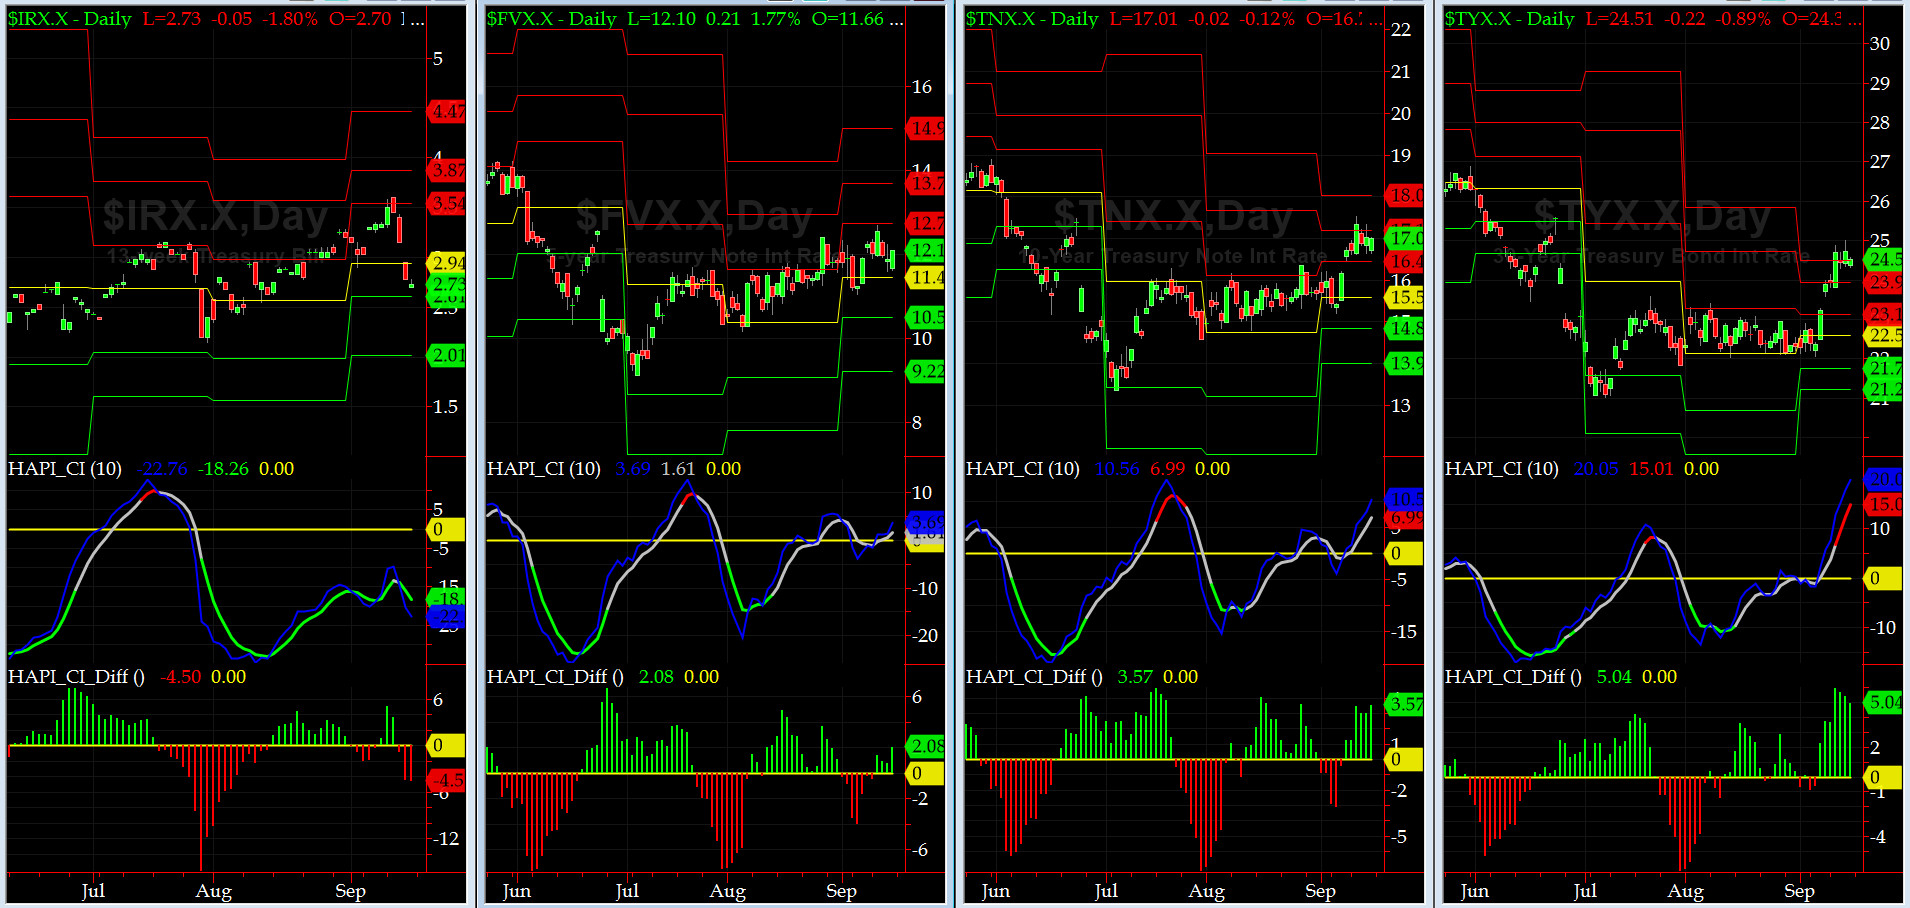
US Treasury T-Notes & T-Bonds Yields Chart
The drop in 91-day discount rate was massive, rest of the yield curve was very docile.
Fari Hamzei
|


 Proactive Market Timing