|
Sunday, October 16, 2016, 2330ET
Market Timing Charts, Analysis & Commentary for Issue #163
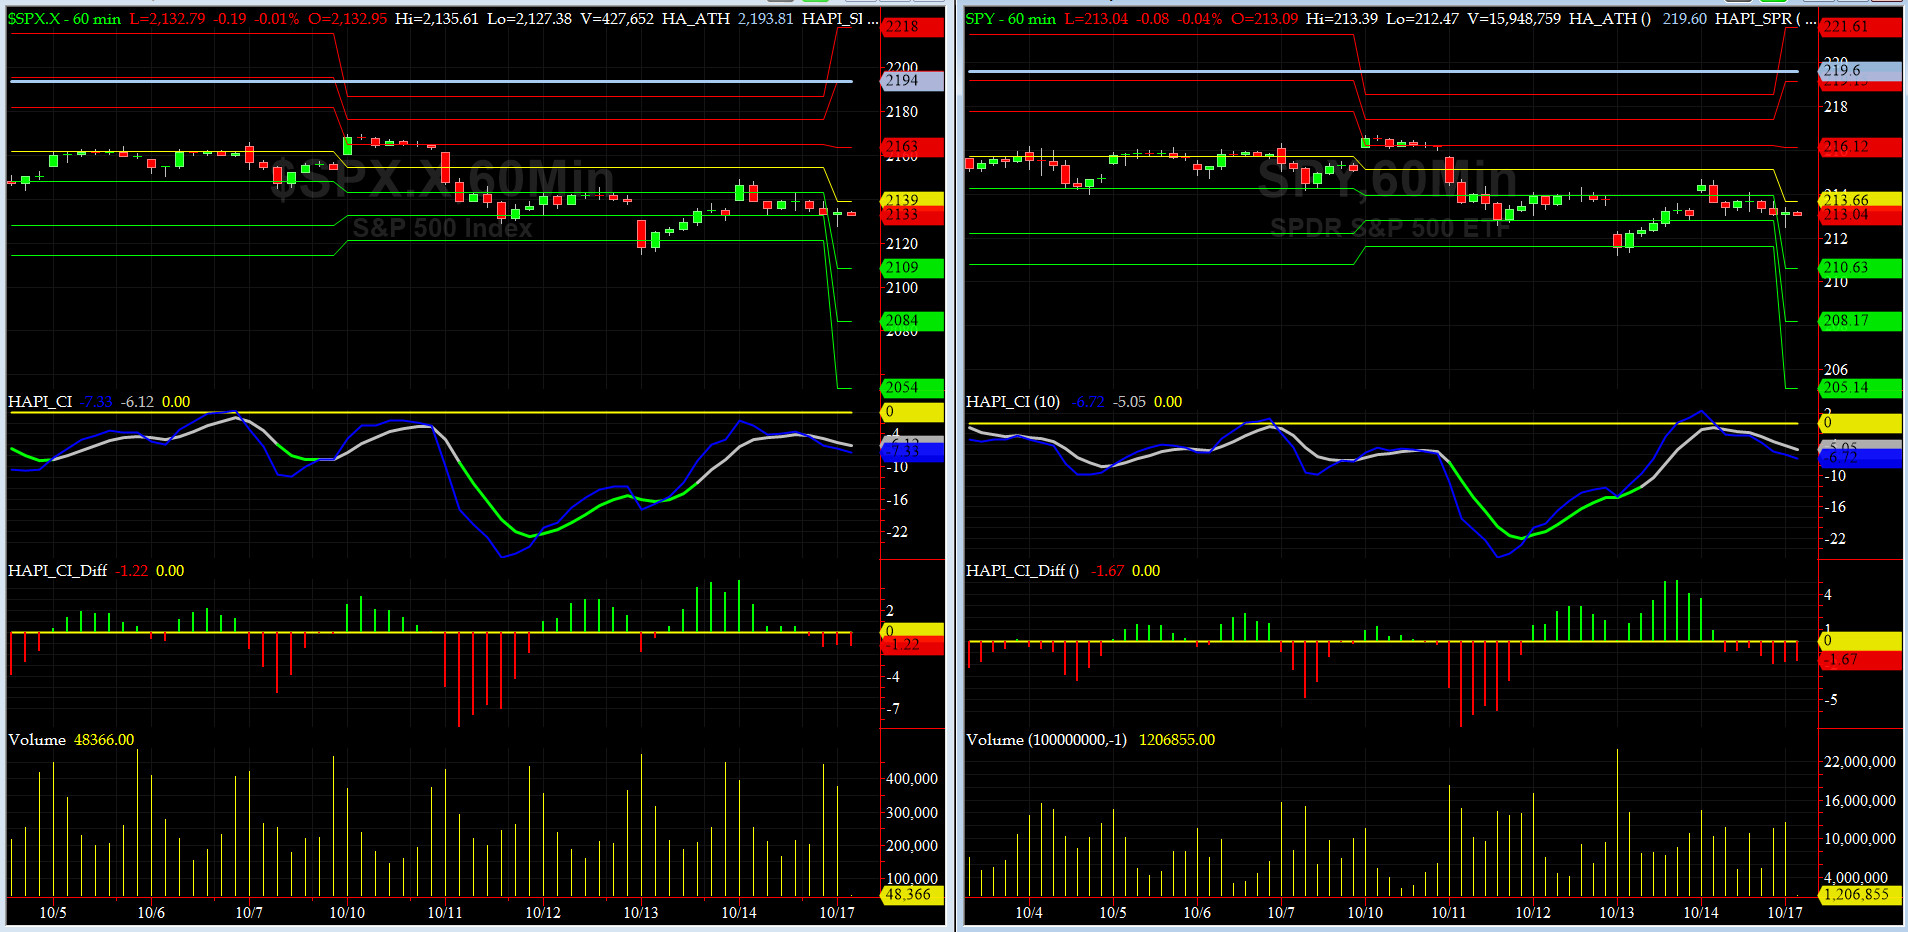
Timer Charts of S&P-500 Cash Index (SPX) + NASDAQ-100 Cash Index (NDX)
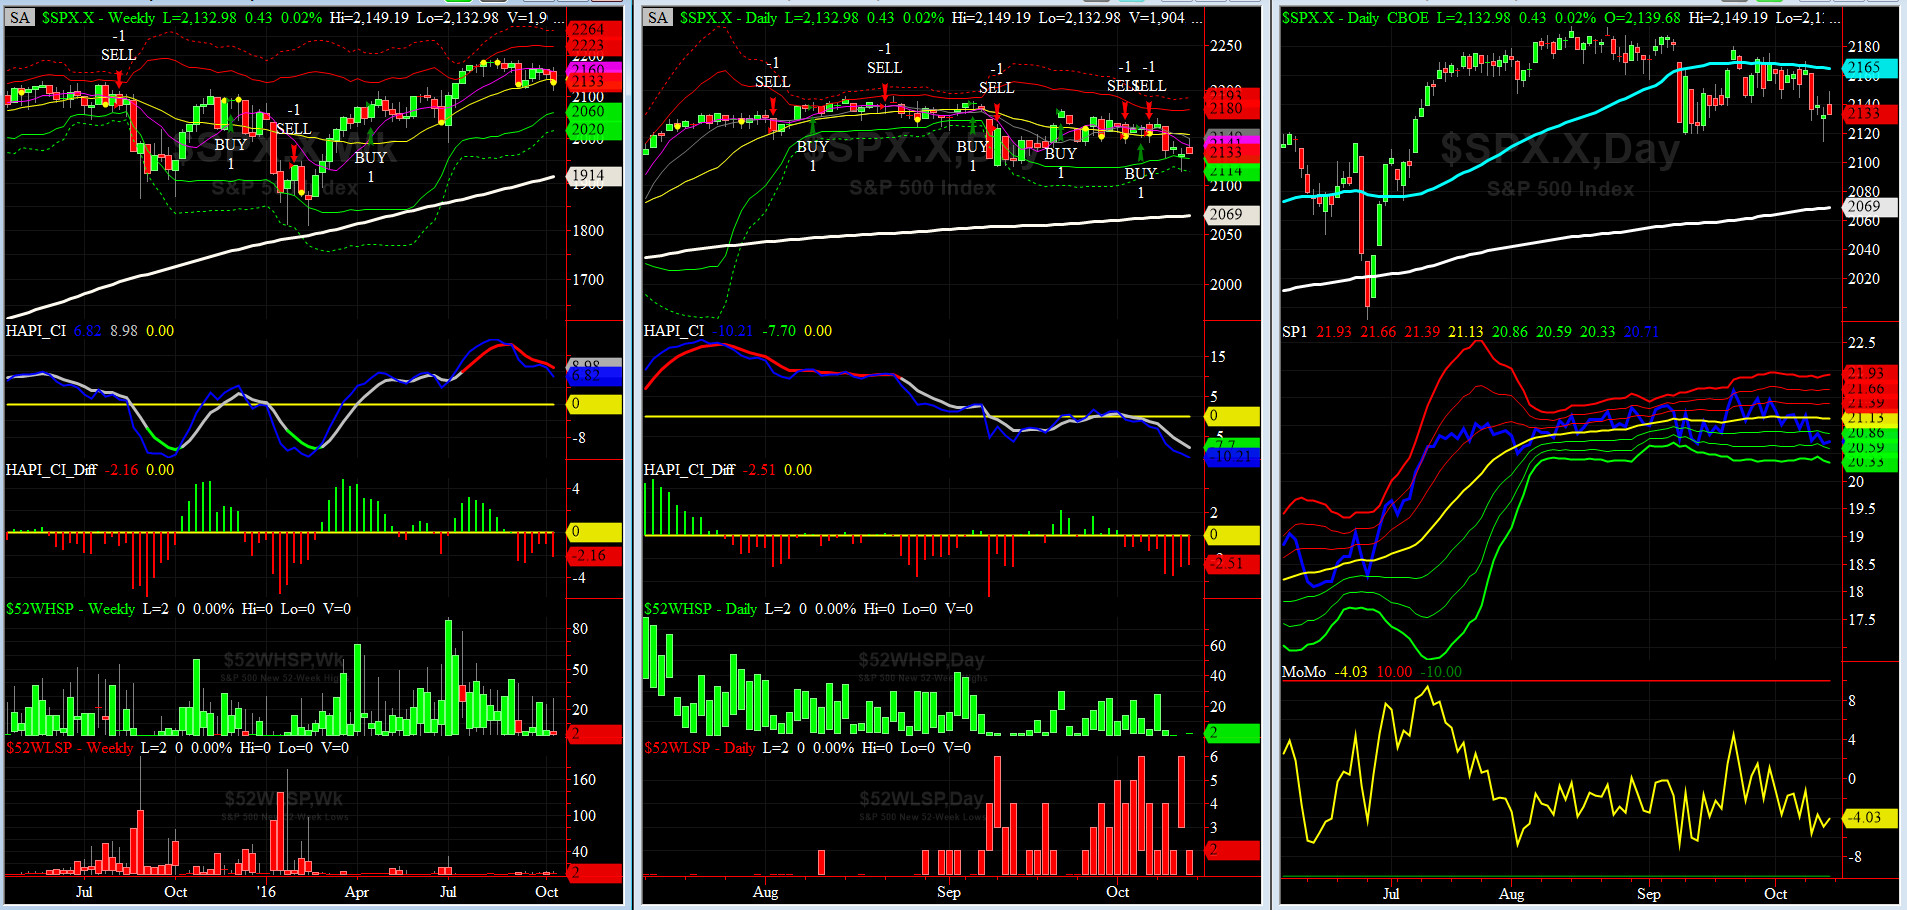
Most recent S&P-500 Cash Index (SPX): 2132.98 down -20.75 (down -0.96%) for the week ending on Friday, October 14th, 2016, which closed at its -1.5 sigma.
SPX ALL TIME INTRADAY HIGH = 2193.81 (reached on Monday, August 15, 2016)
SPX ALL TIME CLOSING HIGH = 2190.15 (reached on Monday, August 15, 2016)
Current DAILY +2 Sigma SPX = 2180 with WEEKLY +2 Sigma = 2223
Current DAILY 0 Sigma (20 day MA) SPX = 2154 with WEEKLY 0 Sigma = 2142
Current DAILY -2 Sigma SPX = 2127 with WEEKLY -2 Sigma = 2060
NYSE McClellan Oscillator = -141 (-150 is start of the O/S area; around -275 to -300 area or lower, we go into the �launch-pad� mode, over +150, we are in O/B area)
NYSE Breadth Thrust = 44.9 (40 is considered as oversold and 65 as overbought)
This week, we must keep an eye on NYSE Down to Up Volume Ratio. Last Tuesday & Thursday, we saw quite a sell off but the NYSE Down to Up Volume Ratios remained pretty tame, telling us bottom is not near. Should they spike hard, then we have to reassess quickly where we are, relative to a potential bottom.
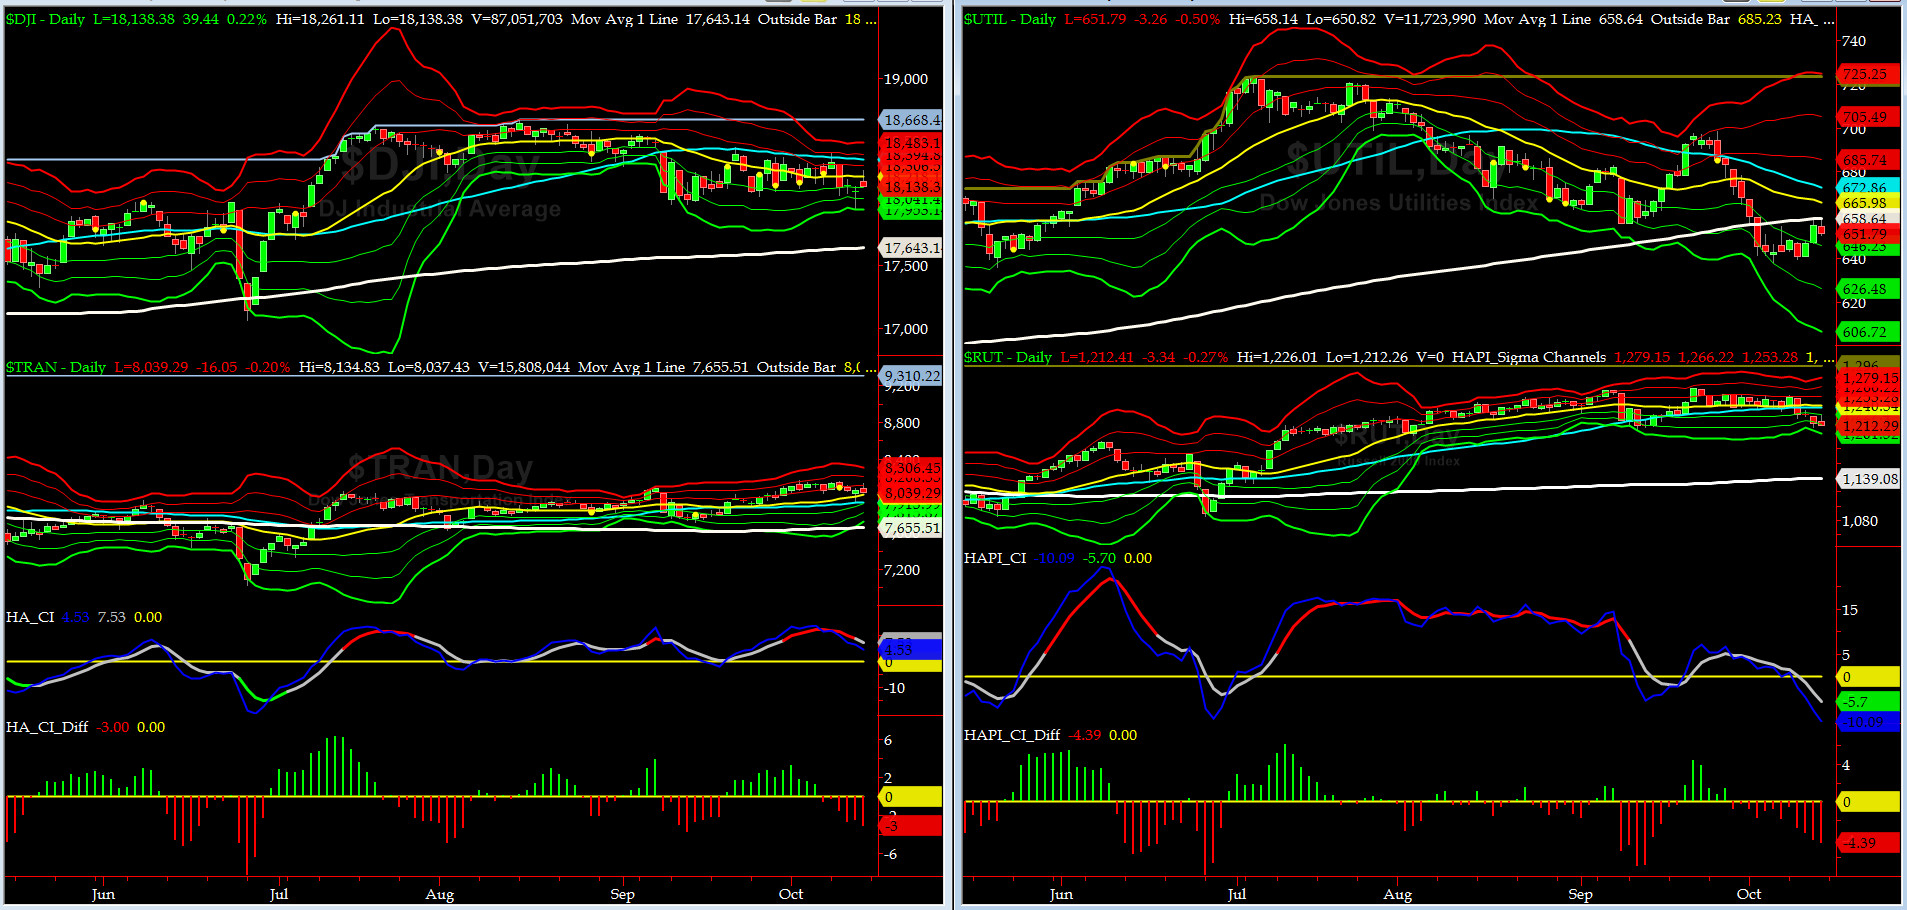
Canaries [in the Coal Mine] Chart for DJ TRAN & RUT Indices
200-Day MA DJ TRAN = 7655 or 5% below DJ TRAN (max observed in last 5 yrs = 20.2%, min = -20.3%)
200-Day MA RUT = 1139 or 6.4% below RUT (max observed in last 5 yrs = 21.3%, min = -22.6%)
DJ Transports (proxy for economic conditions 6 to 9 months hence) had another huge drop on Thursday and bounced off of its 50-bar MA and then again closed red on Friday
Russell 2000 Small Caps (proxy for RISK ON/OFF) sold shortly this week..... RISK is not OFF yet but it is close to.
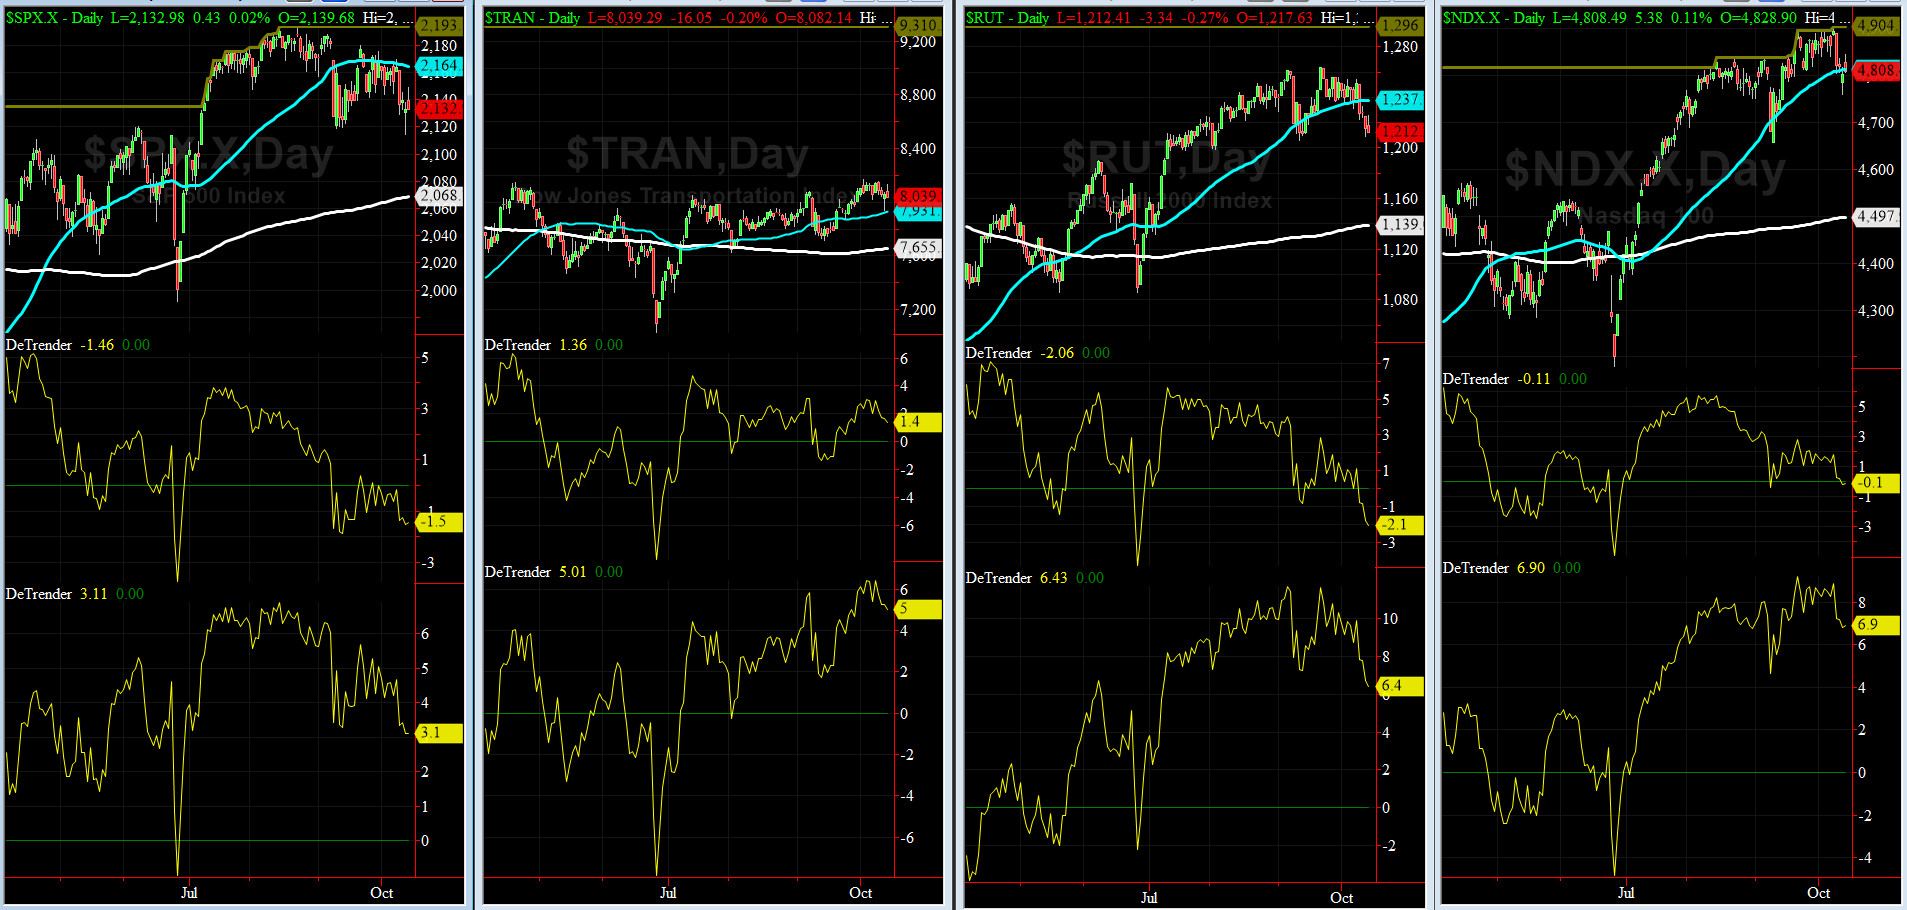
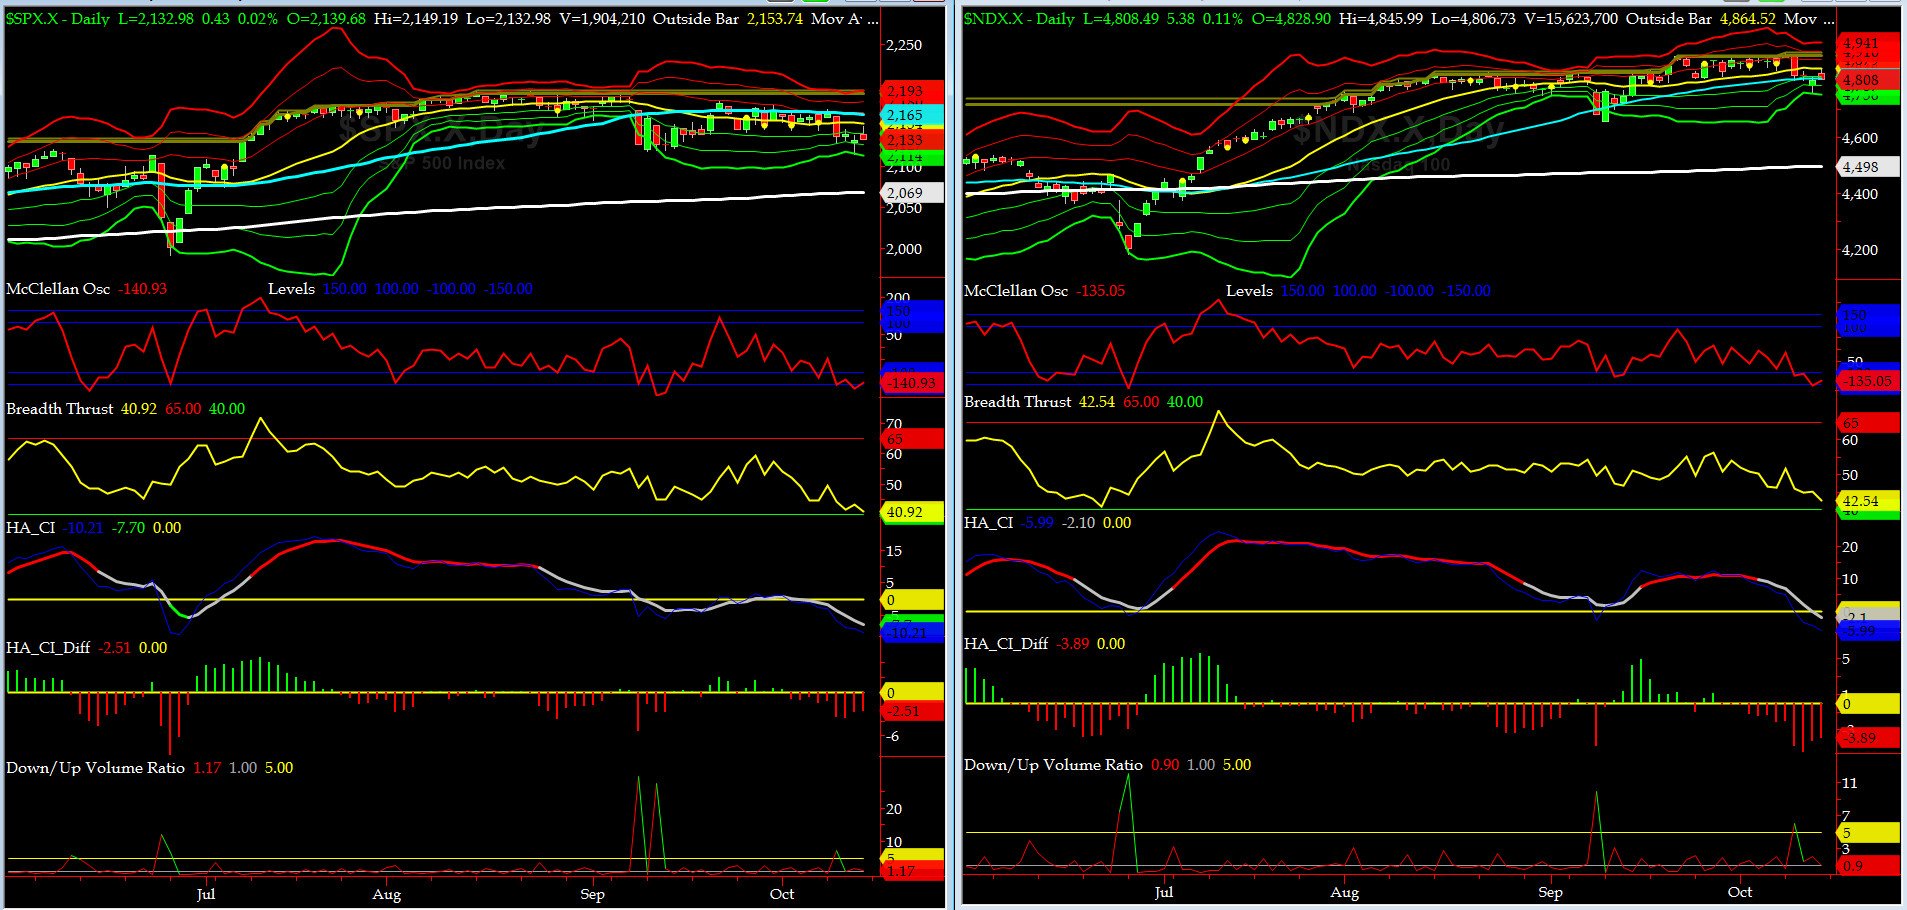
DeTrenders Charts for SPX, NDX, TRAN & RUT Indices
50-Day MA SPX = 2164 or 1.5 above SPX closed on Friday (max observed in last 5 yrs = +8.6%, min = -9.3%)
200-Day MA SPX = 2068 or 3.1% below SPX (max observed in last 5 yrs = 15.2%, min = -14%)
Currently, only 3 of our 8 DeTrenders are negative. The DeTrenders for DJ TRAN & RUT will continue to be a big tell going forward.
HA_SP1_Momo Chart
WEEKLY Timing Model = on a BUY Signal since Friday 4/15/16 CLOSE at 2081
DAILY Timing Model = on a SELL Signal since Friday 10/07/16 CLOSE at 2153
Max SPX 52wk-highs reading last week = 28 (over 120-140, the local maxima is in)
Max SPX 52wk-Lows reading last week = 6 (over 40-60, the local minima is in)
HA_SP1 = at its -1.5 sigma channels
HA_Momo = -4.03 (reversals most likely occur above +10 or below -10)
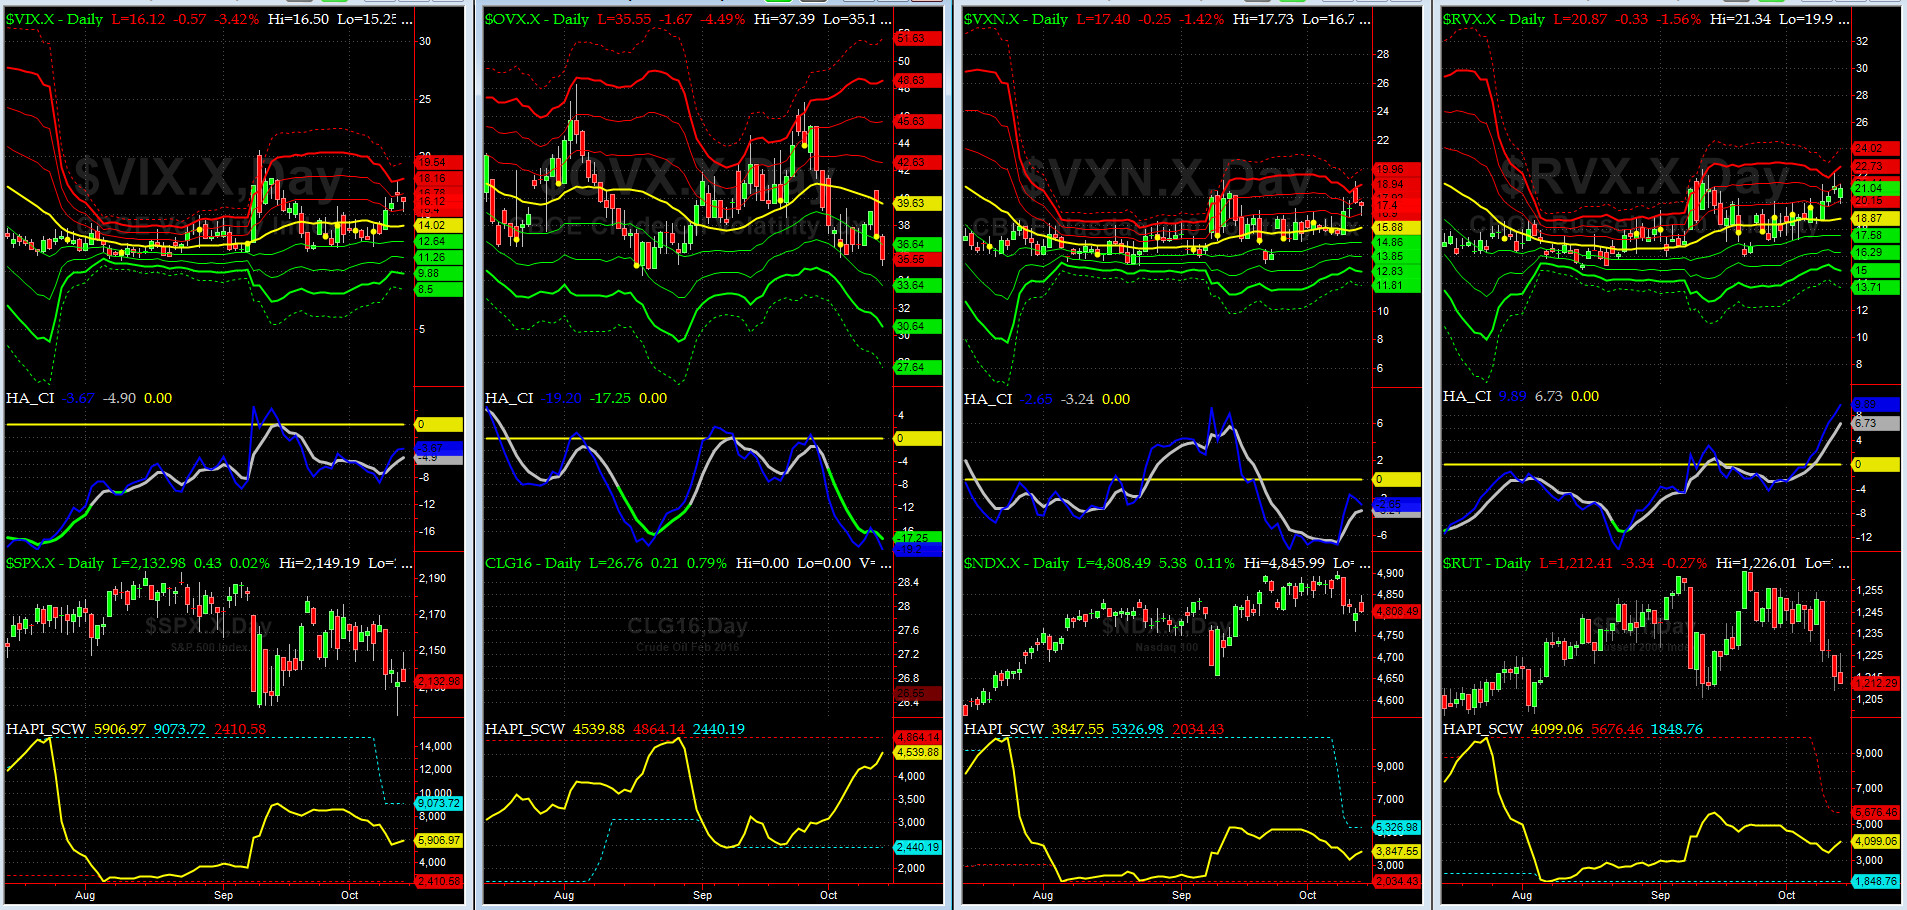
Vol of the Vols Chart
VIX = 16.1 ran up to its +3 sigma on Thursday, pulled back and closed near its +2 sigma on Friday (remember it�s the VIX�s vol pattern (its sigma channels) that matters, and not the level of VIX itself (this is per Dr. Robert Whaley, a great mentor and the inventor of original VIX, now called VXO). VIX usually peaks around a test of its +4 sigma).
The we have a new shockwave in progress. Stay tuned......
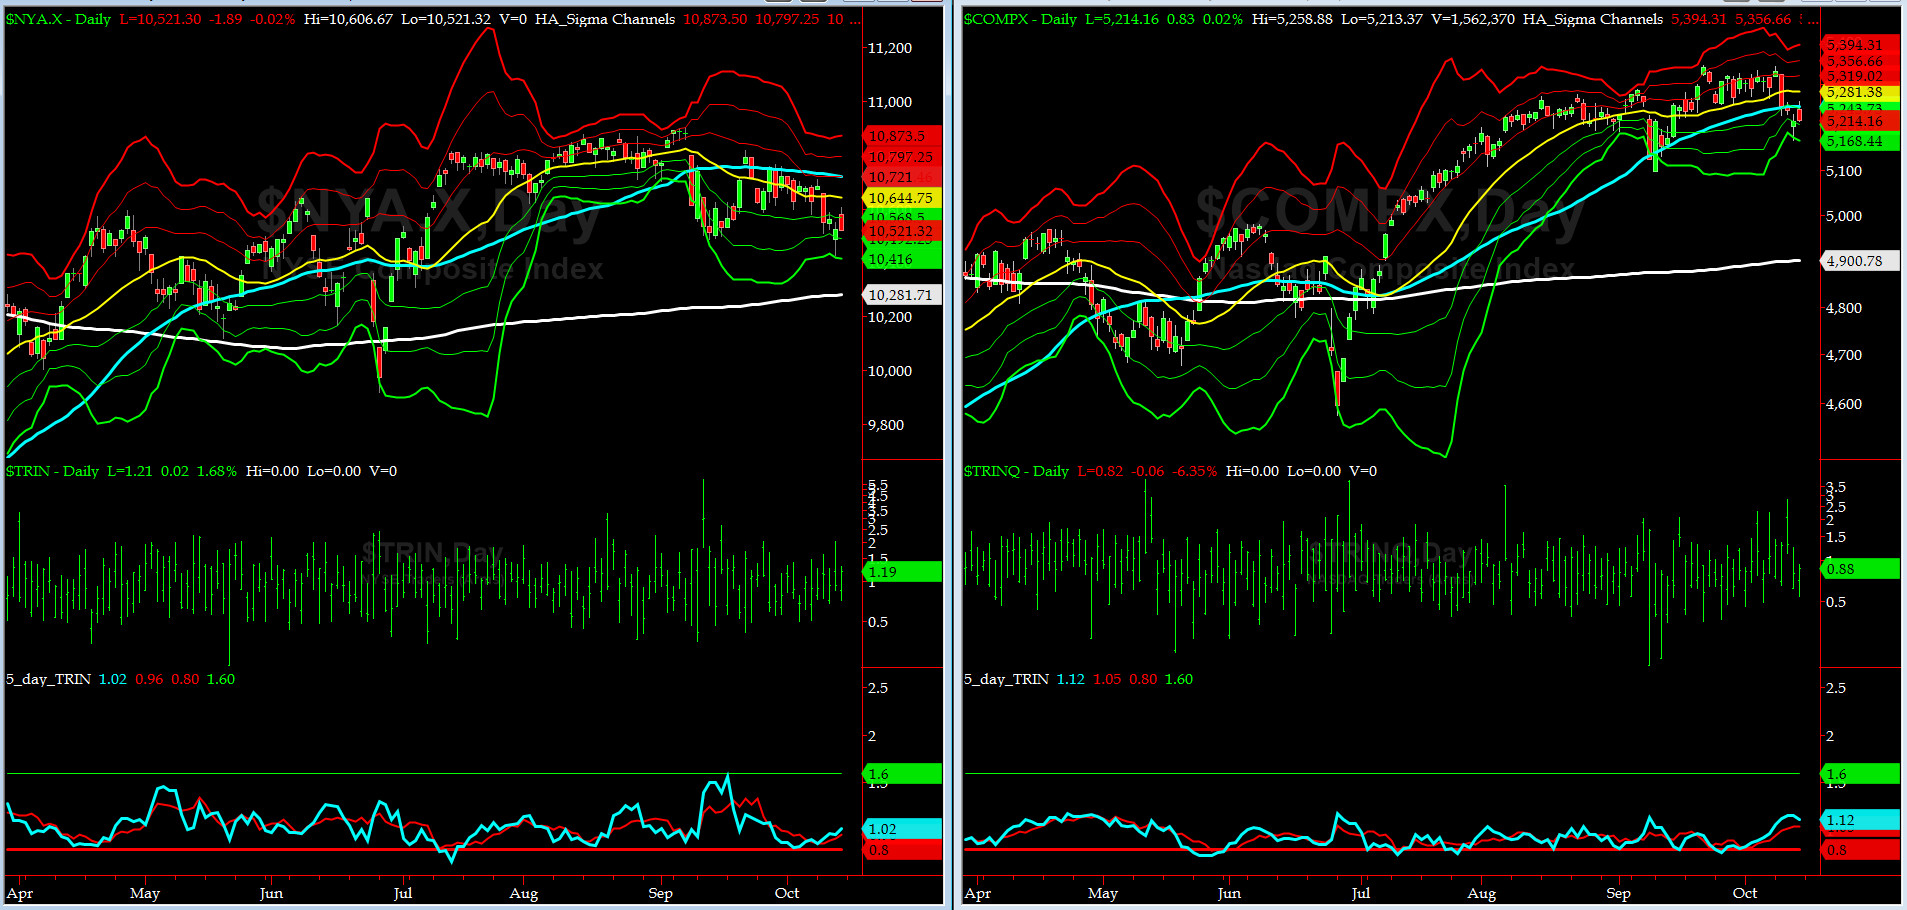
5-day TRIN & TRINQ Charts
NYSE & NASDAQ 5-day TRINs are in NEUTRAL zone here.
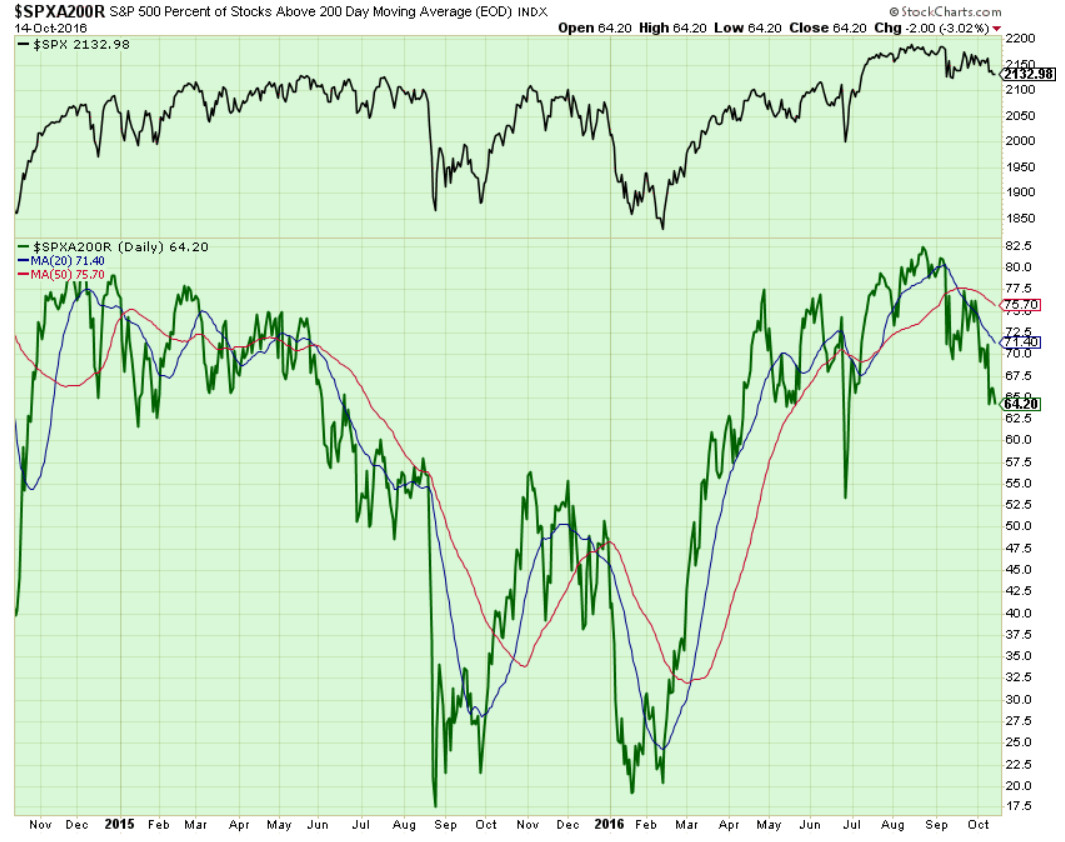
Components of SPX above their respective 200day MA Chart
This scoring indicator sank to 64% on Friday. @Capt_Tiko is still looking for 55% to 60% zone.
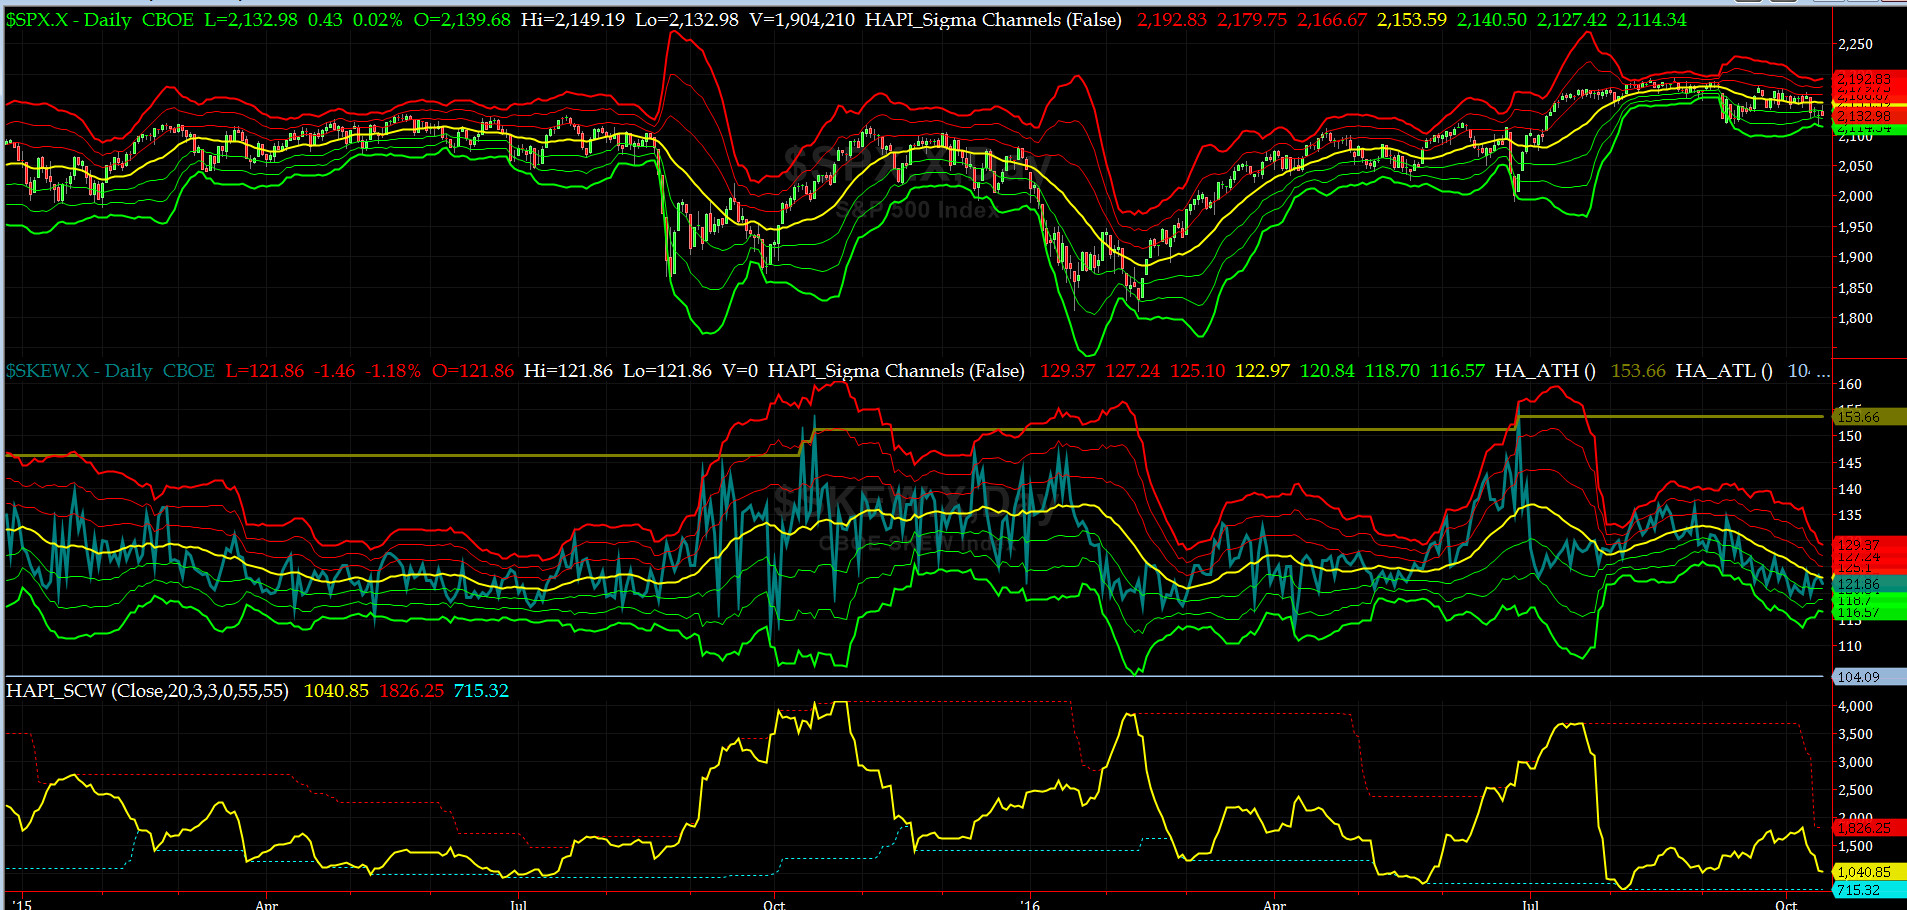
SPX SKEW (Tail Risk) Chart
SPX SKEW (Tail Risk) settled at 122 which is about its zero sigma (normal = 120-125, range 100-150)
All is getting Quieter on the Mid-Western Front. We had expected to an uptick here last week, but, then again, what do we know?

3-month VIX Futures Spread(VX) Chart
Our 3-month VIX Futures Spread (LONG NOV16 & SHORT FEB17) rose to -1.85, resulting again in a no clear signal.
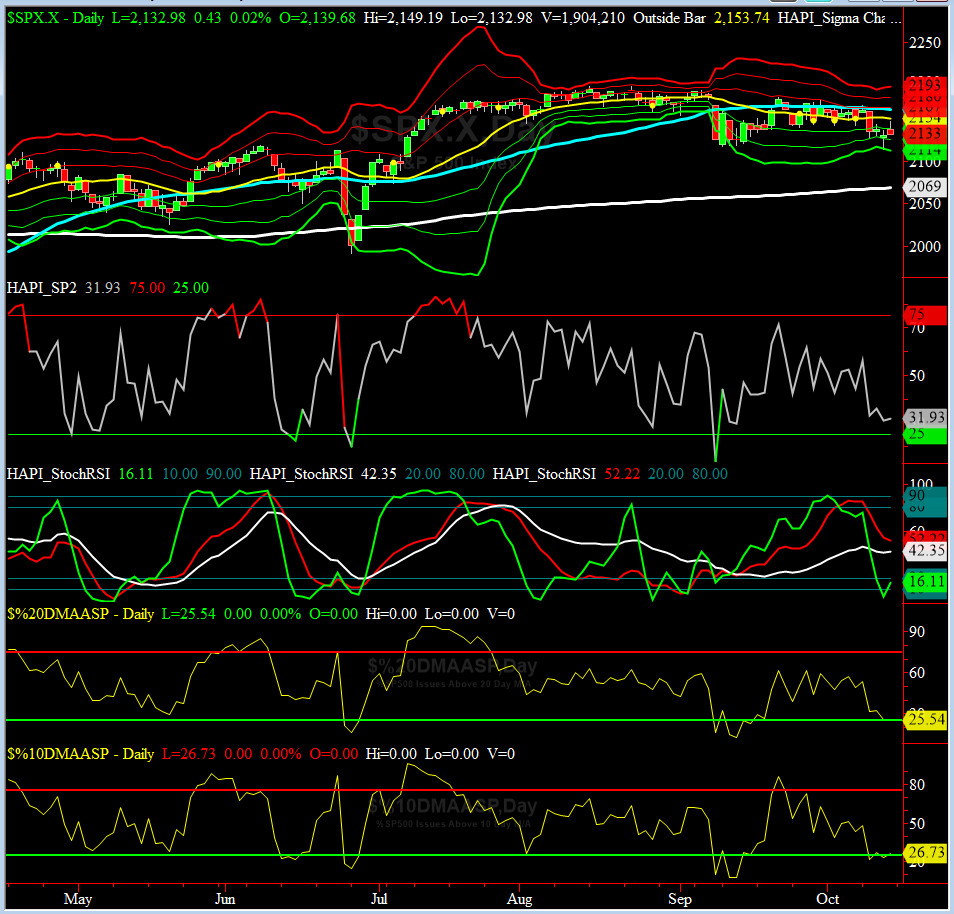
HA_SP2 Chart
HA_SP2 = 31.9 (Buy signal <= 25, Sell Signal >= 75)
This indicator is fast approaching its oversold zone.

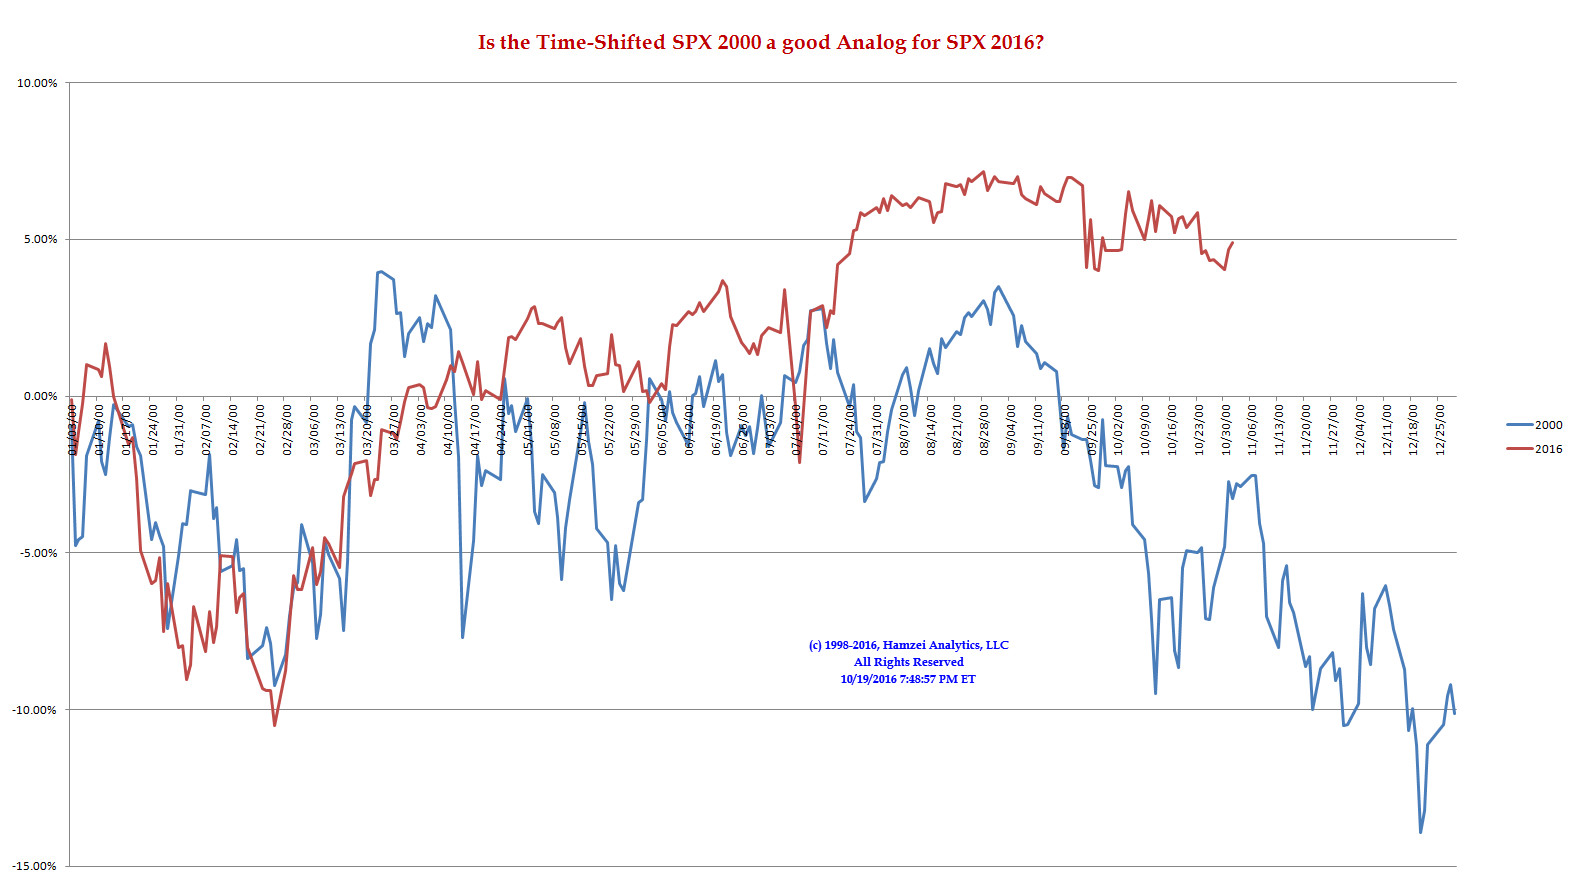
SPX 2000 Analog for SPX 2016
The other shoe will drop, soon we presume, but what is the catalyst? General Elections Results? Russia Adventurism, China Slow down, North Korean missile tests, Middle East Powder Keg, US Dollar or Crude Oil?
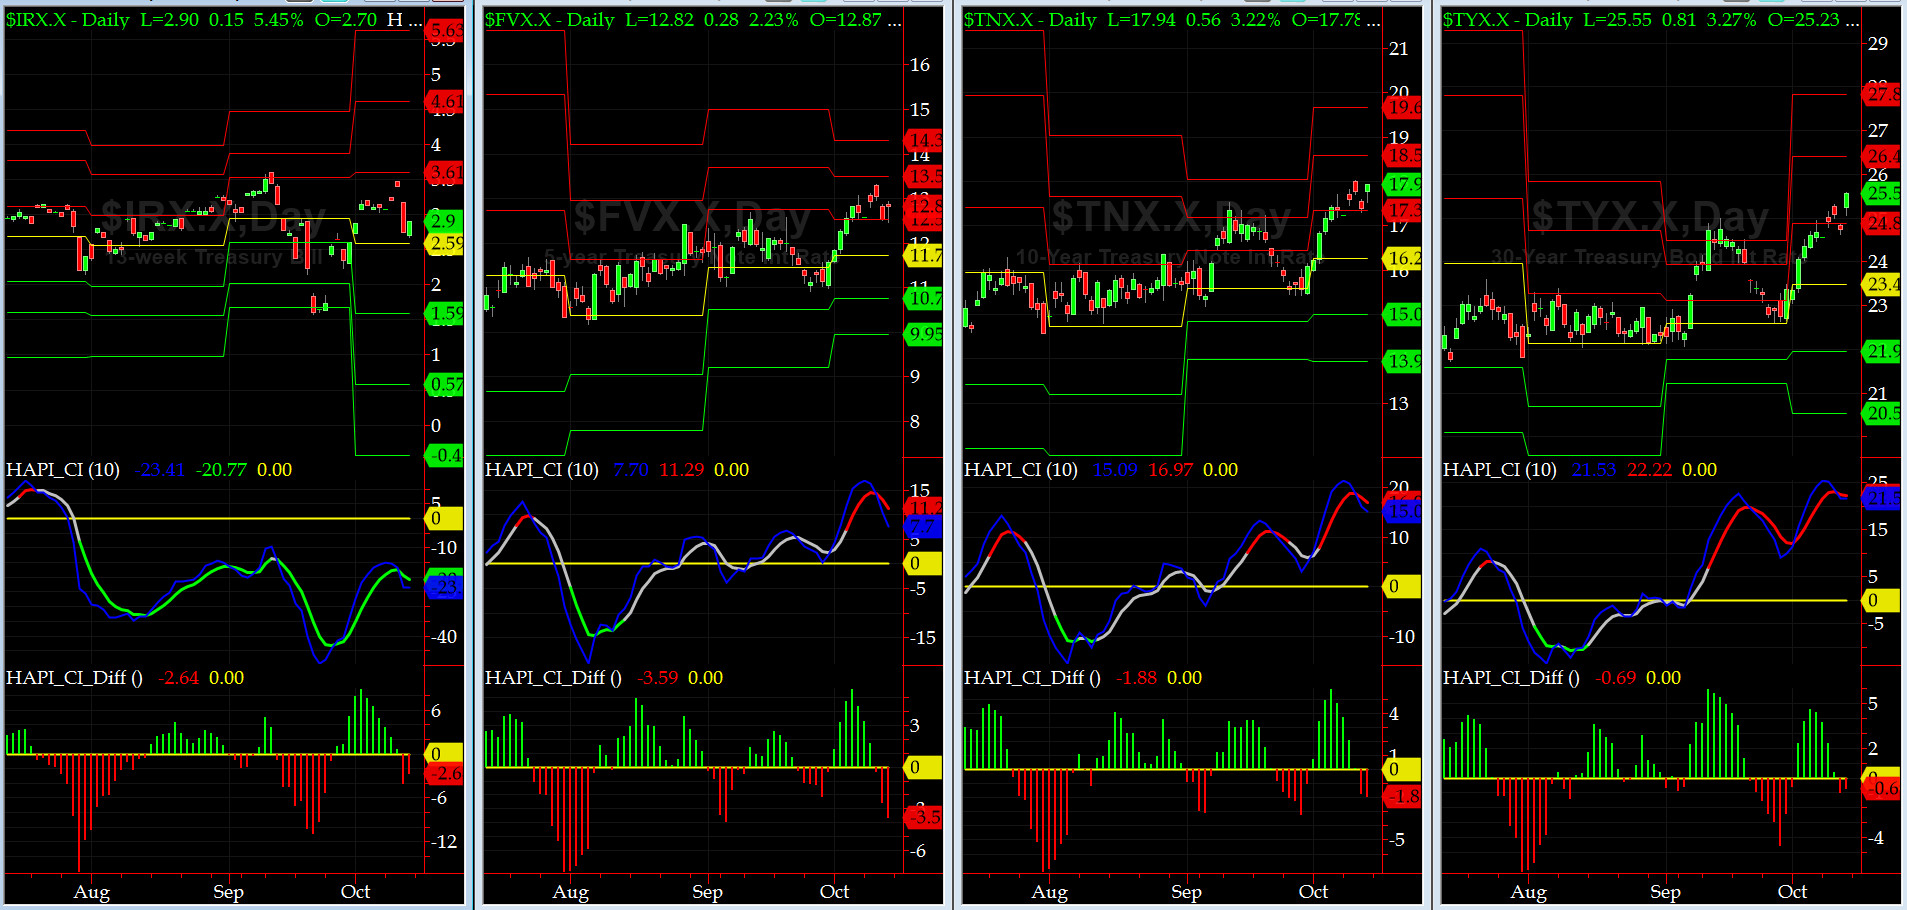
US Treasury T-Notes & T-Bonds Yields Chart
The long end keeps rising. December rate hike is pretty much a given now although futures market implies the odds of about 65% for a December hike.
Fari Hamzei
|


 Proactive Market Timing