|
Saturday, October 29, 2016, 1815ET
Market Timing Charts, Analysis & Commentary for Issue #165
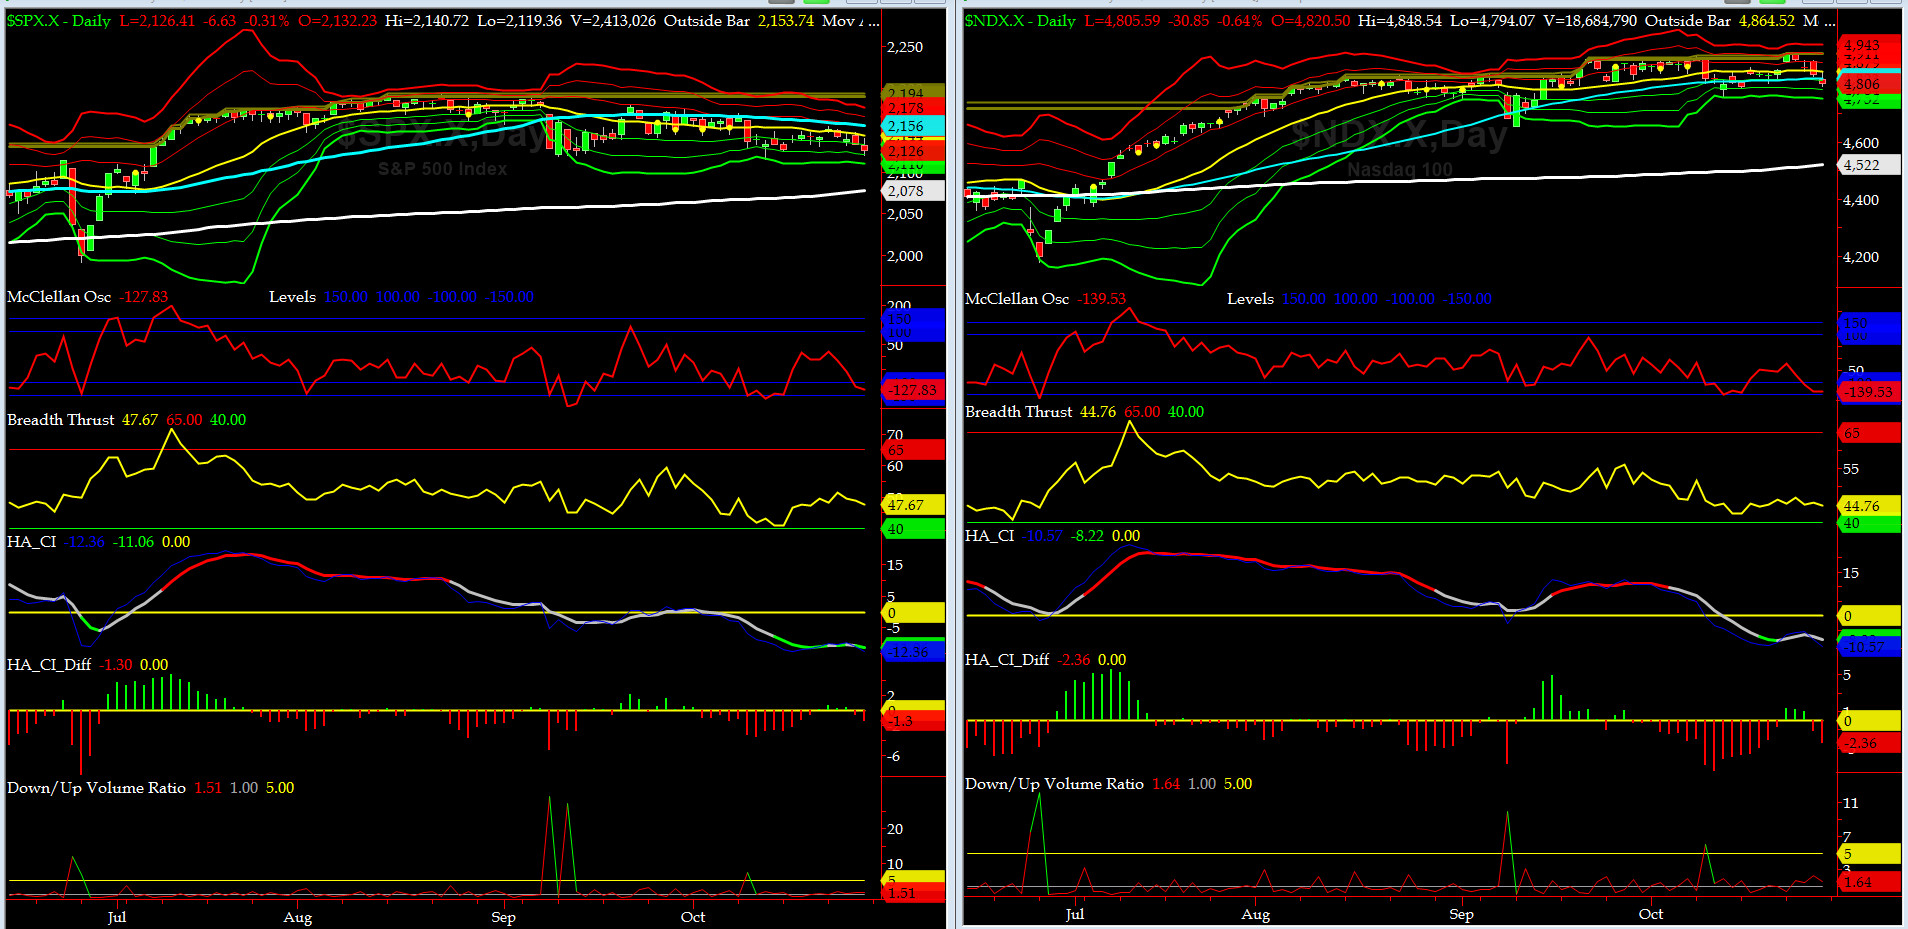
Timer Charts of S&P-500 Cash Index (SPX) + NASDAQ-100 Cash Index (NDX)
Most recent S&P-500 Cash Index (SPX): 2126.41 down -14.75 (down -0.69%) for the week ending on Friday, October 28th, 2016, which closed just above its -2 sigma.
SPX ALL TIME INTRADAY HIGH = 2193.81 (reached on Monday, August 15, 2016)
SPX ALL TIME CLOSING HIGH = 2190.15 (reached on Monday, August 15, 2016)
Current DAILY +2 Sigma SPX = 2166 with WEEKLY +2 Sigma = 2222
Current DAILY 0 Sigma (20 day MA) SPX = 2144 with WEEKLY 0 Sigma = 2145
Current DAILY -2 Sigma SPX = 2121 with WEEKLY -2 Sigma = 2069
NYSE McClellan Oscillator = -128 (-150 is start of the O/S area; around -275 to -300 area or lower, we go into the �launch-pad� mode, over +150, we are in O/B area)
NYSE Breadth Thrust = 47.7 (40 is considered as oversold and 65 as overbought)
Disappointing tech earnings, compounded with FBI's decision to reopen the investigation into Billary45 emails, put further selling pressure on stocks and pushed indices lower this past week.
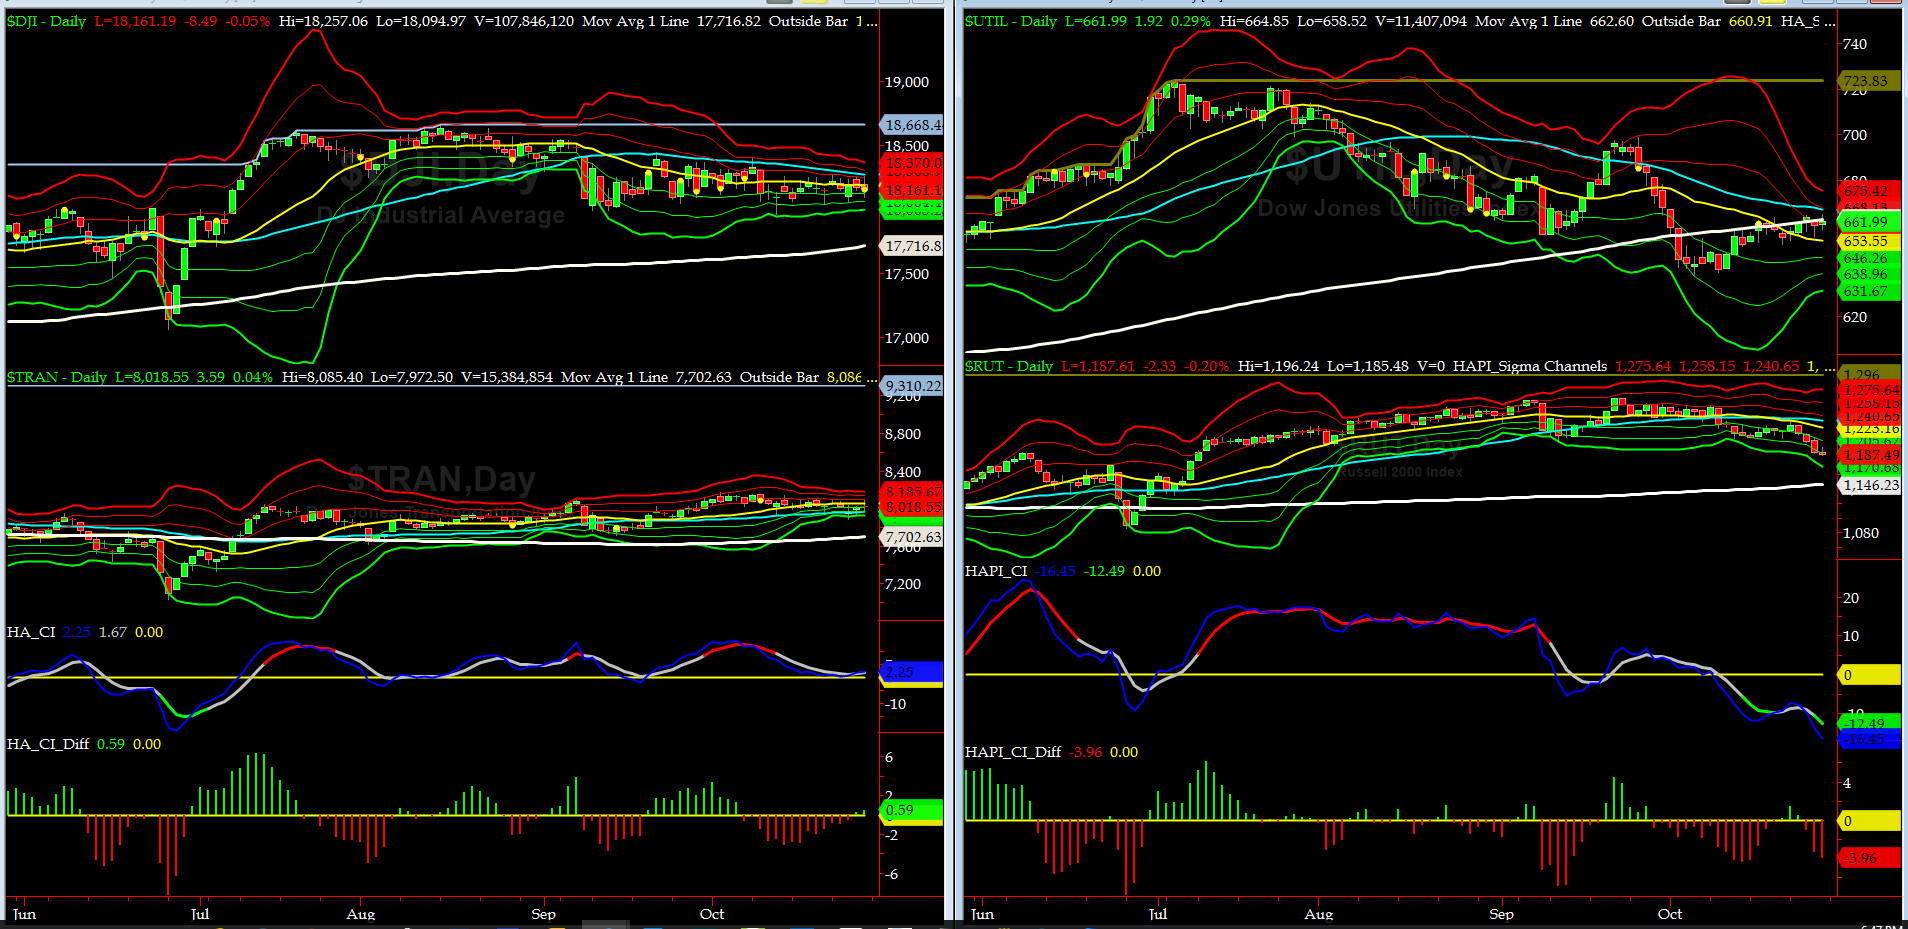
Canaries [in the Coal Mine] Chart for DJ TRAN & RUT Indices
200-Day MA DJ TRAN = 7702 or 4.1% below DJ TRAN (max observed in last 5 yrs = 20.2%, min = -20.3%)
200-Day MA RUT = 1146 or 3.6% below RUT (max observed in last 5 yrs = 21.3%, min = -22.6%)
DJ Transports (proxy for economic conditions 6 to 9 months hence) had another subdued week.
Russell 2000 small caps (proxy for Risk ON/OFF) came under aggressive selling pressure this past week, signaling RISK is OFF for the time being.
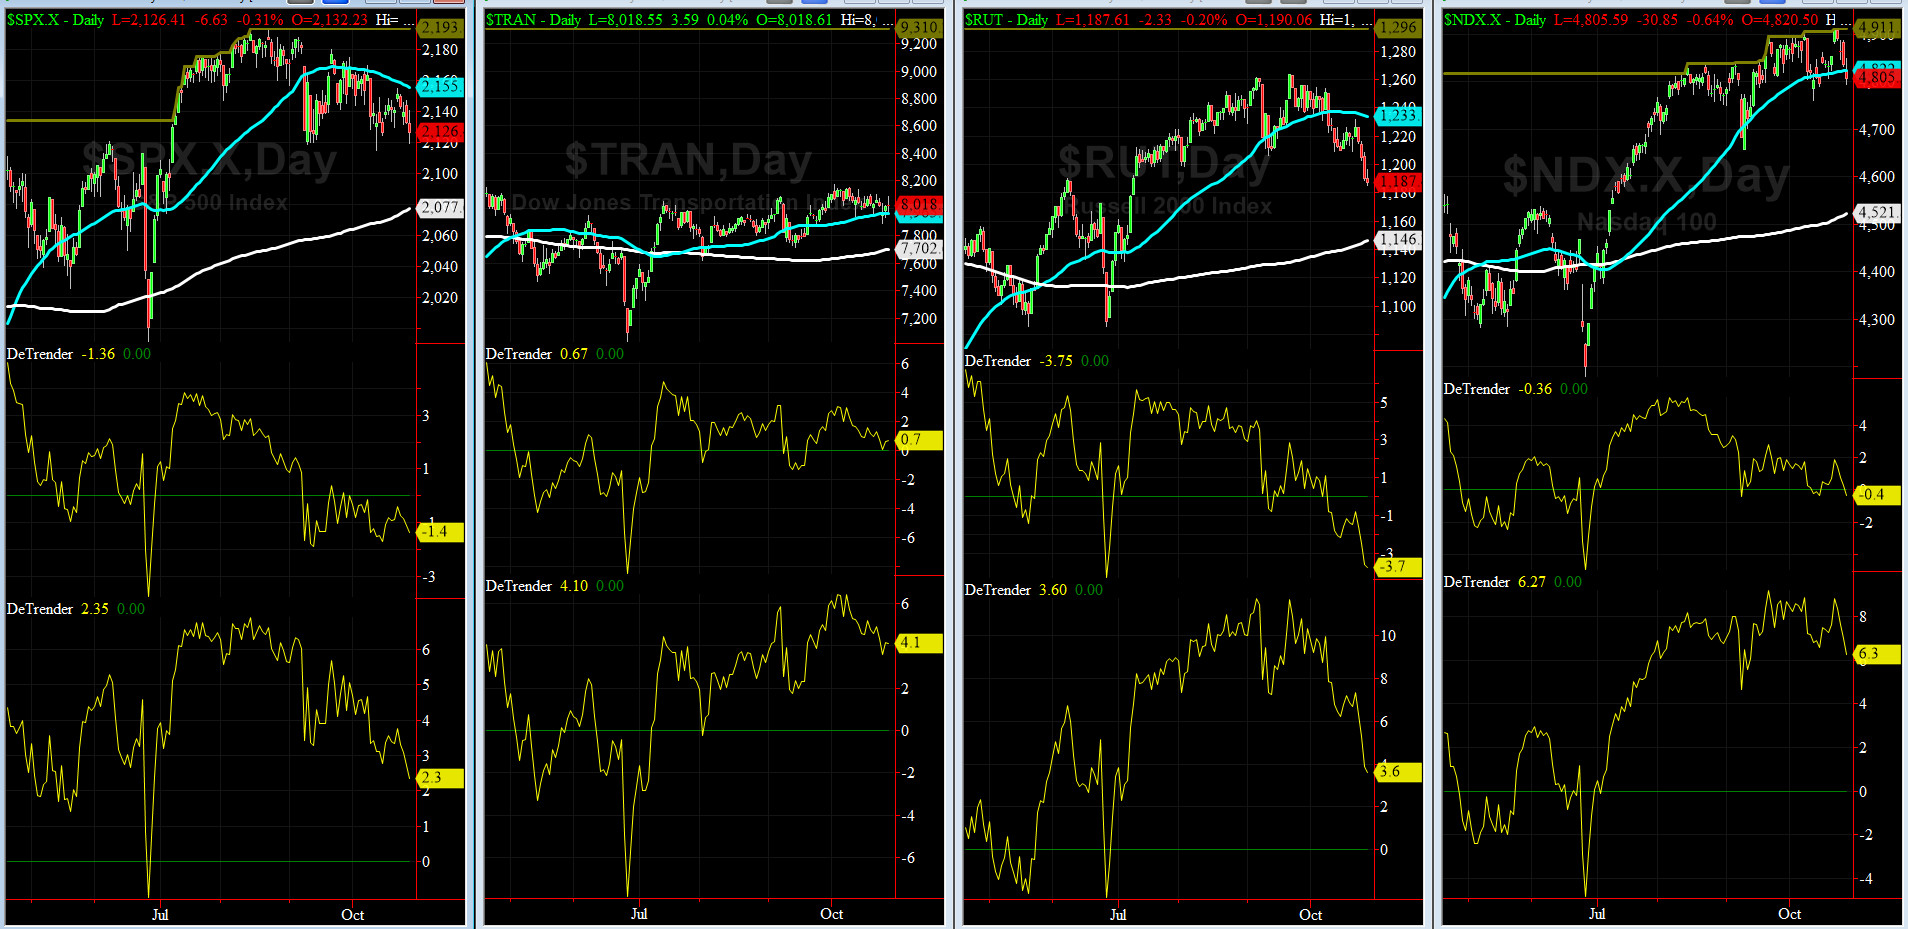
DeTrenders Charts for SPX, NDX, TRAN & RUT Indices
50-Day MA SPX = 2160 or 0.9 above SPX closed on Friday (max observed in last 5 yrs = +8.6%, min = -9.3%)
200-Day MA SPX = 2072 or 3.3% below SPX (max observed in last 5 yrs = 15.2%, min = -14%)
Currently, only 3 of our 8 De Trenders are negative. The De Trenders for DJ TRAN & RUT will continue to be harbingers of future price behavior in broad indices.

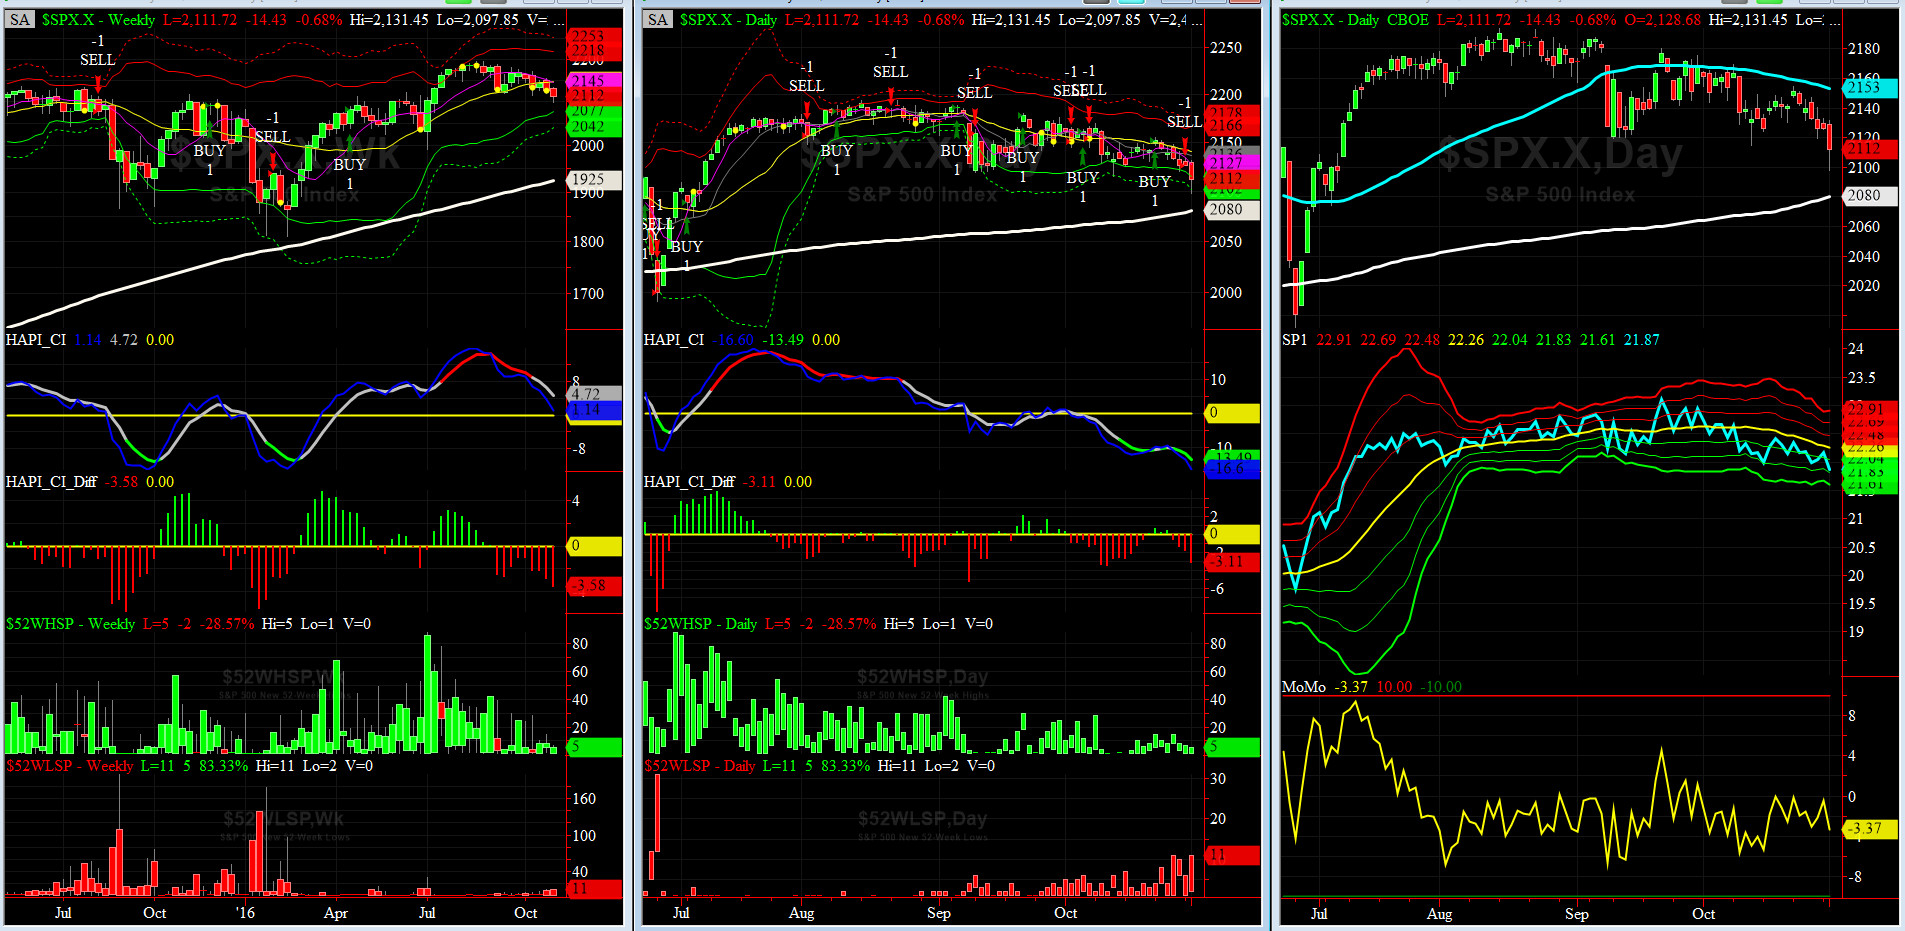
HA_SP1_Momo Chart
WEEKLY Timing Model = on a BUY Signal since Friday 4/15/16 CLOSE at 2081
DAILY Timing Model = on a BUY Signal since Monday 10/24/16 CLOSE at 2151
Max SPX 52wk-highs reading last week = 15 (over 120-140, the local maxima is in)
Max SPX 52wk-Lows reading last week = 11 (over 40-60, the local minima is in)
HA_SP1 = at its -1 sigma channels
HA_Momo = -2.09 (reversals most likely occur above +10 or below -10)
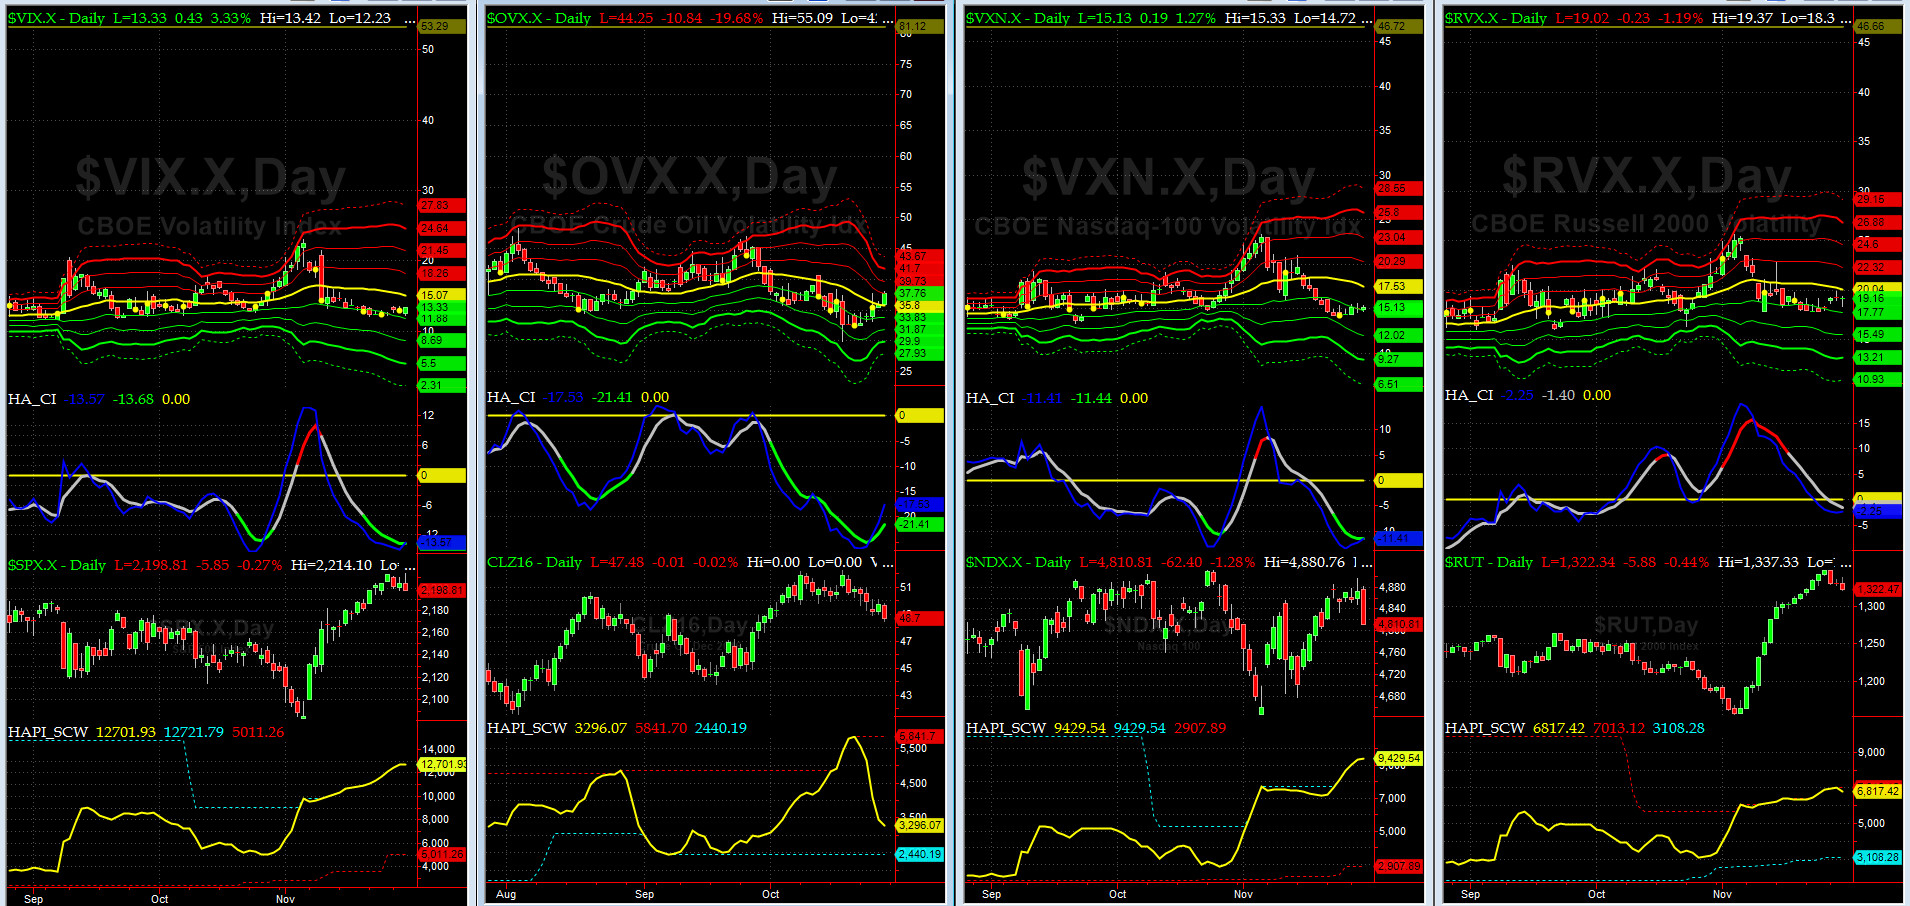
Vol of the Vols Chart
VIX is currently is at its +1 sigma level at 16.19 (remember it�s the VIX�s vol pattern (its sigma channels) that matters, and not the level of VIX itself (this is per Dr. Robert Whaley, a great mentor and the inventor of original VIX, now called VXO). VIX usually peaks around a test of its +4 sigma).
Another shock wave appears to be brewing as we are witnessing the calm before the storm. Fasten your harnesses (Navy parlance for seat belts).
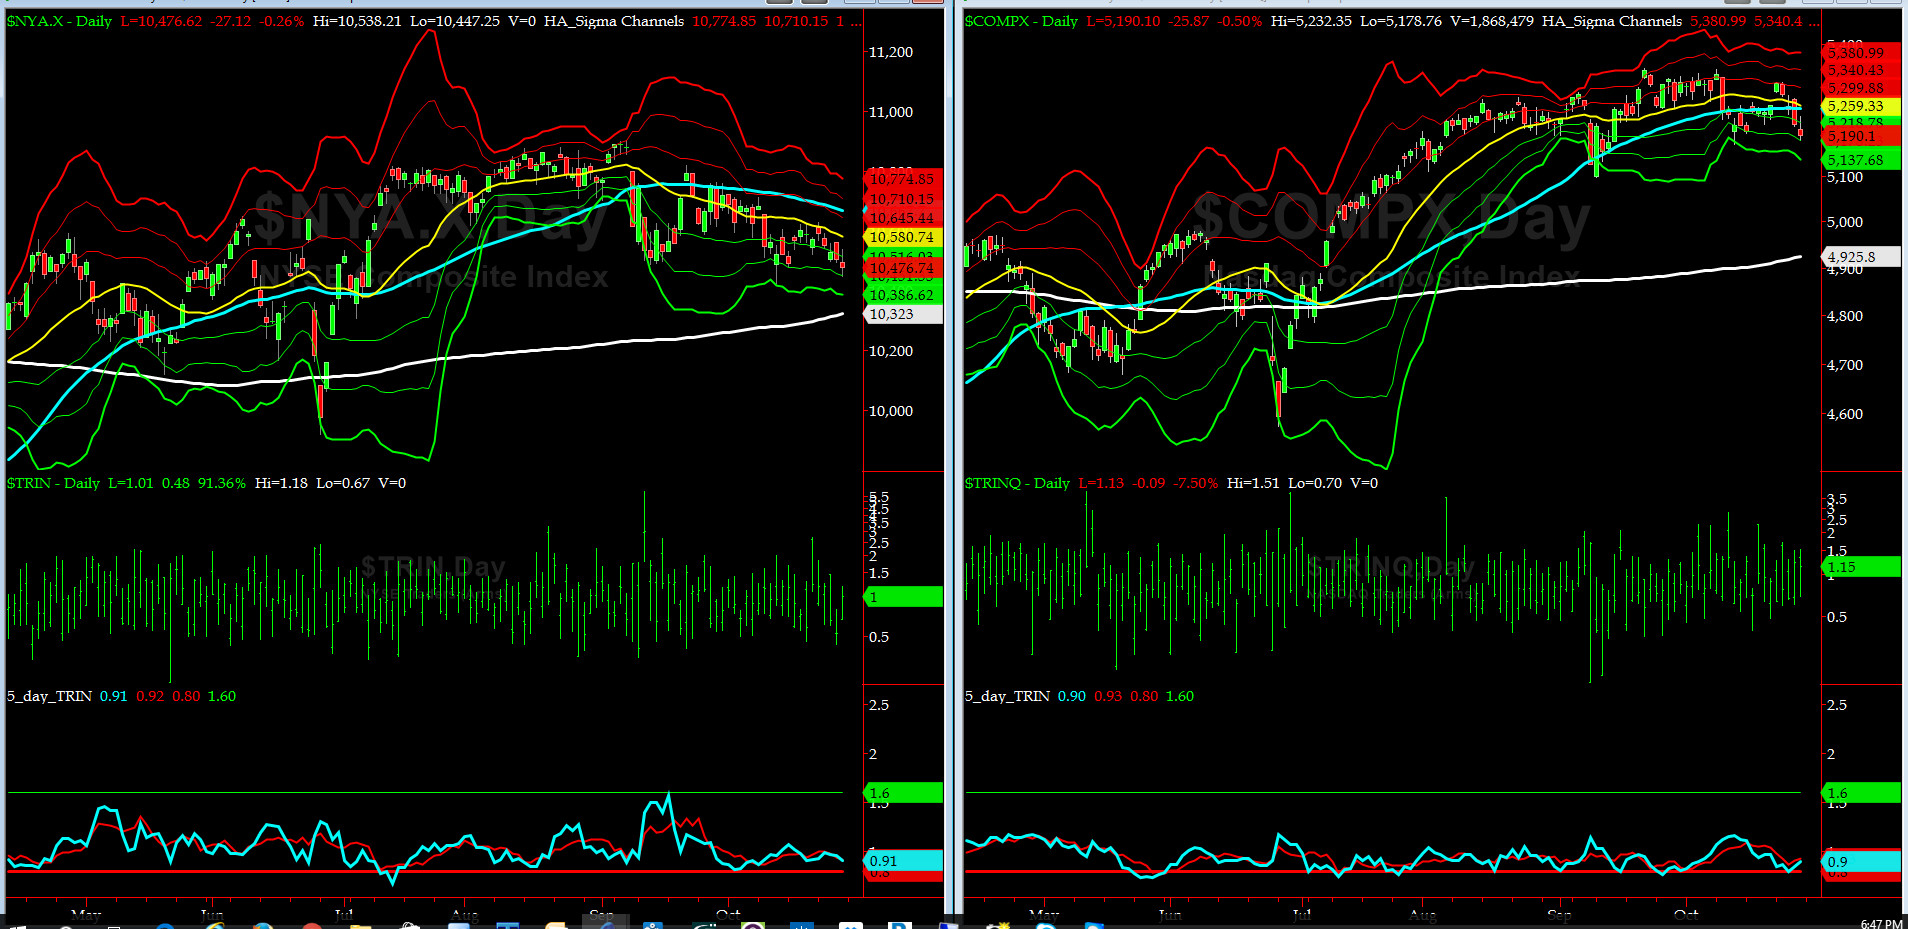
5-day TRIN & TRINQ Charts
NYSE & NASDAQ 5-day TRINs are again in NEUTRAL zone.
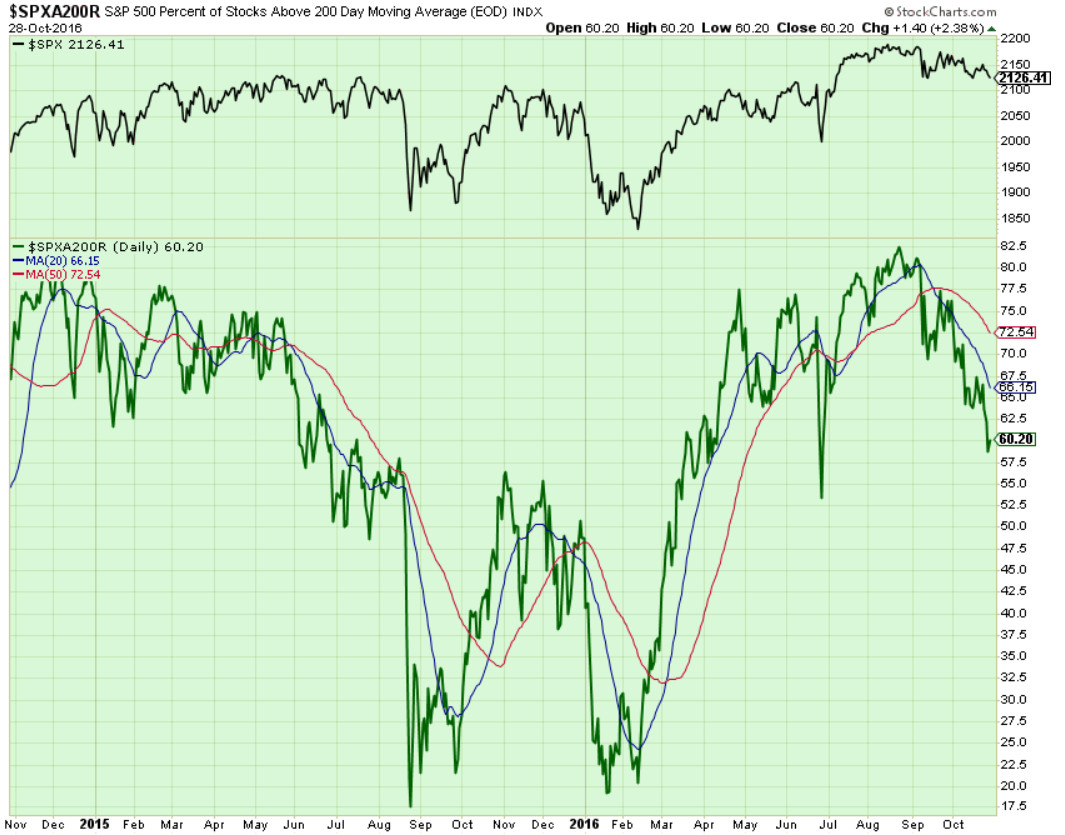
Components of SPX above their respective 200day MA Chart
This scoring indicator sank further to 60% on Friday (@Capt_tiko's target posted here last weekend). He is now looking for 55% to 50% zone.
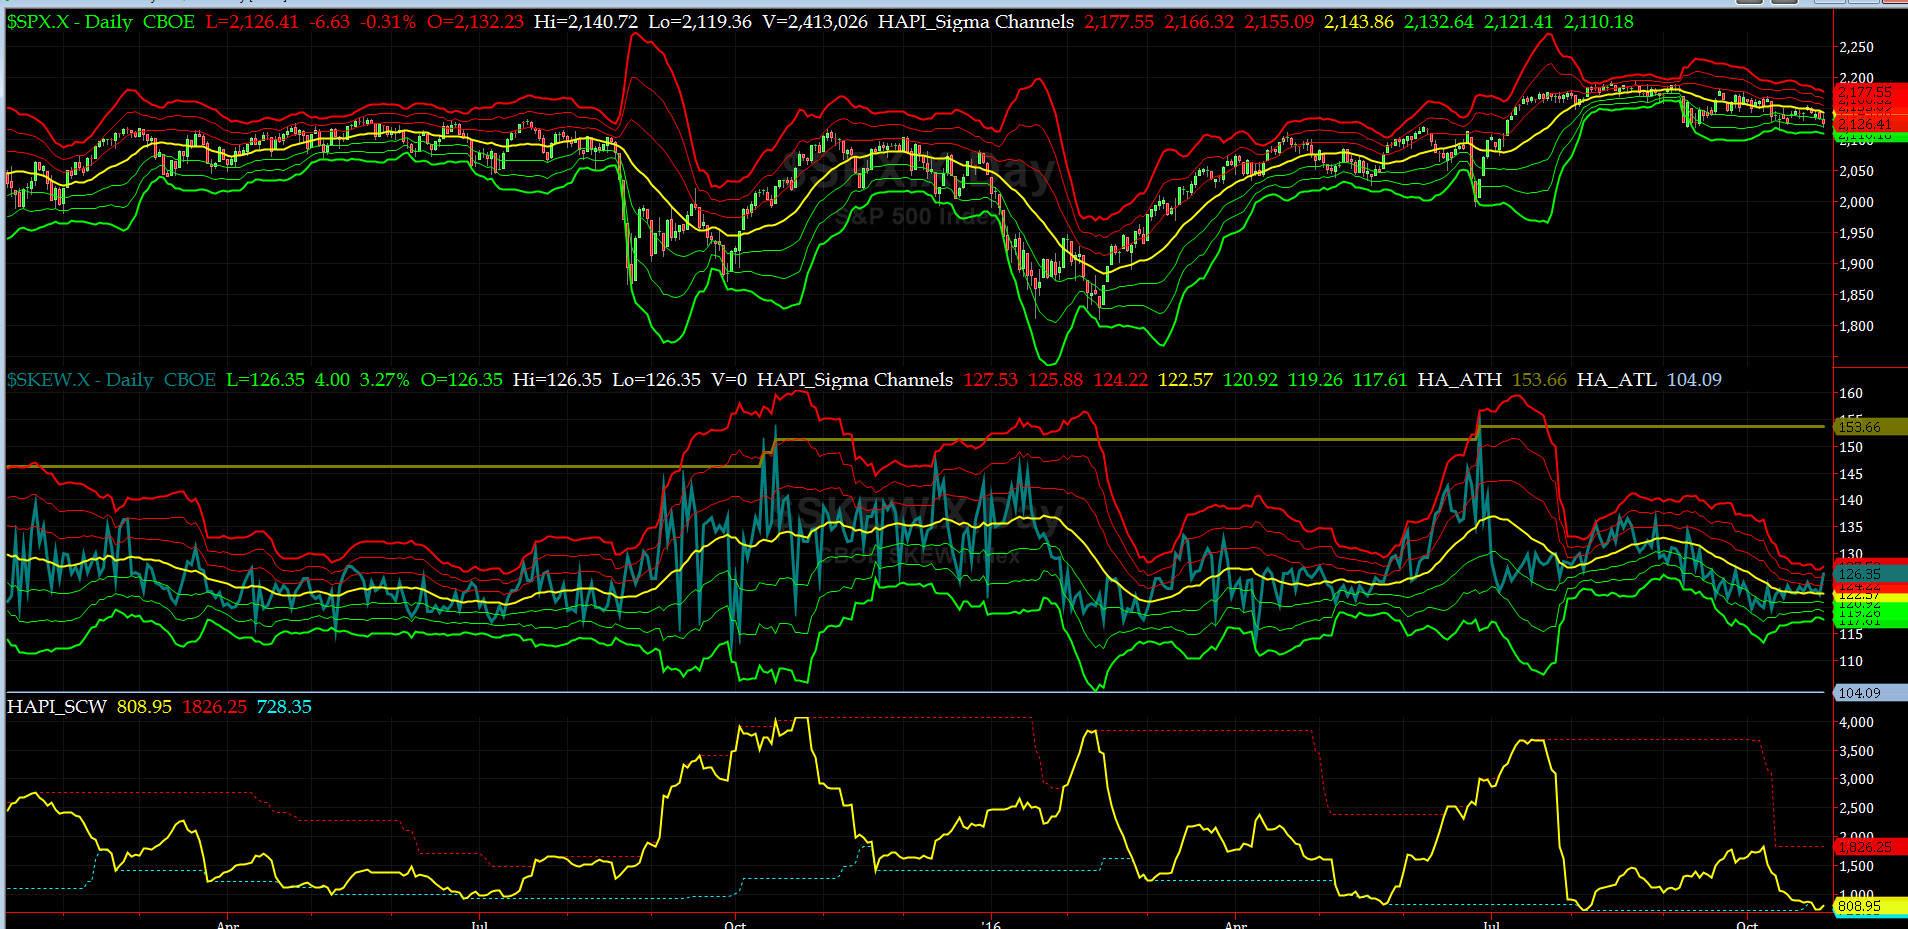
SPX SKEW (Tail Risk) Chart
SPX SKEW (Tail Risk) settled at 126 which is about its +2 sigma (normal = 120-125, range 100-150)
As we found out late Friday, All is NOT Quiet on the Eastern Front. @Capt_Tiko: Smart Money [and DEMs] are getting nervous.
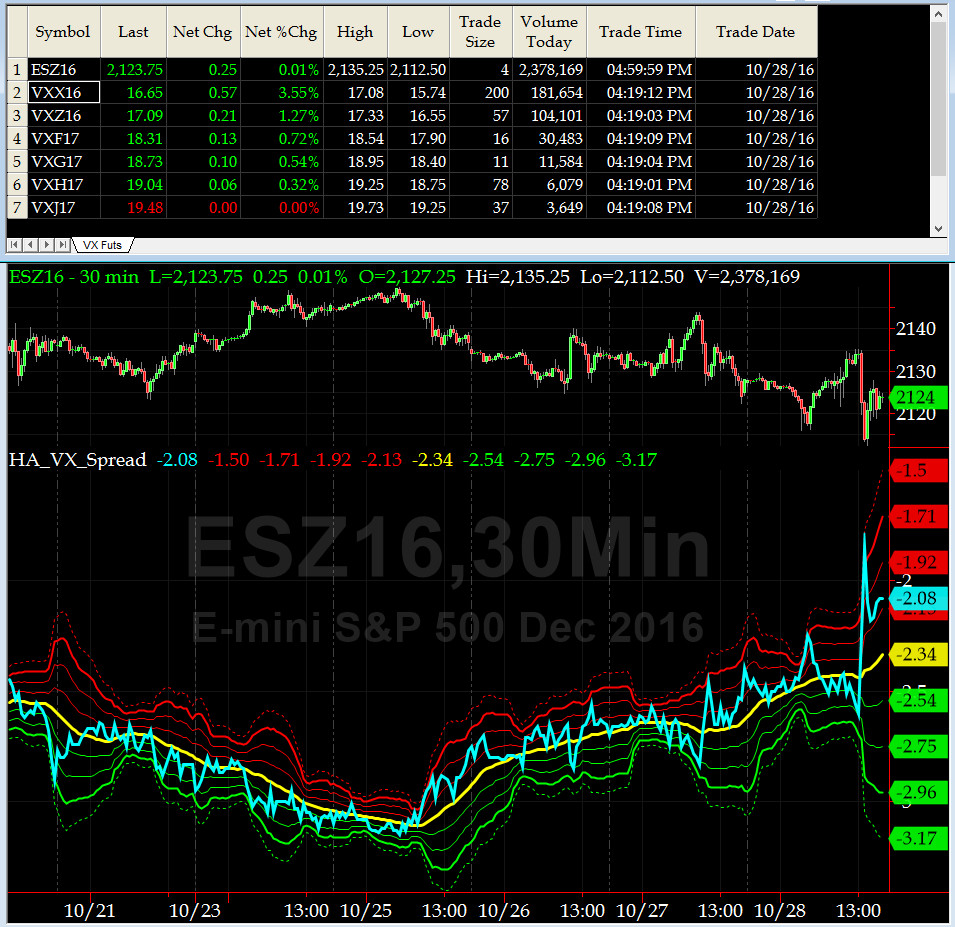
3-month VIX Futures Spread(VX) Chart
Our 3-month VIX Futures Spread (LONG NOV16 & SHORT FEB17) exploded up following the FBI Dir Comey announcement on Friday and then settled at -2.15, volatility market signaling potential for further downside price action.

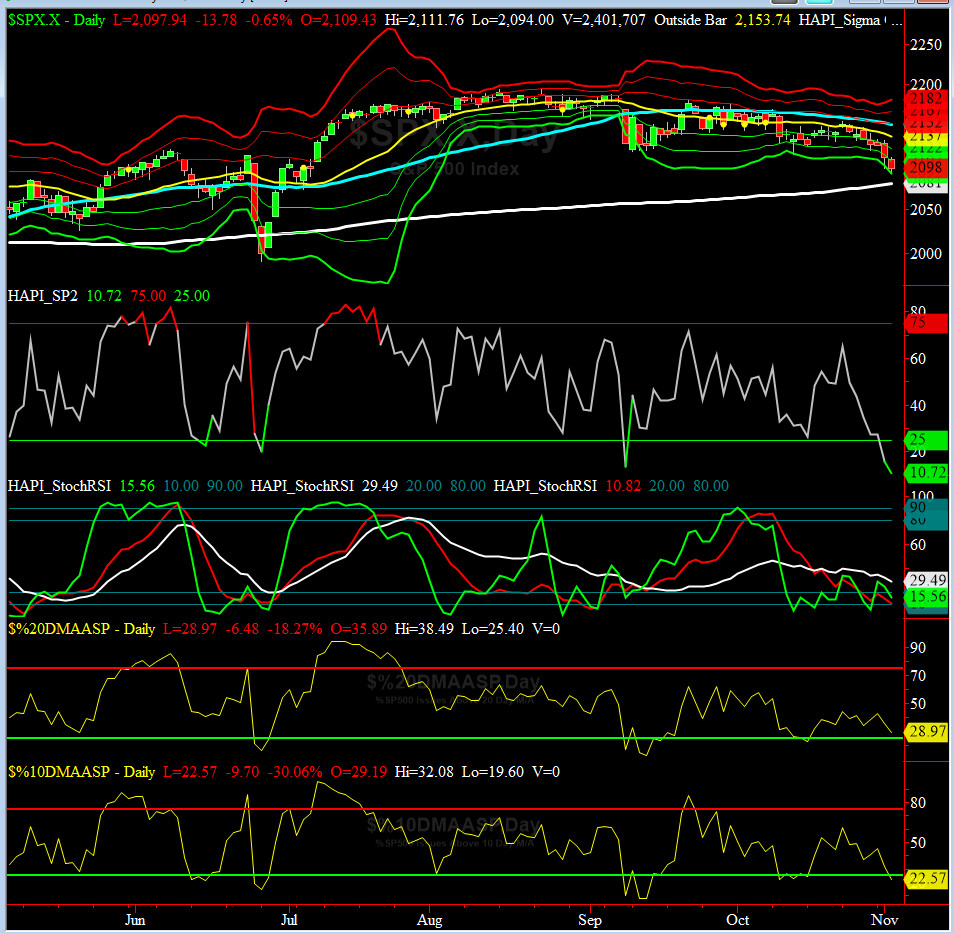
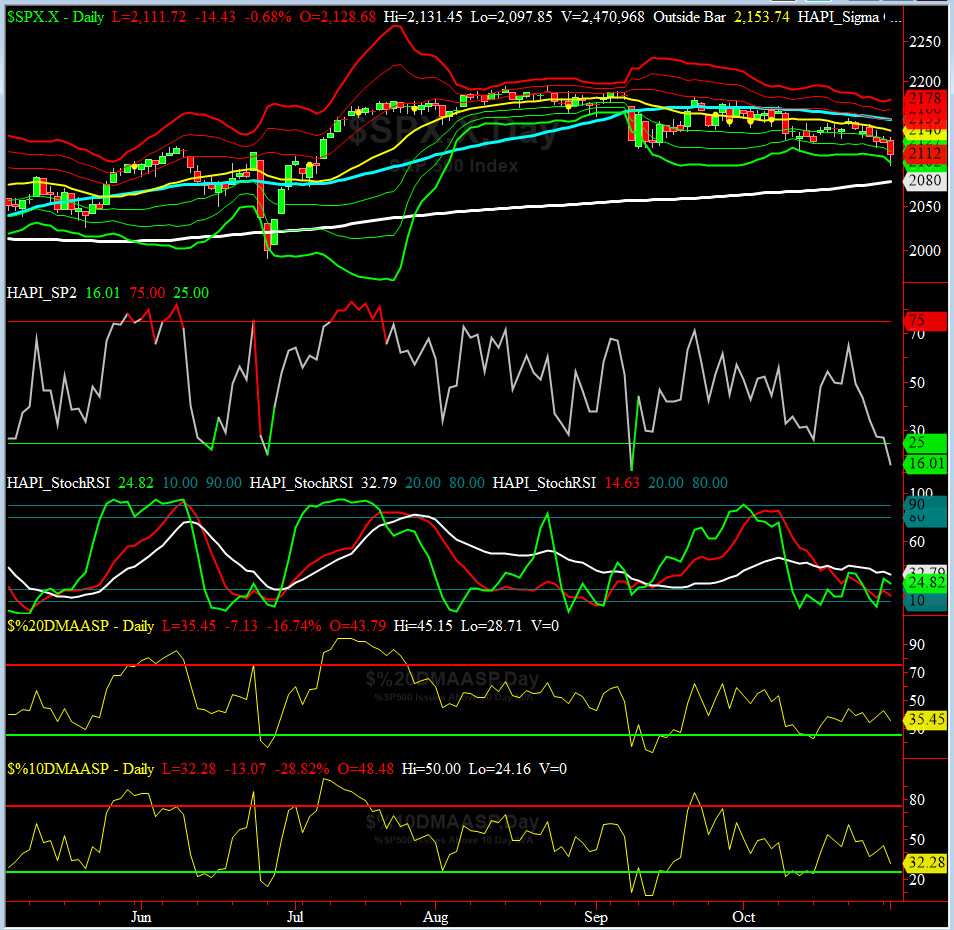
HA_SP2 Chart
HA_SP2 = 27 (Buy signal <= 25, Sell Signal >= 75)
This indicator is about to enter oversold zone.

SPX 2000 Analog for SPX 2016
The $64K question is not a matter of IF, but WHEN, the other shoe will drop. We think we are a lot closer to witness that soon, and of course, Maury is salivating at the thought of much lower prices for entry, even hoping to find some bargains BELOW COST. LOL.

US Treasury T-Notes & T-Bonds Yields Chart
The YTMs on Treasury Complex are moving up again, specially in the long end.
Fari Hamzei
|


 Proactive Market Timing