|
Saturday, November 26, 2016, 2330ET
Market Timing Charts, Analysis & Commentary for Issue #169
Timer Charts of S&P-500 Cash Index (SPX) + NASDAQ-100 Cash Index (NDX)
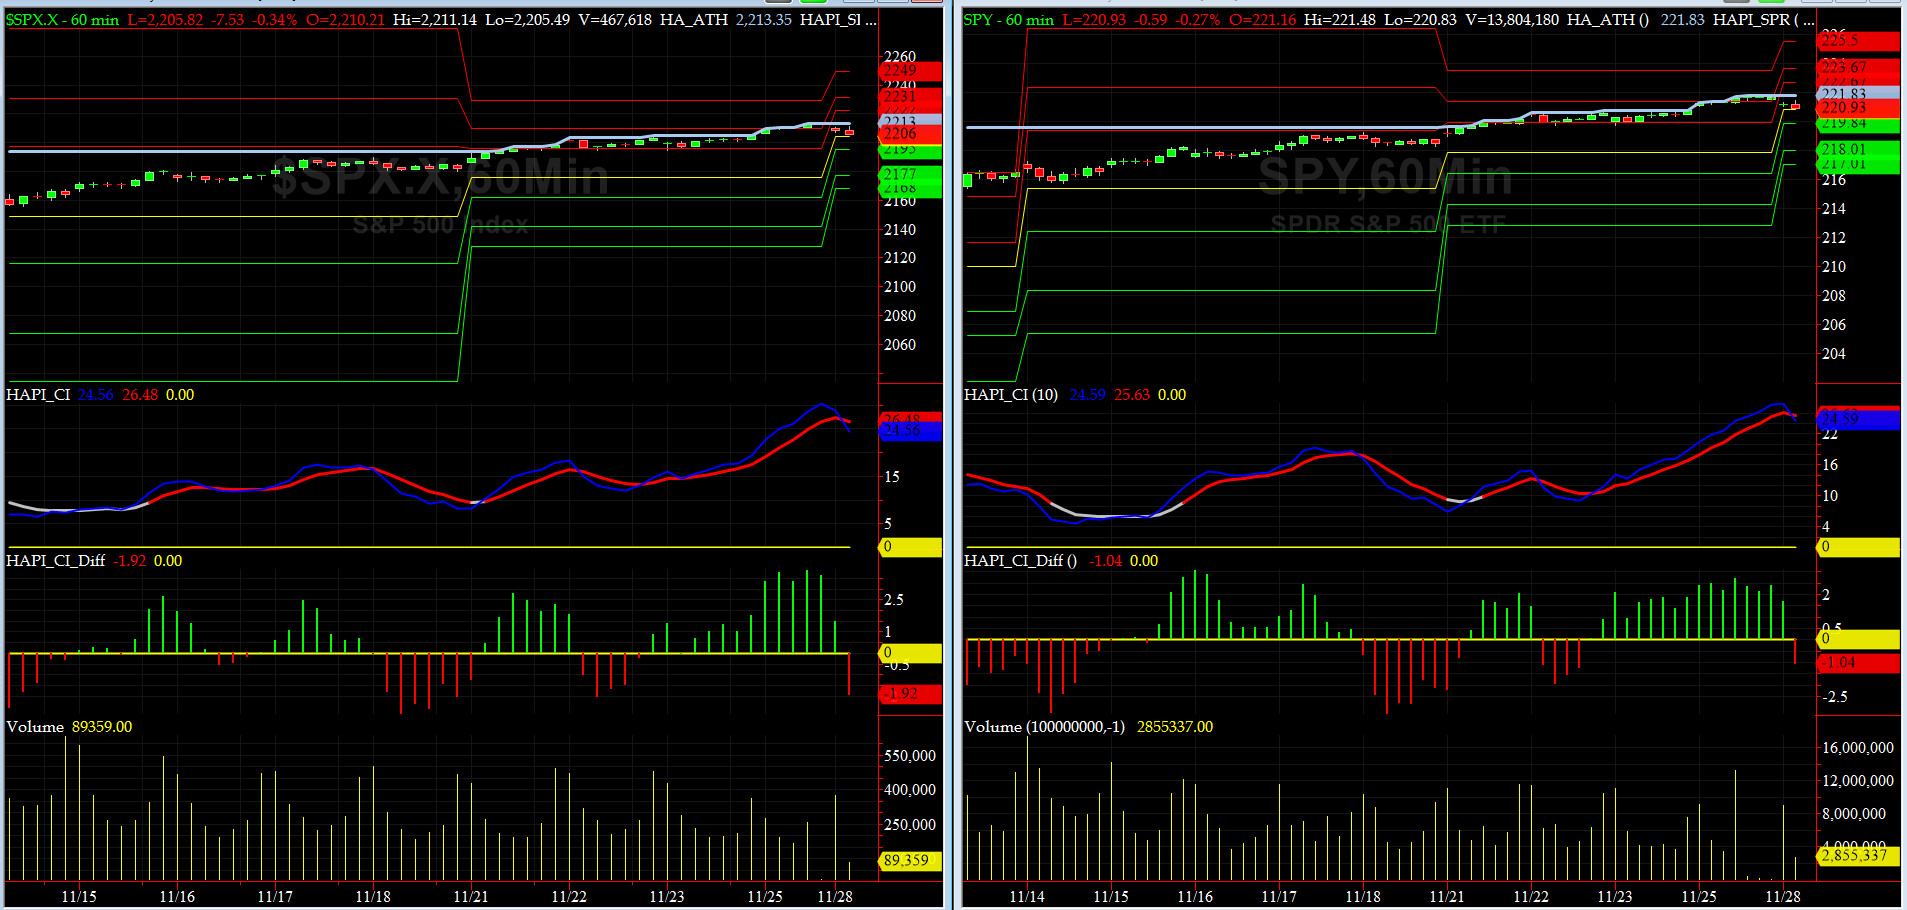
Most recent S&P-500 Cash Index (SPX): 2213.35 up +31.45 (up +1.44%) for the week ending Friday, November 26th, 2016, which closed again at about its +1.5 sigma.
SPX ALL TIME INTRADAY HIGH = 2213.35 (reached on Friday, November 25, 2016)
SPX ALL TIME CLOSING HIGH = 2213.35 (reached on Friday, November 25, 2016)
Current DAILY +2 Sigma SPX = 2203 with WEEKLY +2 Sigma = 2207
Current DAILY 0 Sigma (20 day MA) SPX = 2143 with WEEKLY 0 Sigma = 2156
Current DAILY -2 Sigma SPX = 2083 with WEEKLY -2 Sigma = 2105
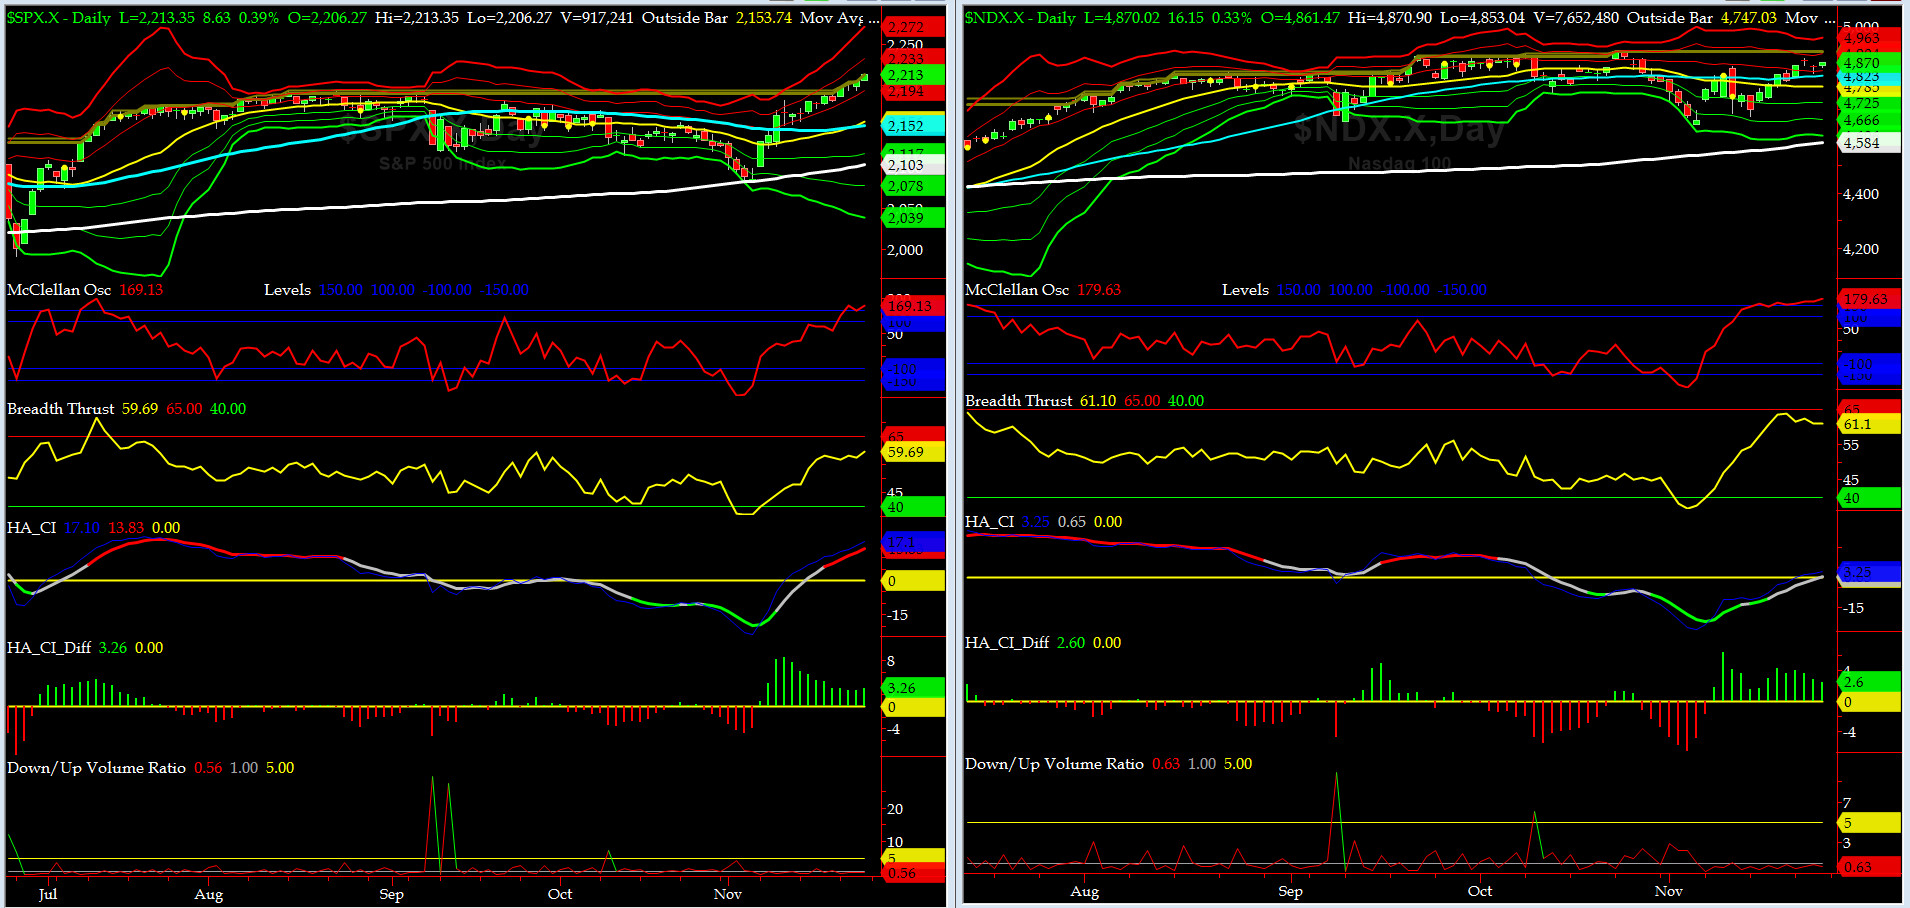
NYSE McClellan Oscillator = +169 (-150 is start of the O/S area; around -275 to -300 area or lower, we go into the �launch-pad� mode, over +150, we are in O/B area)
NYSE Breadth Thrust = 59.7 (40 is considered as oversold and 65 as overbought)
Ceteris paribus, we still plan to stay long SPX into next FOMC Meeting (Dec 13-14).
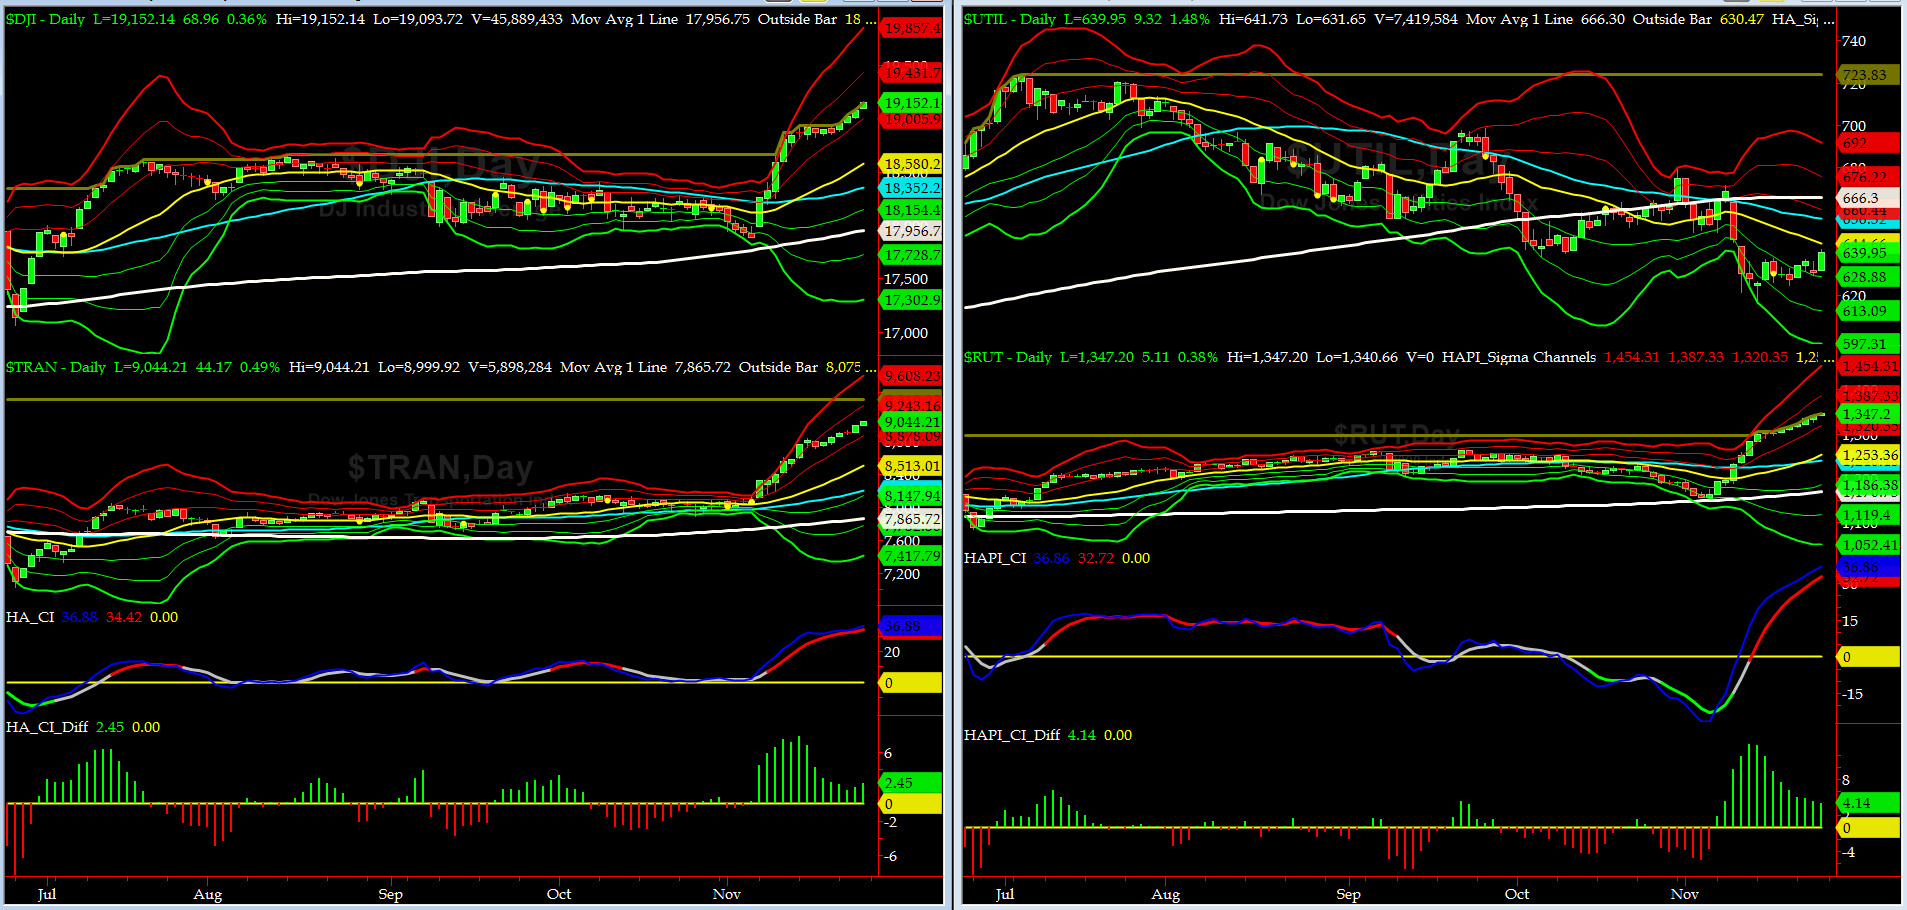
Canaries [in the Coal Mine] Chart for DJ TRAN & RUT Indices
200-Day MA DJ TRAN = 7865 or 15% below DJ TRAN (max observed in last 5 yrs = 20.2%, min = -20.3%)
200-Day MA RUT = 1170 or 15.1% below RUT (max observed in last 5 yrs = 21.3%, min = -22.6%)
DJ Transports (proxy for economic conditions 6 to 9 months hence) had another awesome week.
Russell 2000 small caps (proxy for Risk ON/OFF) had another tremendous week and rose by another 2.4%. RISK is definitely ON.
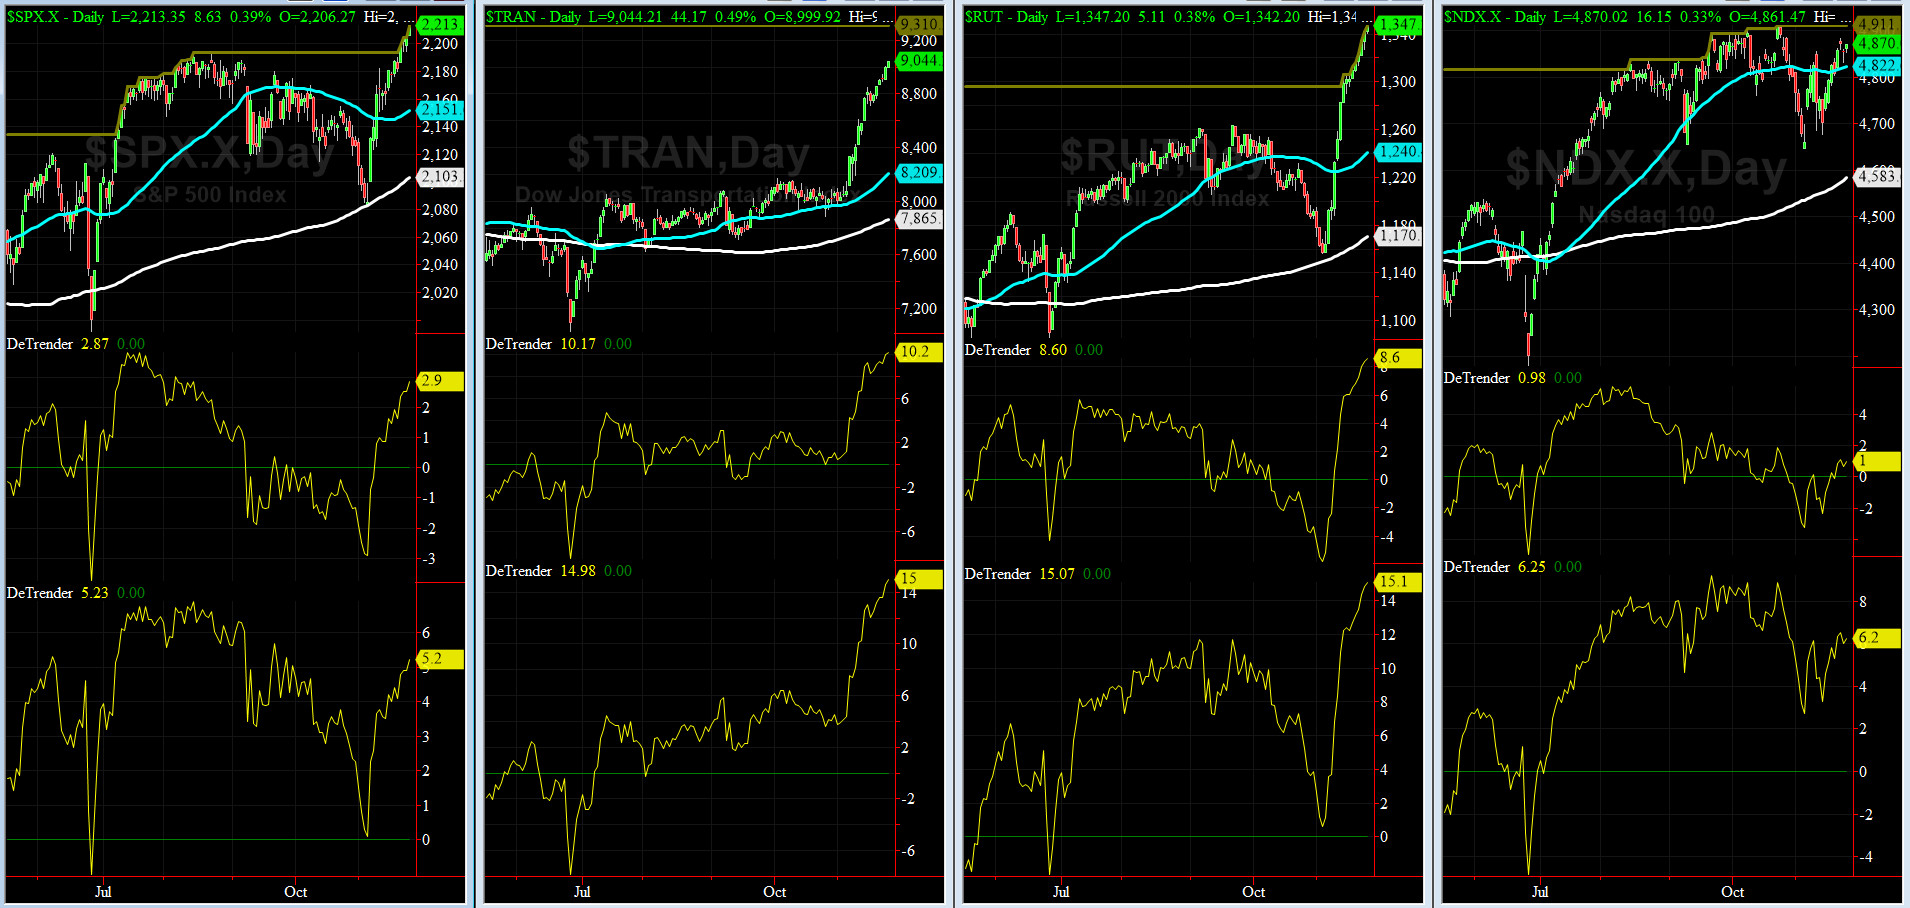
DeTrenders Charts for SPX, NDX, TRAN & RUT Indices
50-Day MA SPX = 2151 or 2.9 below SPX closed on Friday (max observed in last 5 yrs = +8.6%, min = -9.3%)
200-Day MA SPX = 2103 or 5.2% below SPX (max observed in last 5 yrs = 15.2%, min = -14%)
None of our 8 De Trenders are negative. The De Trenders for DJ TRAN & RUT will continue to be harbingers of future price behavior in broad indices.
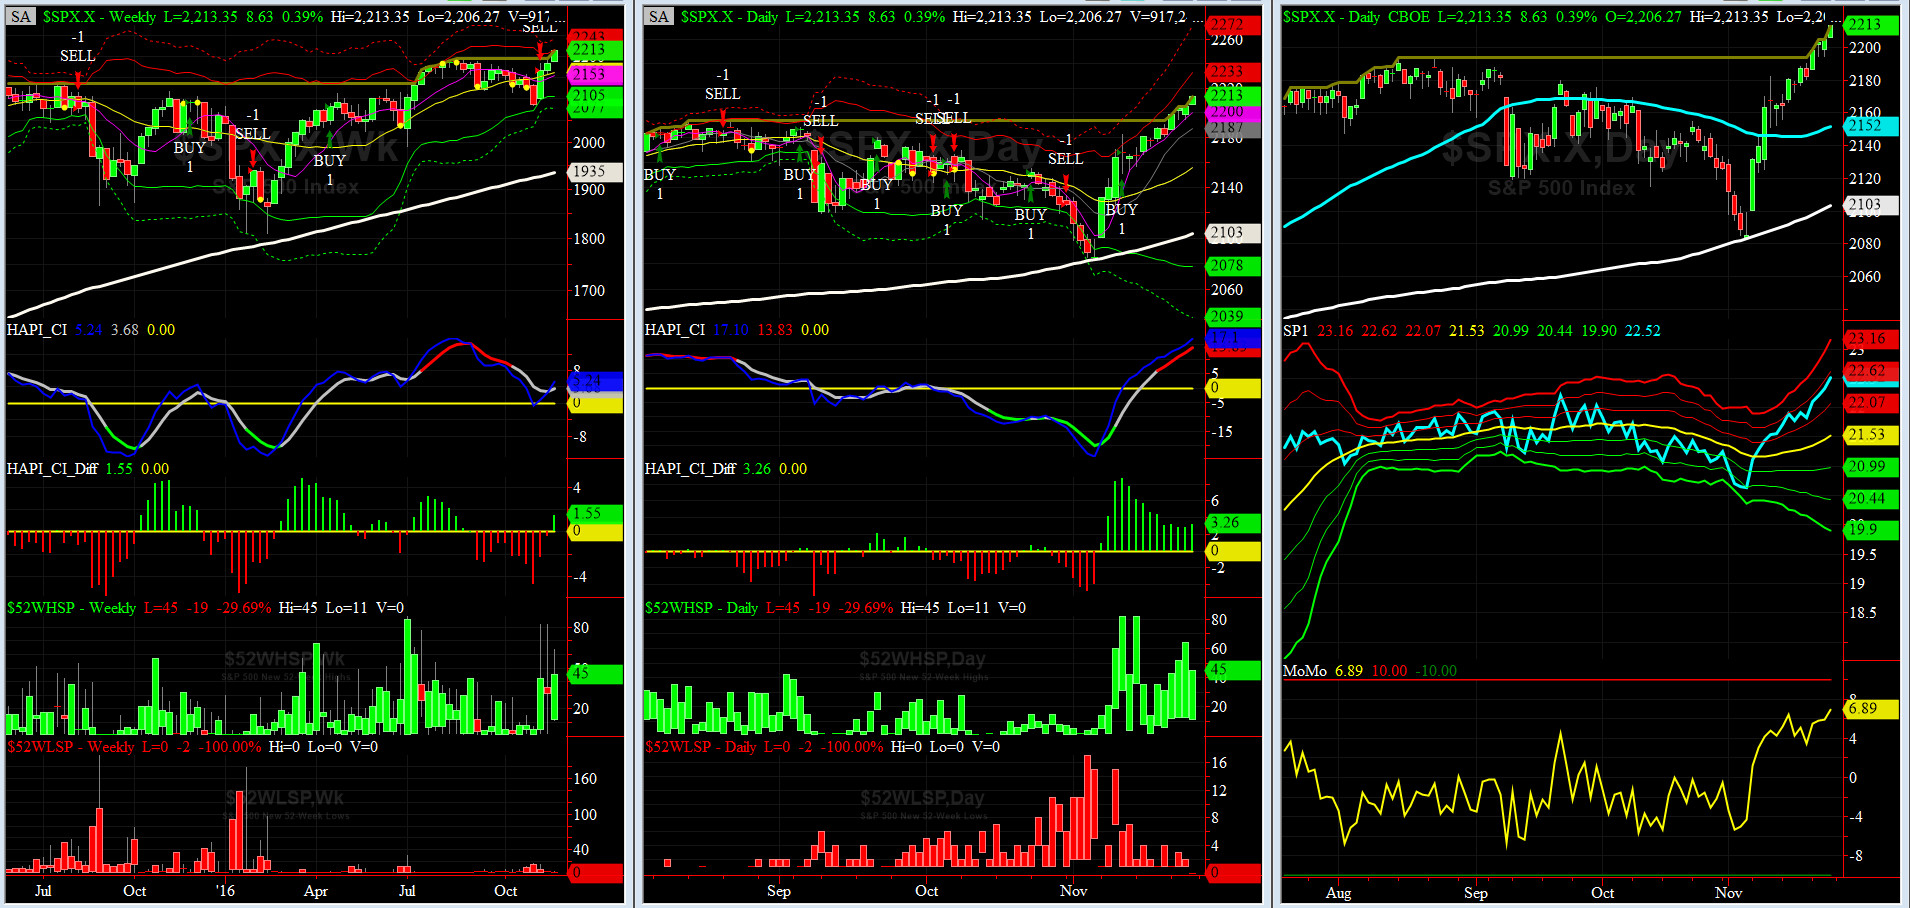
HA_SP1_Momo Chart
WEEKLY Timing Model = on a SELL Signal since Friday 11/11/16 CLOSE at 2164
DAILY Timing Model = on a BUY Signal since Thursday 11/10/16 CLOSE at 2167
Max SPX 52wk-highs reading last week = 64 (over 120-140, the local maxima is in)
Max SPX 52wk-Lows reading last week = 3 (over 40-60, the local minima is in)
HA_SP1 = very near its +2 sigma channels
HA_Momo = +6.9 (reversals most likely occur above +10 or below -10)

Vol of the Vols Chart
VIX is currently testing its -1 sigma level at 12.34 (remember it�s the VIX�s vol pattern (its sigma channels) that matters, and not the level of VIX itself (this is per Dr. Robert Whaley, a great mentor and the inventor of original VIX, now called VXO). VIX usually peaks around a test of its +4 sigma).
The current shock wave is over. Crude Oil Vol spiked this week.

5-day TRIN & TRINQ Charts
Both NYSE & NASDAQ 5-day TRINs are in NEUTRAL zones.

Components of SPX above their respective 200day MA Chart
This scoring indicator continued to rally and crossed 70%. Again, every night this past week, my XO, @Capt_Tiko, checked this indicator after his evening meal (#TunaPower). He now has his eyes set for 75% to 80% for the peak of current rally.
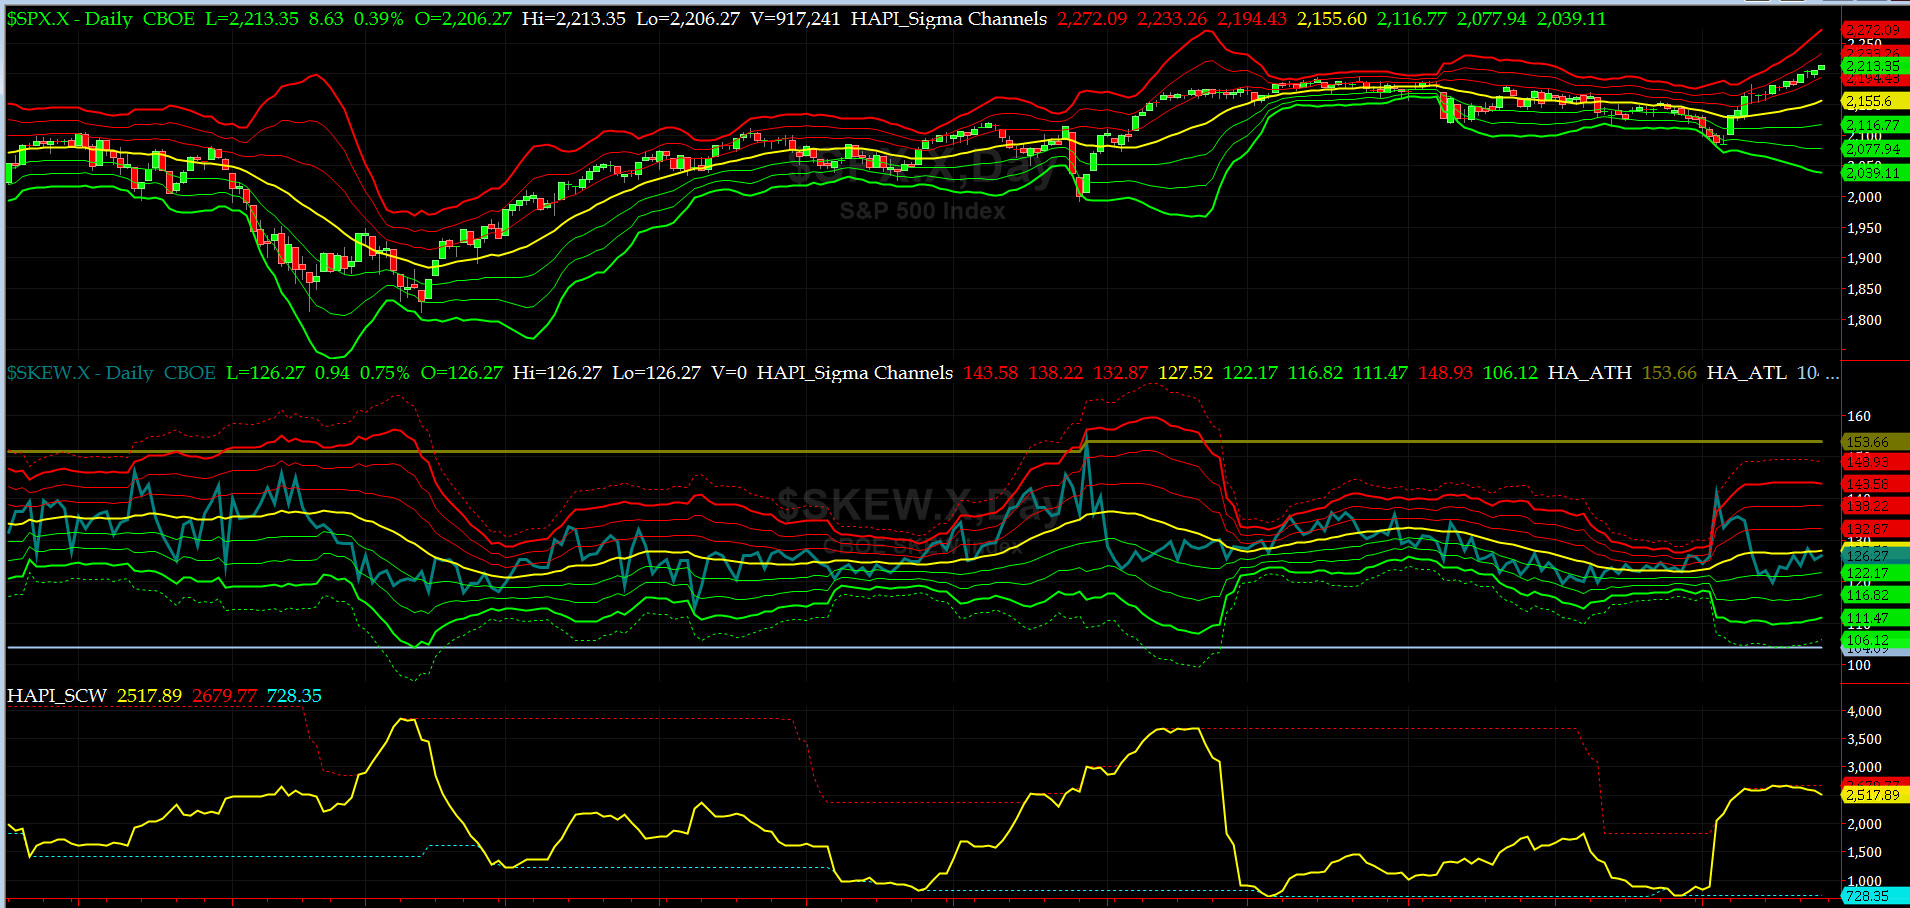
SPX SKEW (Tail Risk) Chart
Last week SPX SKEW (Tail Risk) first sank to its -1 sigma level and then rose to close at 126 this week, which is almost its zero sigma level (normal = 120-125, range 100-150).
All is quiet on the Eastern Front (WASH-BOS Elite Corridor).
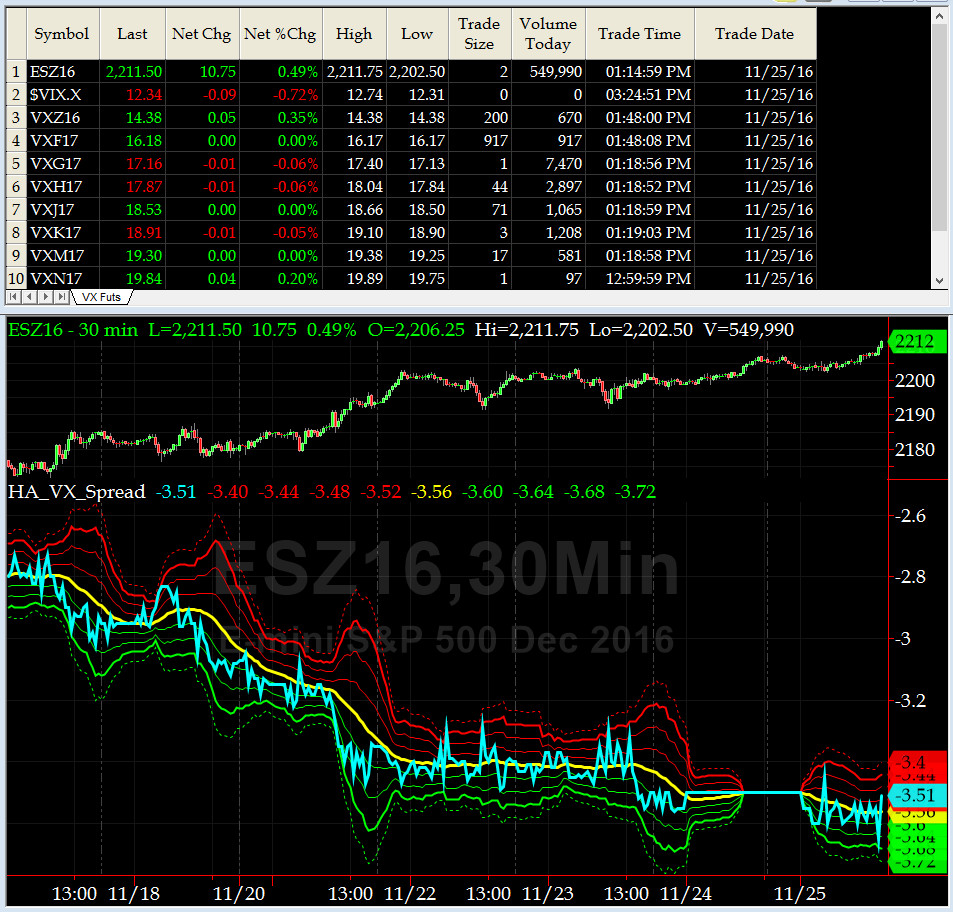
3-month VIX Futures Spread(VX) Chart
Our 3-month VIX Futures Spread (LONG DEC16 & SHORT MAR17) closed at -3.51 on Friday. This spread showed moderate pullback, as indices continued the grind higher.
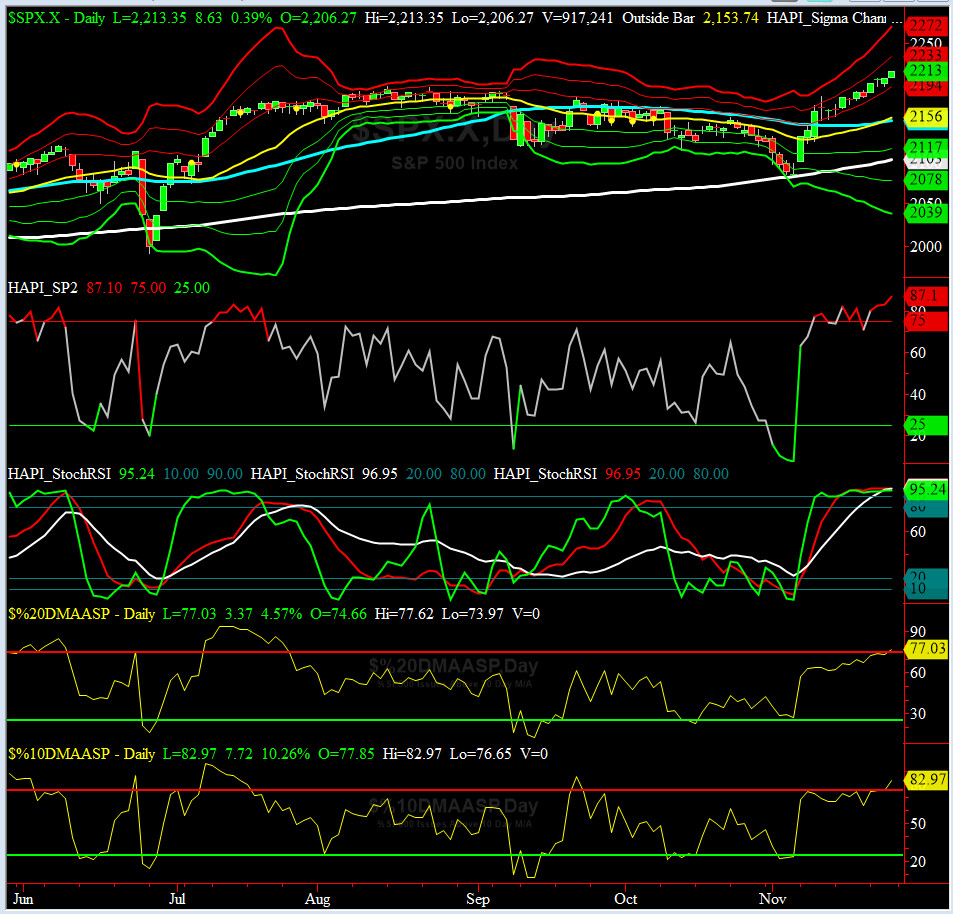
HA_SP2 Chart
HA_SP2 = 87.1 (Buy signal <= 25, Sell Signal >= 75)
This indicator is signalling extreme overbought reading now. Even @Capt_Tiko is getting somewhat apprehensive.
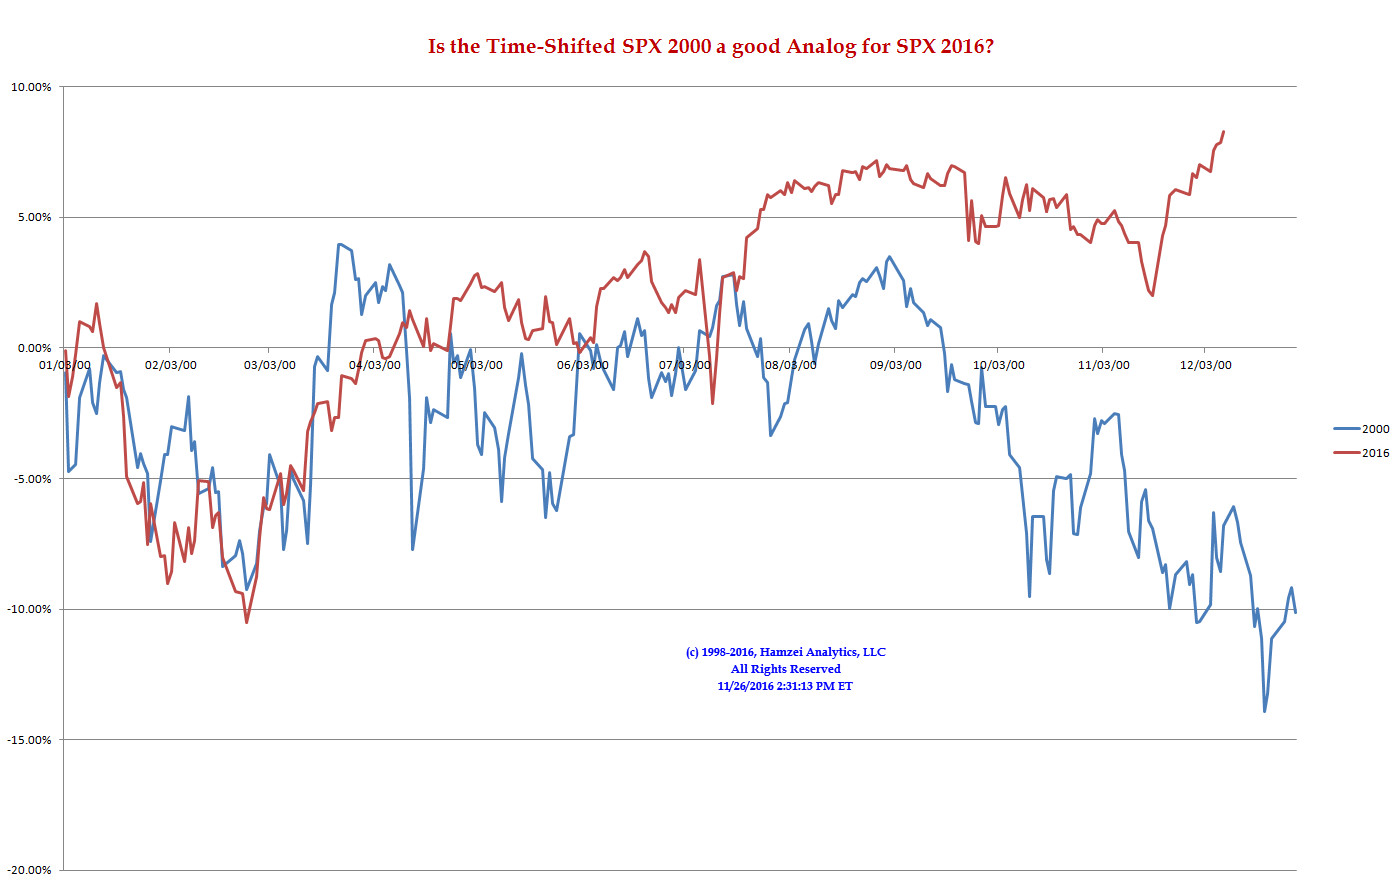
SPX 2000 Analog for SPX 2016
This Analog Chart is beyond its shelf life. RIP.
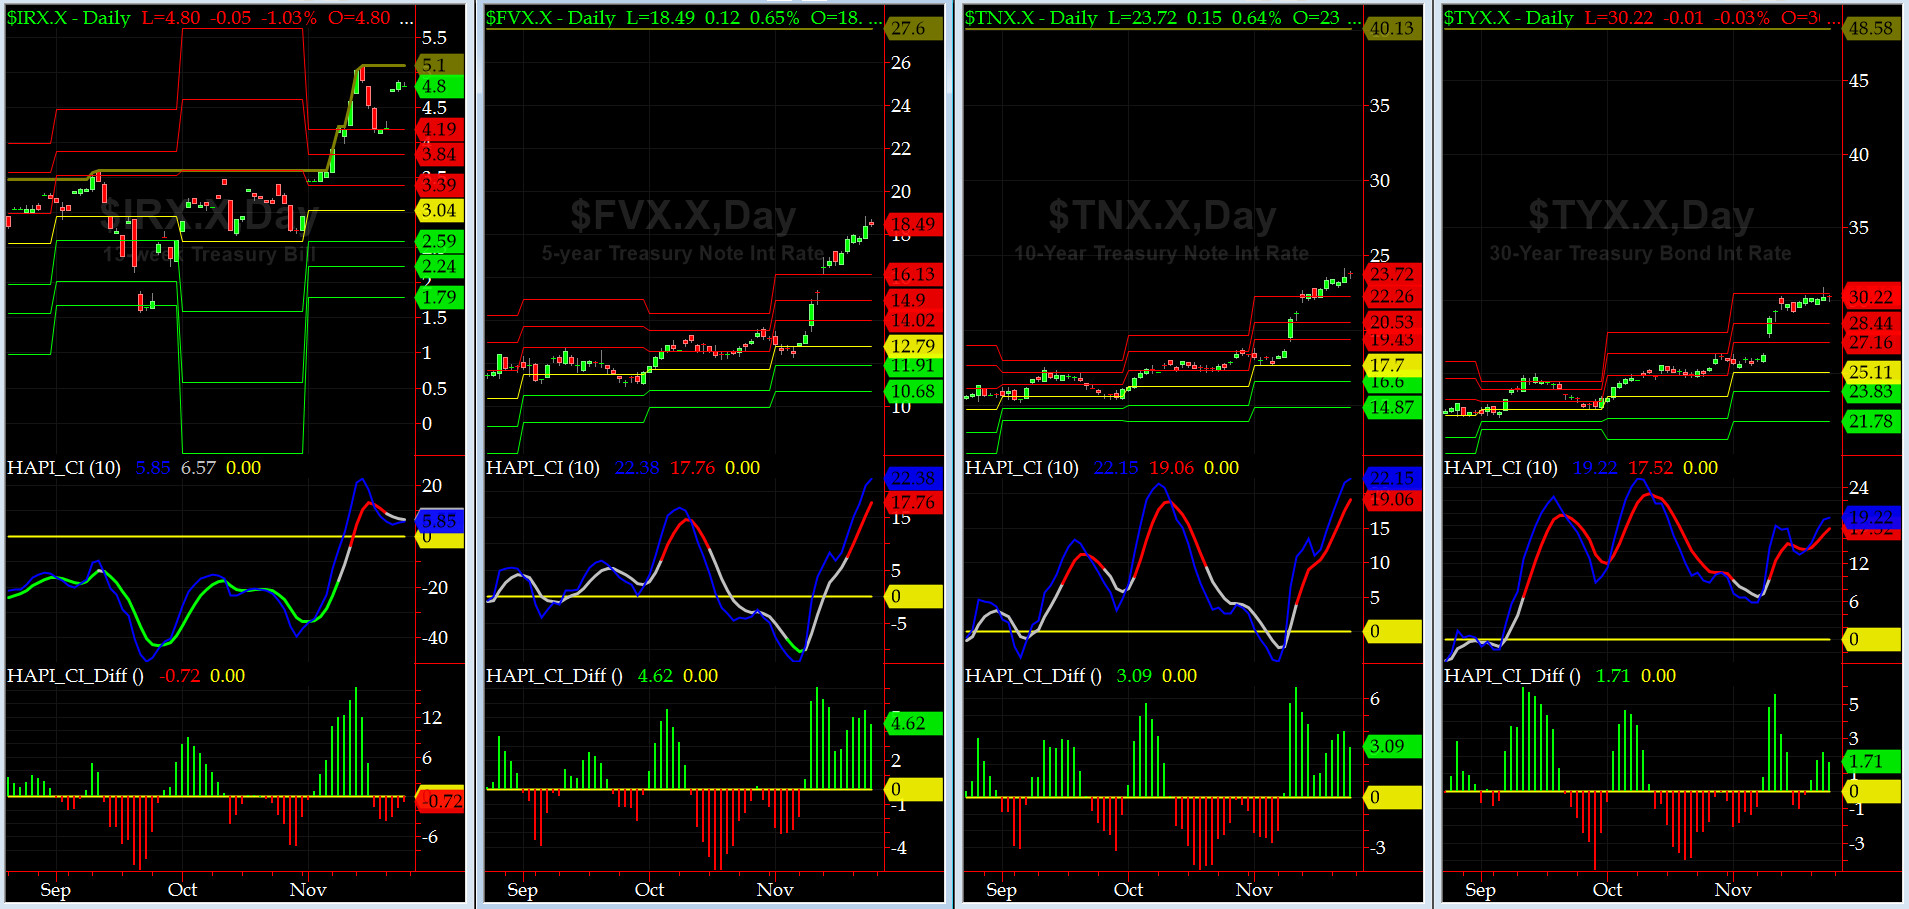
US Treasury T-Notes & T-Bonds Yields Chart
This weekend we added ATH for last 7 years to each chart. It will give us a better prespective as YTMs rally here as DJT starts to put into action his econ plan (he had a plan? asks Tiko LOL).
The YTMs on Treasury Complex shot up again on both ends and the middle of the yield curve.
Fari Hamzei
|


 Proactive Market Timing