|
Sunday, December 4, 2016, 2030ET
Market Timing Charts, Analysis & Commentary for Issue #170
Timer Charts of S&P-500 Cash Index (SPX) + NASDAQ-100 Cash Index (NDX)
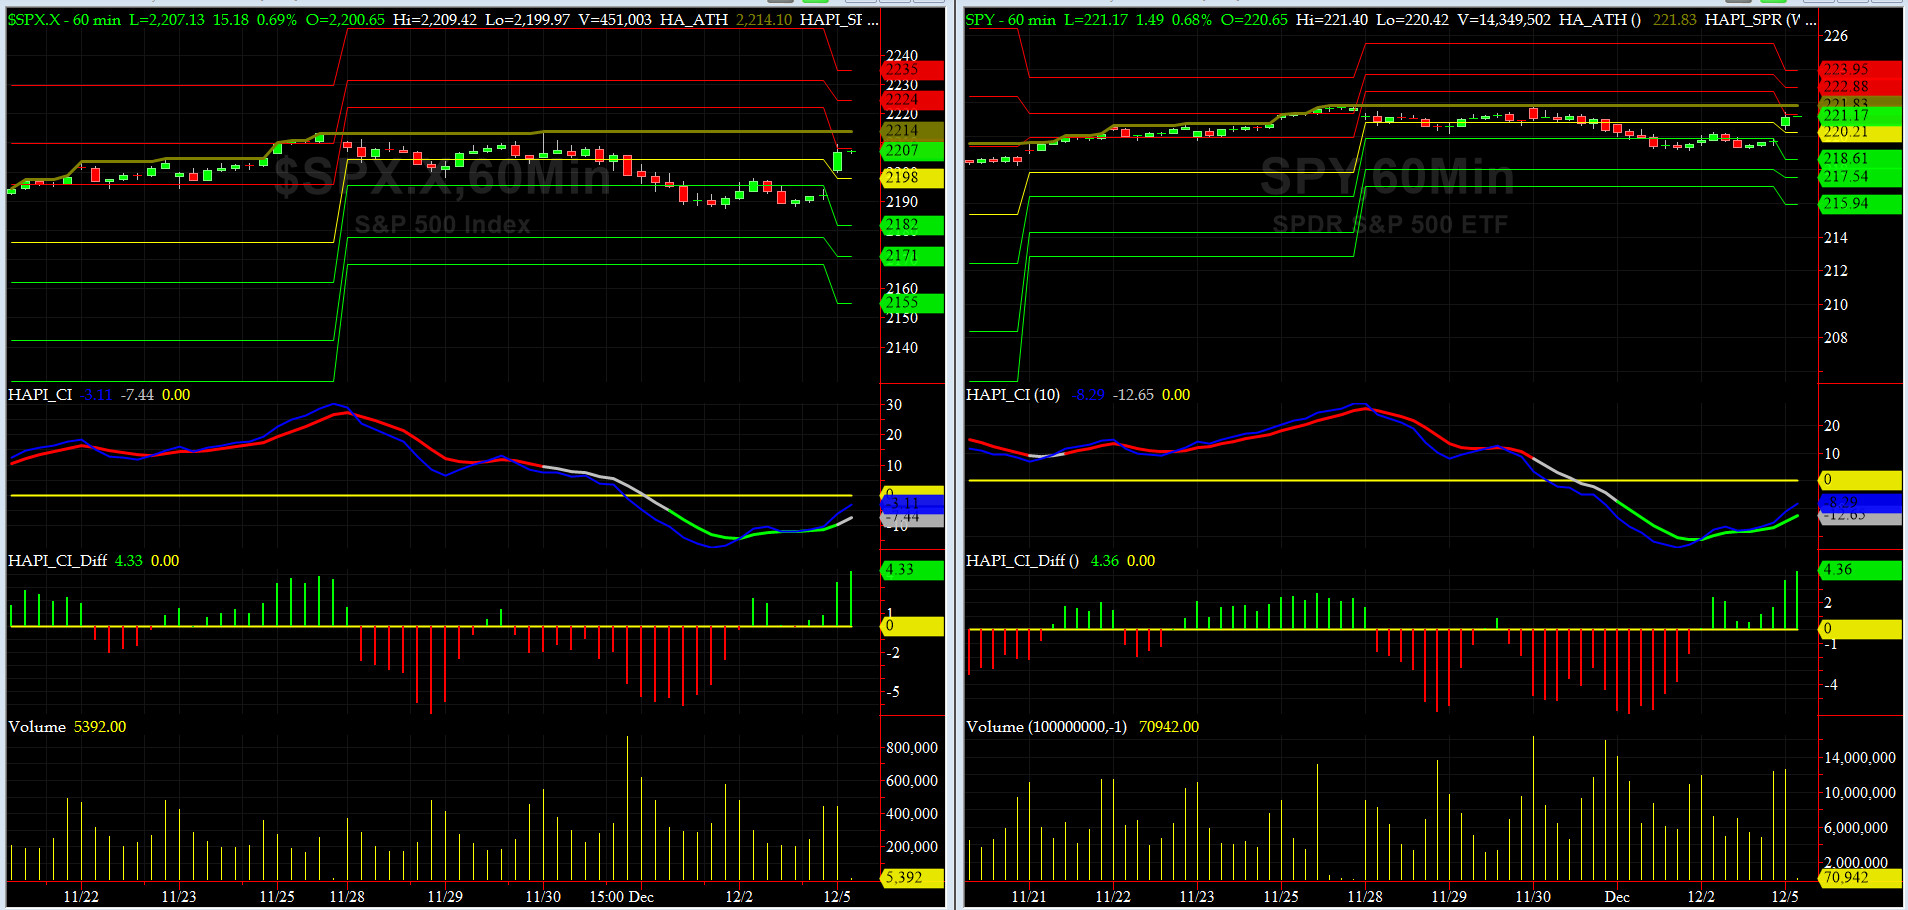
Most recent S&P-500 Cash Index (SPX): 2191.95 down -21.40 (down -0.97%) for the week ending Friday, December 2nd, 2016, which closed at about its +0.5 sigma.
SPX ALL TIME INTRADAY HIGH = 2214.10 (reached on Wednesday, November 30, 2016)
SPX ALL TIME CLOSING HIGH = 2213.35 (reached on Friday, November 25, 2016)
Current DAILY +2 Sigma SPX = 2238 with WEEKLY +2 Sigma = 2219
Current DAILY 0 Sigma (20 day MA) SPX = 2177 with WEEKLY 0 Sigma = 2162
Current DAILY -2 Sigma SPX = 2117 with WEEKLY -2 Sigma = 2105
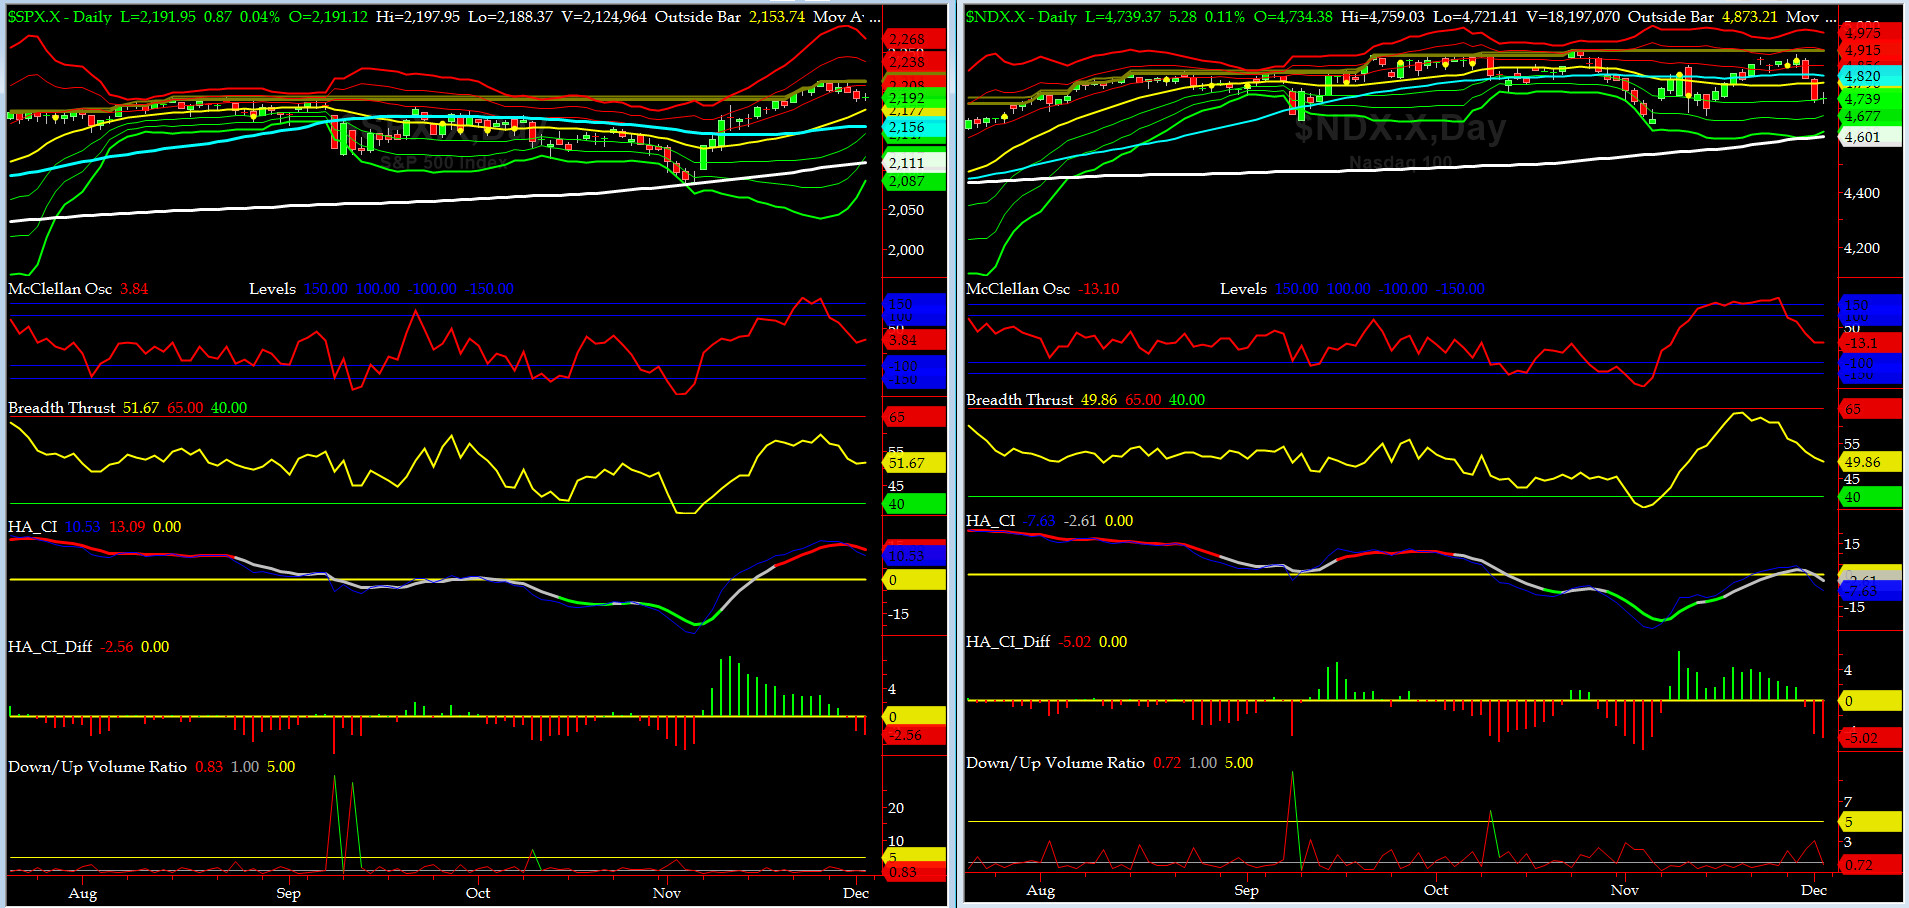
NYSE McClellan Oscillator = +4 (-150 is start of the O/S area; around -275 to -300 area or lower, we go into the �launch-pad� mode, over +150, we are in O/B area)
NYSE Breadth Thrust = 51.7 (40 is considered as oversold and 65 as overbought)
Ceteris paribus, we still plan to stay long SPX into next FOMC Meeting (Dec 13-14).

Canaries [in the Coal Mine] Chart for DJ TRAN & RUT Indices
200-Day MA DJ TRAN = 7909 or 14.4% below DJ TRAN (max observed in last 5 yrs = 20.2%, min = -20.3%)
200-Day MA RUT = 1178 or 11.5% below RUT (max observed in last 5 yrs = 21.3%, min = -22.6%)
DJ Transports (proxy for economic conditions 6 to 9 months hence) lost it mojo and basically did nothing.
Russell 2000 small caps (proxy for Risk ON/OFF) had a tough week and gave back 2% in 4 days but RISK is definitely still ON.
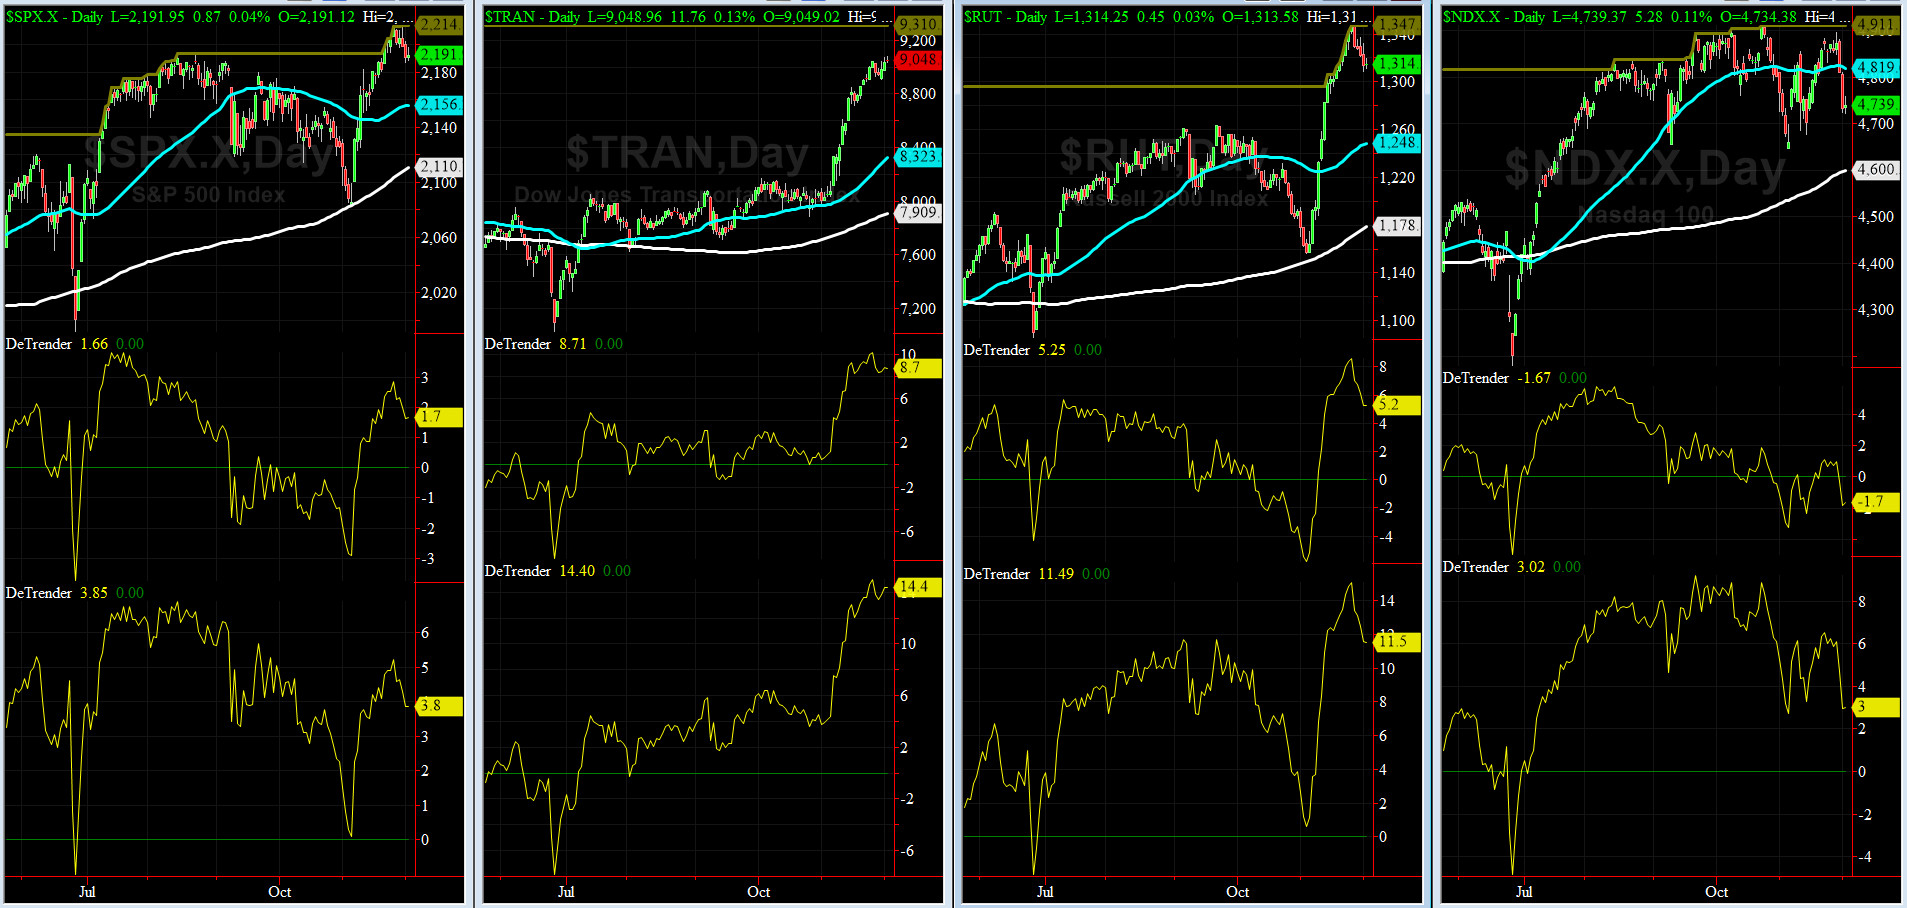
DeTrenders Charts for SPX, NDX, TRAN & RUT Indices
50-Day MA SPX = 2156 or 1.7 below SPX closed on Friday (max observed in last 5 yrs = +8.6%, min = -9.3%)
200-Day MA SPX = 2110 or 3.8% below SPX (max observed in last 5 yrs = 15.2%, min = -14%)
One of our eight DeTrenders is negative. The De Trenders for DJ TRAN & RUT will continue to be harbingers of future price behavior in broad indices.
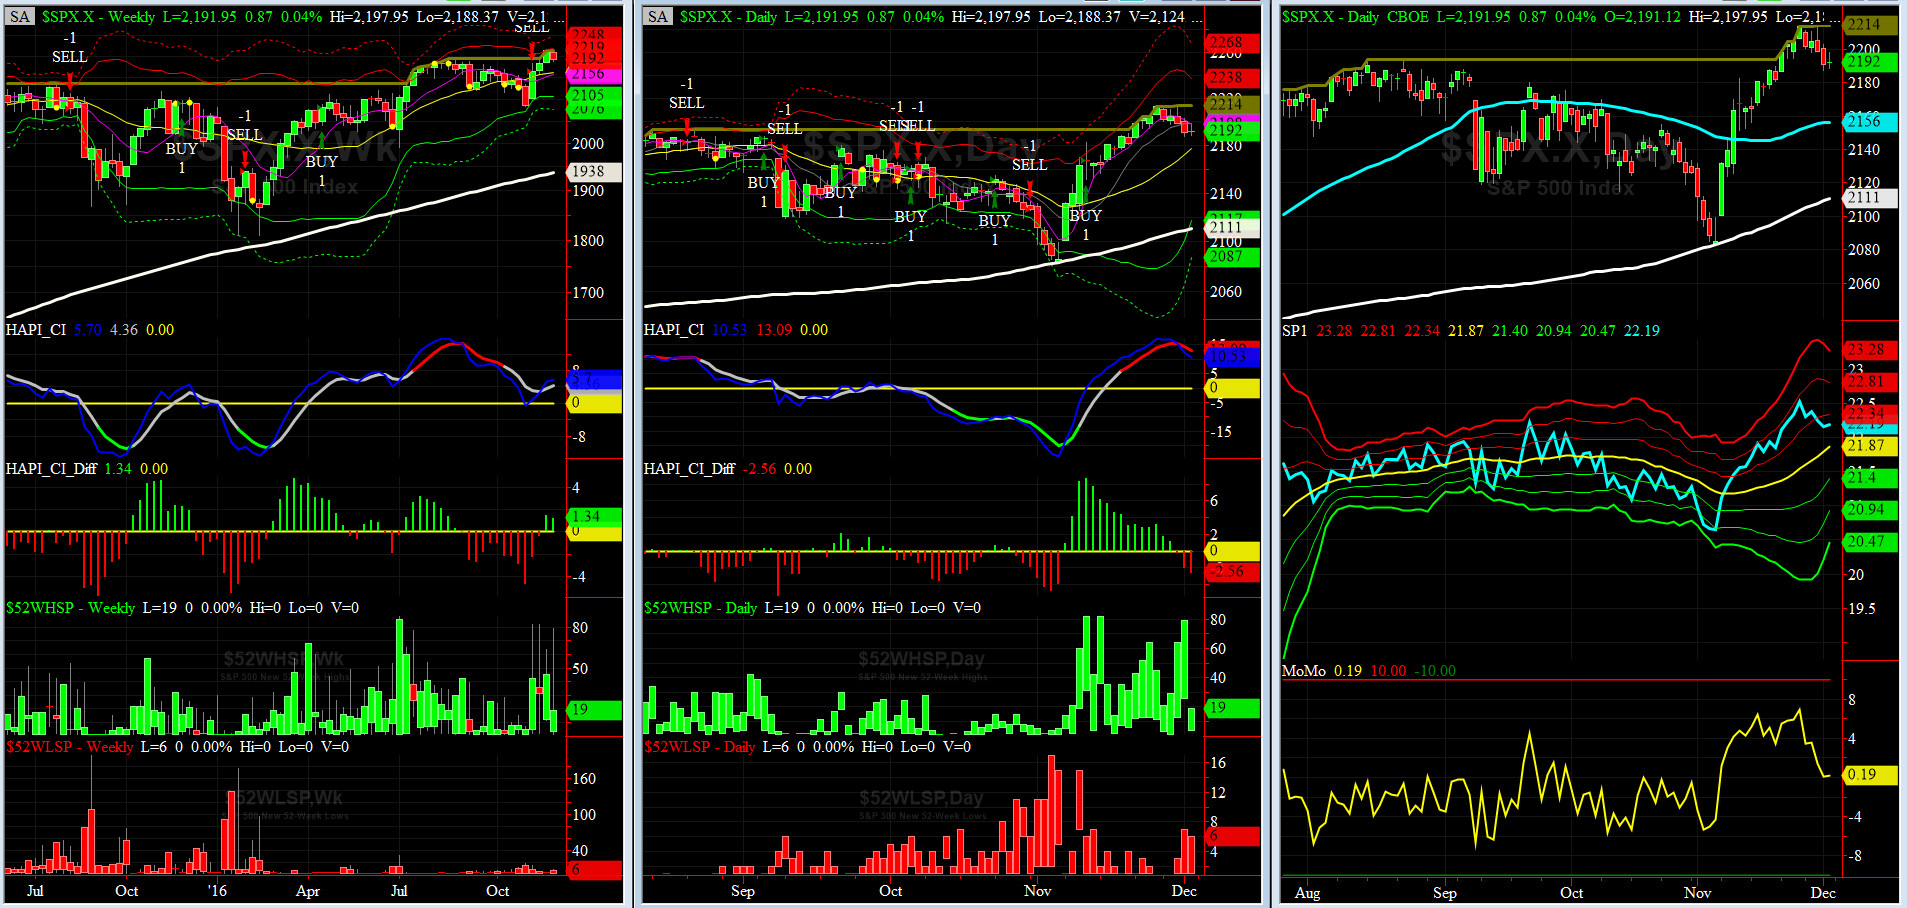
HA_SP1_Momo Chart
WEEKLY Timing Model = on a SELL Signal since Friday 11/11/16 CLOSE at 2164
DAILY Timing Model = on a BUY Signal since Thursday 12/07/16 CLOSE at 2241
Max SPX 52wk-highs reading last week = 79 (over 120-140, the local maxima is in)
Max SPX 52wk-Lows reading last week = 7 (over 40-60, the local minima is in)
HA_SP1 = very near its +0.5 sigma channels
HA_Momo = +0.2 (reversals most likely occur above +10 or below -10)
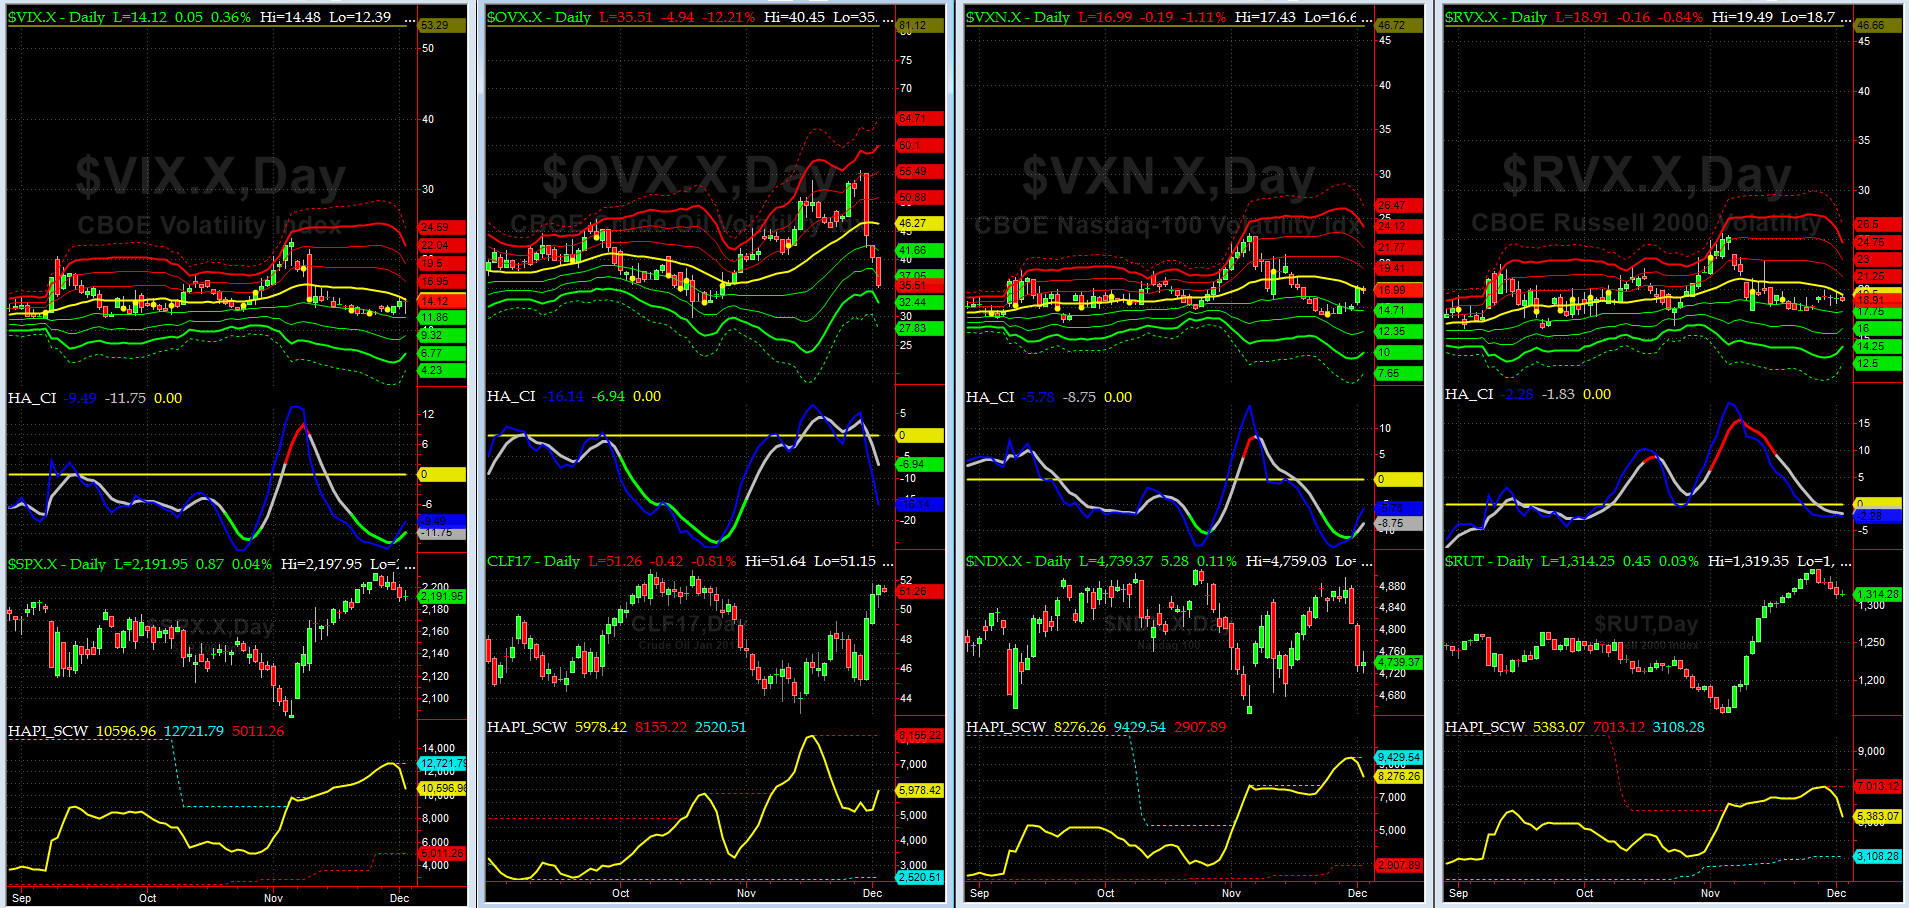
Vol of the Vols Chart
VIX is currently at its +1 sigma level at 14.12 (remember it�s the VIX�s vol pattern (its sigma channels) that matters, and not the level of VIX itself (this is per Dr. Robert Whaley, a great mentor and the inventor of original VIX, now called VXO). VIX usually peaks around a test of its +4 sigma).
The current shock wave is over. Crude Oil Vol sank faster than lead in water this week after OPEC agreed on its first production freeze since 2008.
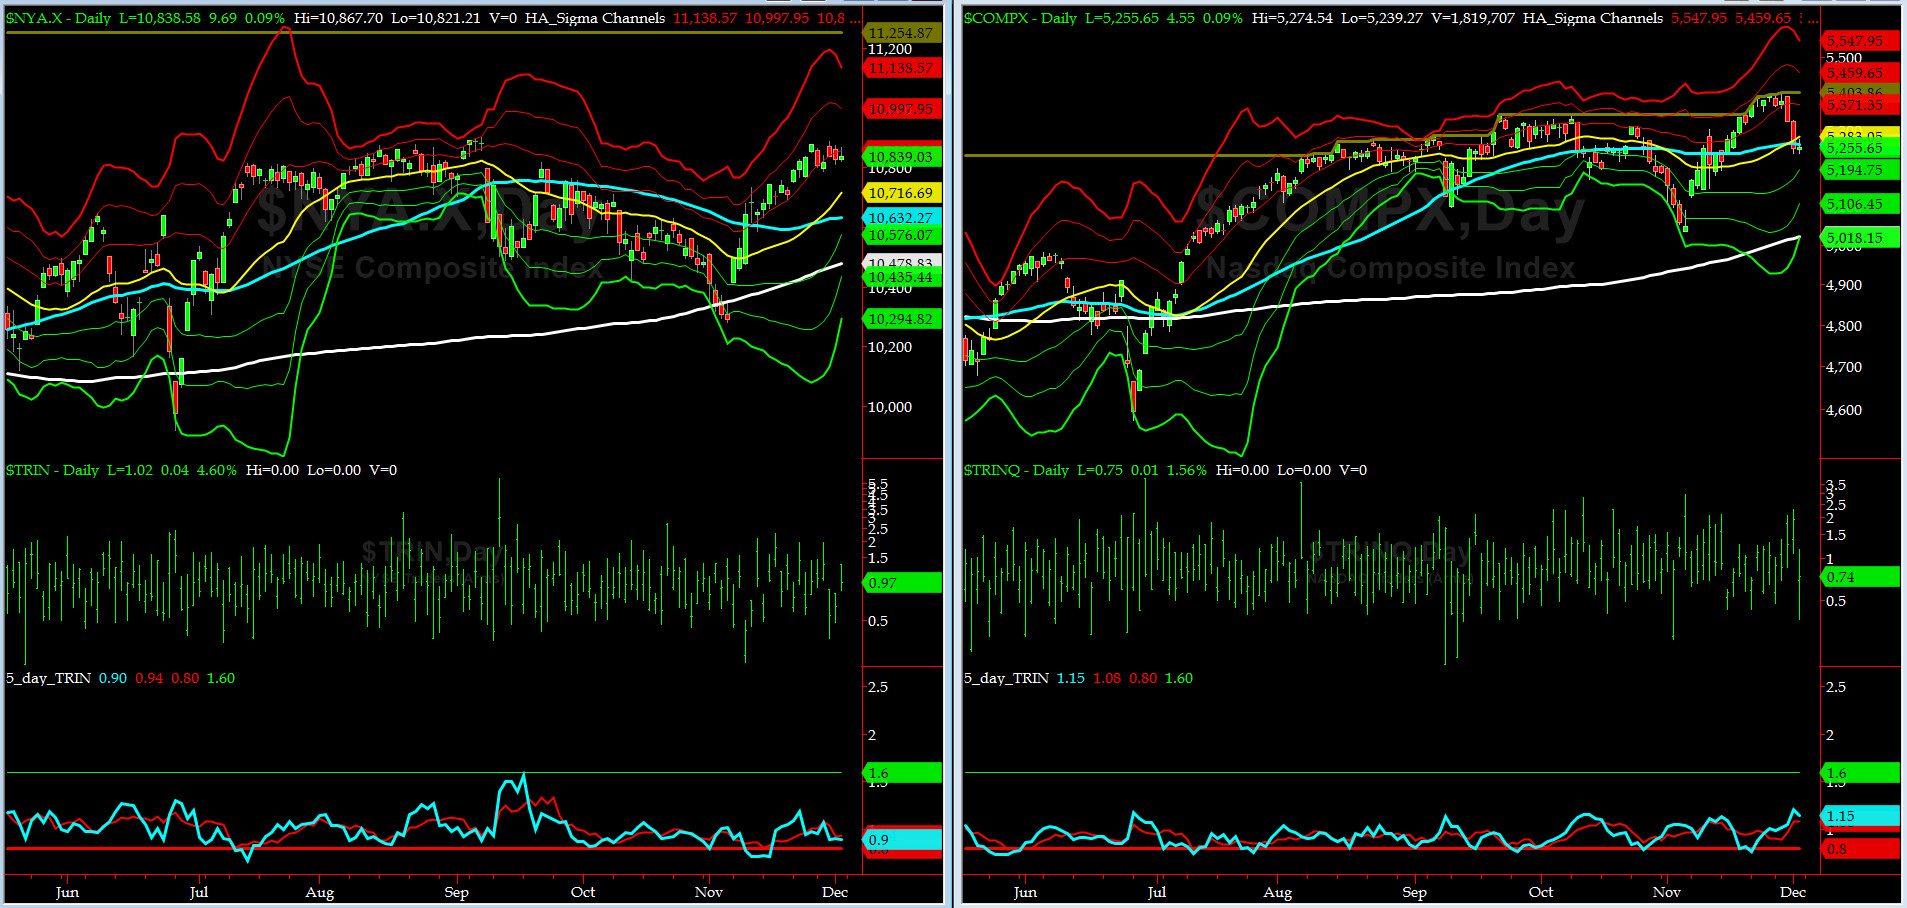
5-day TRIN & TRINQ Charts
Both NYSE & NASDAQ 5-day TRINs are in NEUTRAL zones.
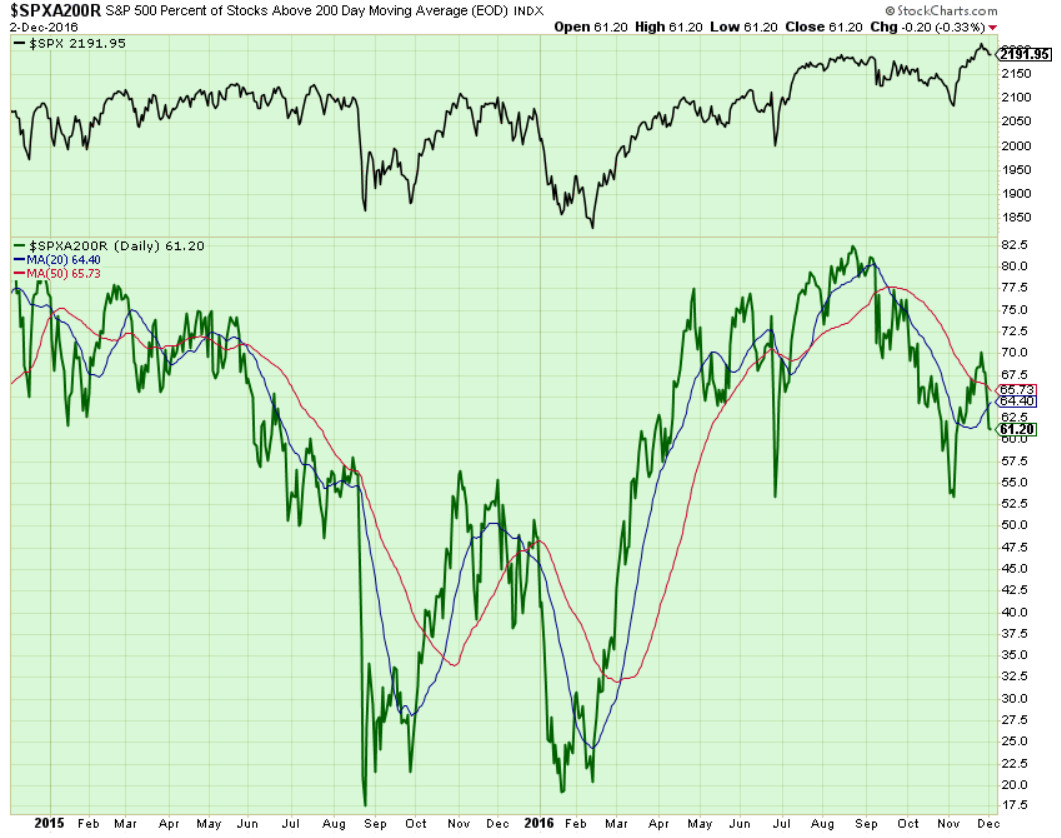
Components of SPX above their respective 200day MA Chart
This scoring indicator continued backed off down to 61%, having run up for 52 to 70 since the General Election.
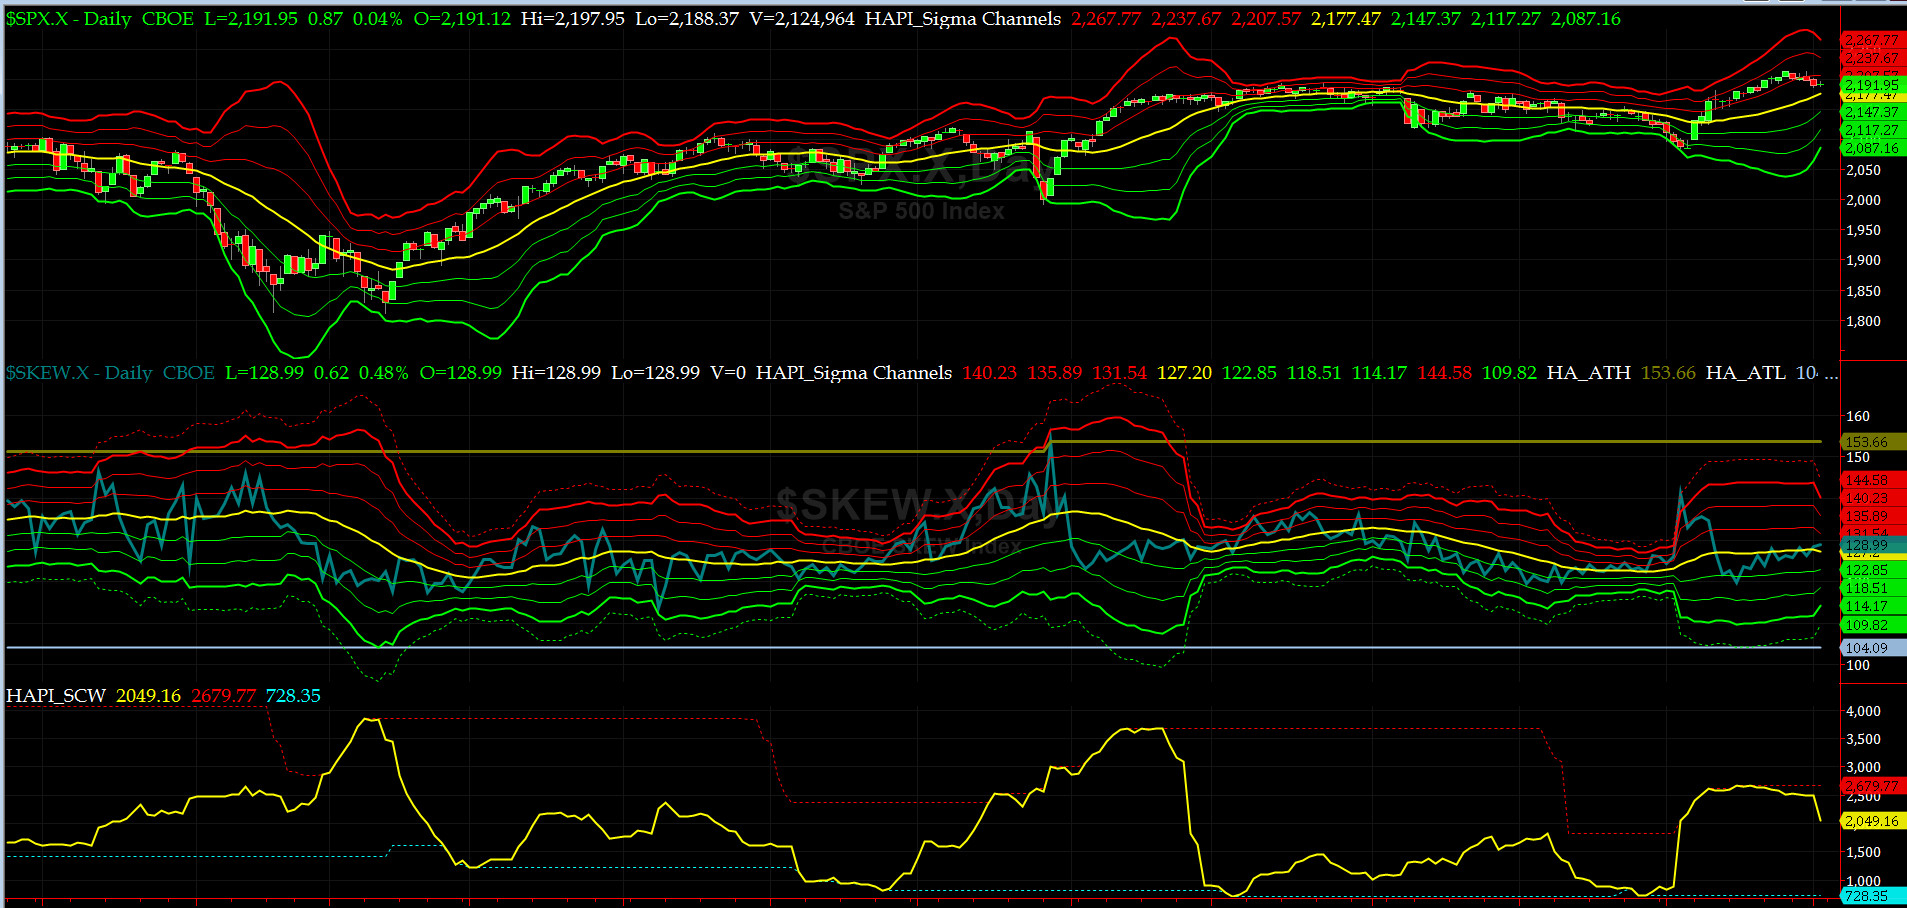
SPX SKEW (Tail Risk) Chart
Last week SPX SKEW (Tail Risk) pretty much stayed near its zero sigma level and then closed at 129 this week. (normal = 120-125, range 100-150).
All remain quiet on the Eastern Front (WASH-BOS Elite Corridor).

3-month VIX Futures Spread(VX) Chart
Our 3-month VIX Futures Spread (LONG DEC16 & SHORT MAR17) closed at -3.23 on Friday. This spread showed very little movement while SPX dropped by less than 1%.
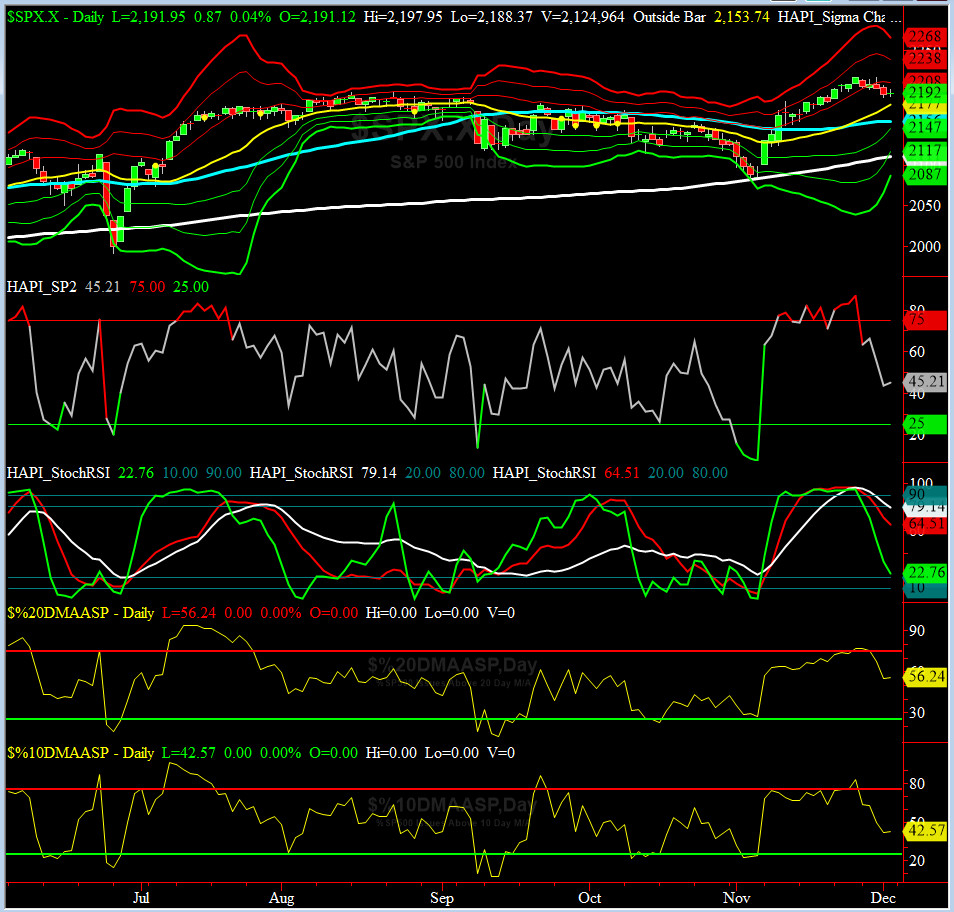
HA_SP2 Chart
HA_SP2 = 45.2 (Buy signal <= 25, Sell Signal >= 75)
This indicator sold off and closed in the neutral zone.
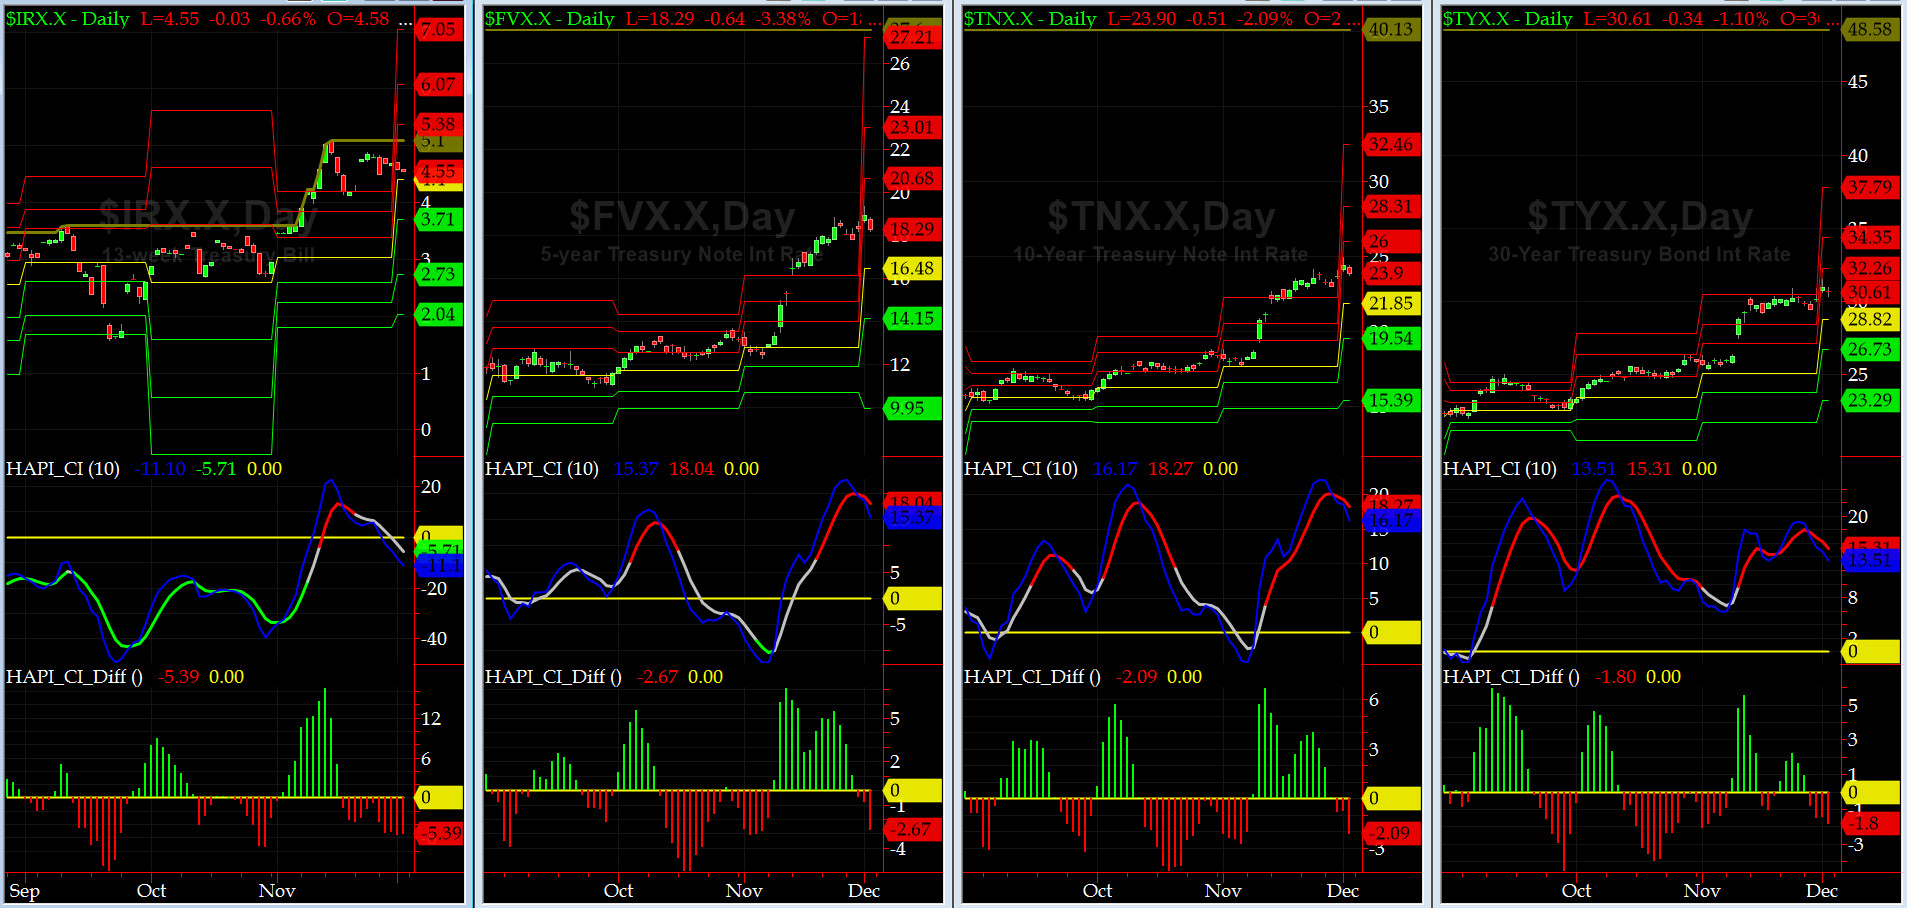
US Treasury T-Notes & T-Bonds Yields Chart
The YTMs on Treasury Complex was nearly flat this past week. 10 days from now, these charts should come alive when FOMC meets for last time in 2016.
Fari Hamzei
|


 Proactive Market Timing