
|
 |
 |
 |
 |
 |
 |
 |
 |
 Proactive Market Timing Proactive Market Timing
|
|
|
Most Recent PMT vs SPX Performance Chart

|
|
|
|
Wednesday, December 14, 2016, 1345ET
UPDATED Second Time -- Market Bias for Issue #171
Our current Market Bias with Timer Digest is SHORT SPX as of Mon Dec 12 Close at 2256.96
Our previous Market Bias was FLAT SPX as of Wednesday Dec 7 Close at 2241.35
This is our Trade for this week = LONG SPX or SPY PUT SPREADs
SPX Money Management Stop = 2290
SPX Primary Profit Target = 2245
SPX Secondary Profit Target = 2215
BOTTOM LINE: This could be a dicey trade as we believe the FED DEC rate hike is already priced in and this could be "BUY the RUMOR, SELL the NEWS" trade.
If you are left home alone, and without adult supervision, keep watching Seinfeld reruns as this trade may not be for you. For Cowboys, the best recommendation is to switch to Cheers and wait this one out. And the rest of you, use 1/2 bet size and cross your fingers.
Welcome to the NEW AMERICA......
Note:
Once the Primary Profit Target has been reached, traders should close 50% to 75% of their position in order to lock in the profits. The remaining balance can be carried over with a BreakEven STOP in order to make the trade a zero-risk trade with the final position running to reach the Secondary Profit Target.
Once either Secondary Profit or Money Management Target is hit, our Option/ETF trade for that week is over. Go to Cash and wait for the next PMT Issue.
Fari Hamzei
|
|
|
|
|
|
Tuesday, December 13, 2016, 2200ET
Link for Tonight's Market Timing Webinar
Click here to Play
Thanks for attending,
Fari Hamzei
|
|
|
|
|
|
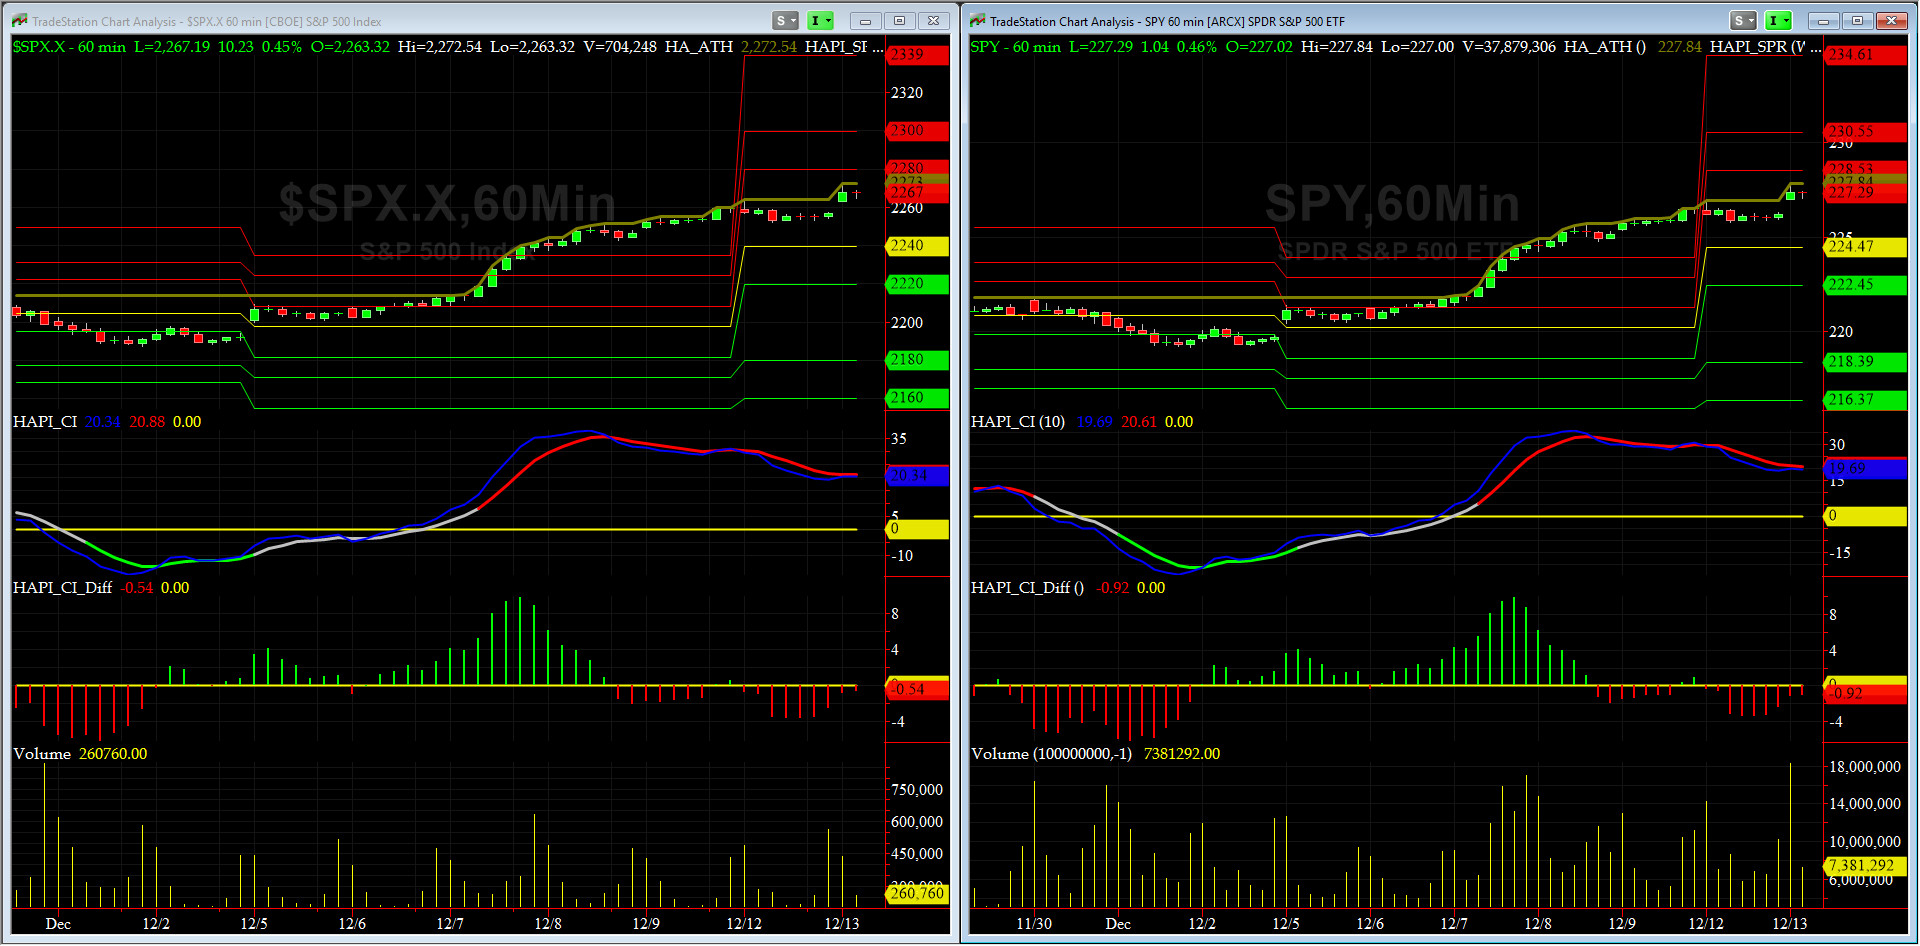
Tuesday, December 13, 2016, 1135ET
Companion Chart for Market Bias Review, Issue #171
|
|
|
|
|
|
Monday, December 12, 2016, 2230ET
UPDATED Market Bias for Issue #171
Our current Market Bias with Timer Digest is SHORT SPX as of Mon Dec 12 Close at 2256.96
Our previous Market Bias was FLAT SPX as of Wednesday Dec 7 Close at 2241.35
This is our Trade for this week = LONG SPX or SPY PUT SPREADs
SPX Money Management Stop = 2265
SPX Primary Profit Target = 2210
SPX Secondary Profit Target = 2190
BOTTOM LINE: This could be a dicey trade as we believe the FED DEC rate hike is already priced in and this could be "BUY the RUMOR, SELL the NEWS" trade.
If you are left home alone, and without adult supervision, keep watching Seinfeld reruns as this trade may not be for you. For Cowboys, the best recommendation is to switch to Cheers and wait this one out. And the rest of you, use 1/2 bet size and cross your fingers.
Welcome to the NEW AMERICA......
Note:
Once the Primary Profit Target has been reached, traders should close 50% to 75% of their position in order to lock in the profits. The remaining balance can be carried over with a BreakEven STOP in order to make the trade a zero-risk trade with the final position running to reach the Secondary Profit Target.
Once either Secondary Profit or Money Management Target is hit, our Option/ETF trade for that week is over. Go to Cash and wait for the next PMT Issue.
Fari Hamzei
|
|
|
|
|
|
Monday, December 12, 2016, 1546ET
Notice of Change of Market Bias with Timer Digest
Dear Jim,
We plan to go SHORT SPX with Timer Digest today�
Should the final settlement data for price(s), volume(s) and/or internals that gets posted after the Cash Close, present us with any unusual and/or compelling activities and/or warnings, we reserve the right to upgrade/enhance our prior intention with Timer Digest as stated earlier before the Cash Close.
Fari Hamzei
|
|
|
|
|
|
Sunday, December 11, 2016, 2100ET
Market Bias for Issue #171
Our current Market Bias with Timer Digest is FLAT SPX as of Wednesday Dec 7 Close at 2241.35
Our previous Market Bias was FLAT SPX as of Friday Nov 11 Close at 2164.45
This is our Trade for this week = NONE as of this writing....
SPX Secondary Profit Target = N/A
SPX Primary Profit Target = N/A
SPX Money Management Stop = N/A
BOTTOM LINE: We are very overbought here. May change our bias Tuesday Night (ahead of December FOMC Meeting Communique).
Note:
Once the Primary Profit Target has been reached, traders should close 50% to 75% of their position in order to lock in the profits. The remaining balance can be carried over with a BreakEven STOP in order to make the trade a zero-risk trade with the final position running to reach the Secondary Profit Target.
Once either Secondary Profit or Money Management Target is hit, our Option/ETF trade for that week is over. Go to Cash and wait for the next PMT Issue.
Fari Hamzei
|
|
|
|
|
|
Sunday, December 11, 2016, 2045ET
Market Timing Charts, Analysis & Commentary for Issue #171
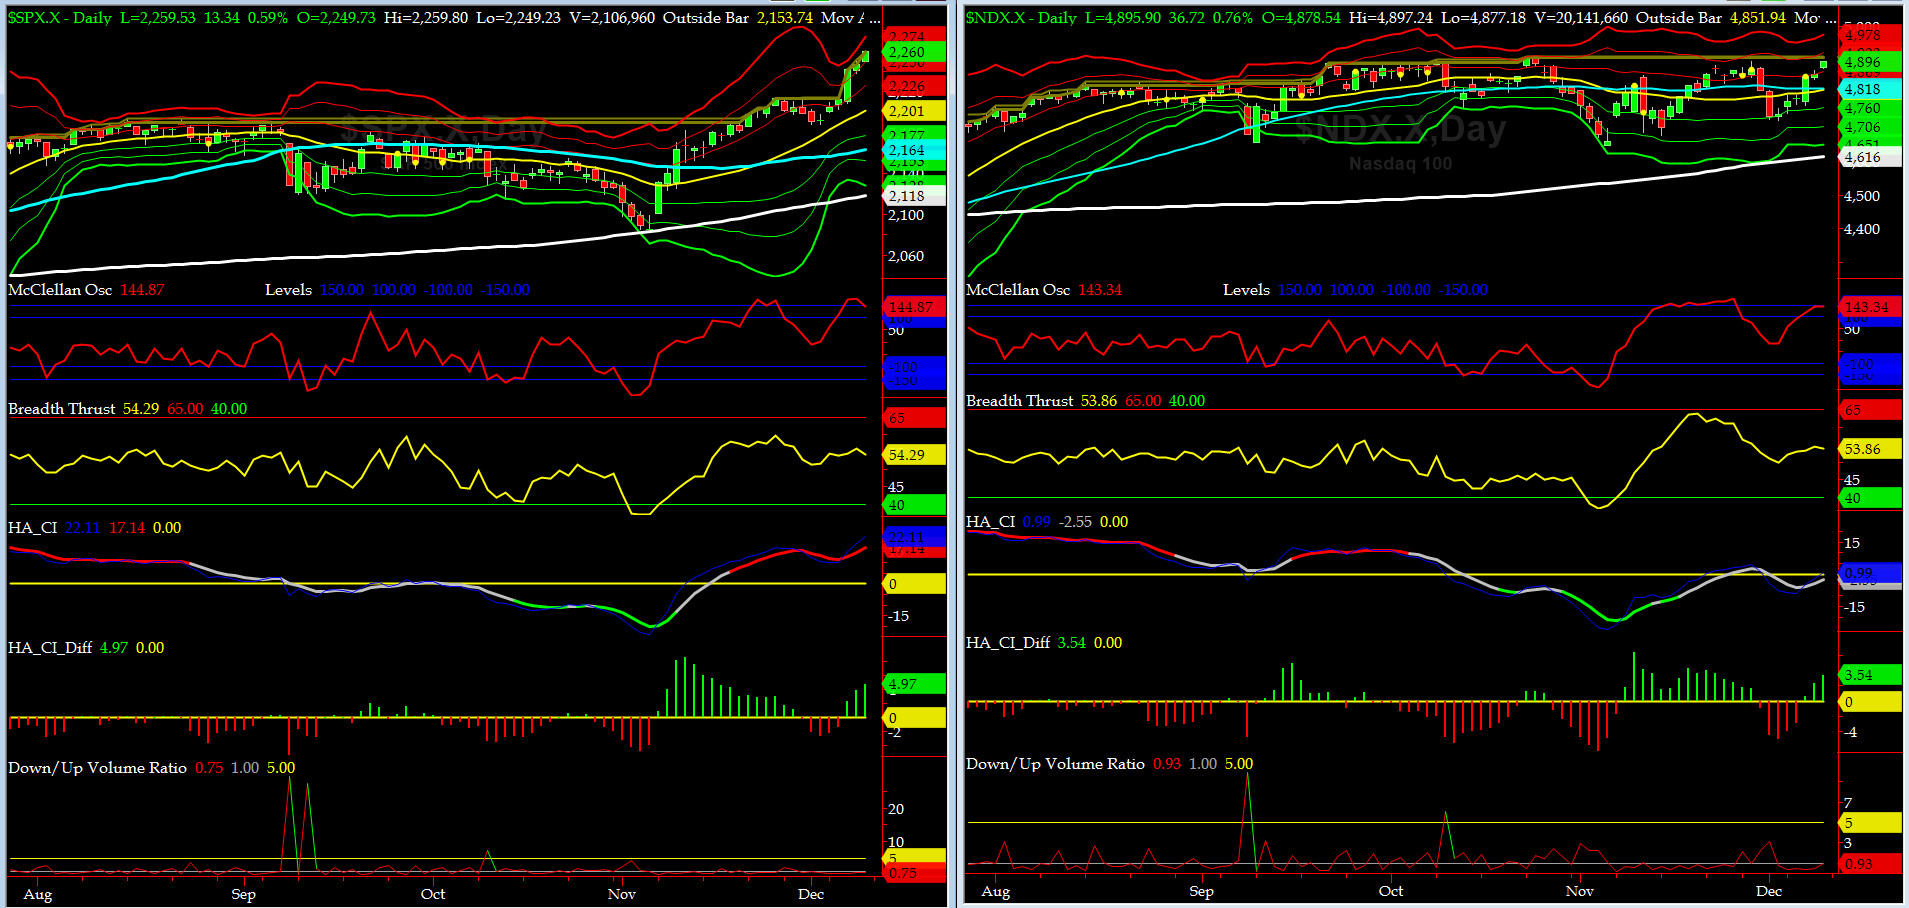
Timer Charts of S&P-500 Cash Index (SPX) + NASDAQ-100 Cash Index (NDX)
Most recent S&P-500 Cash Index (SPX): 2259.53 up +67.58 (up 3%) for the week ending Friday, December 9th, 2016, which closed at about its +2.5 sigma.
SPX ALL TIME INTRADAY HIGH = 2259.80 (reached on Friday, December 9, 2016)
SPX ALL TIME CLOSING HIGH = 2259.53 (reached on Friday, December 9, 2016)
Current DAILY +2 Sigma SPX = 2250 with WEEKLY +2 Sigma = 2237
Current DAILY 0 Sigma (20 day MA) SPX = 2201 with WEEKLY 0 Sigma = 2166
Current DAILY -2 Sigma SPX = 2153 with WEEKLY -2 Sigma = 2095
NYSE McClellan Oscillator = +144.9 (-150 is start of the O/S area; around -275 to -300 area or lower, we go into the �launch-pad� mode, over +150, we are in O/B area)
NYSE Breadth Thrust = 54.3 (40 is considered as oversold and 65 as overbought)
We are very overbought......
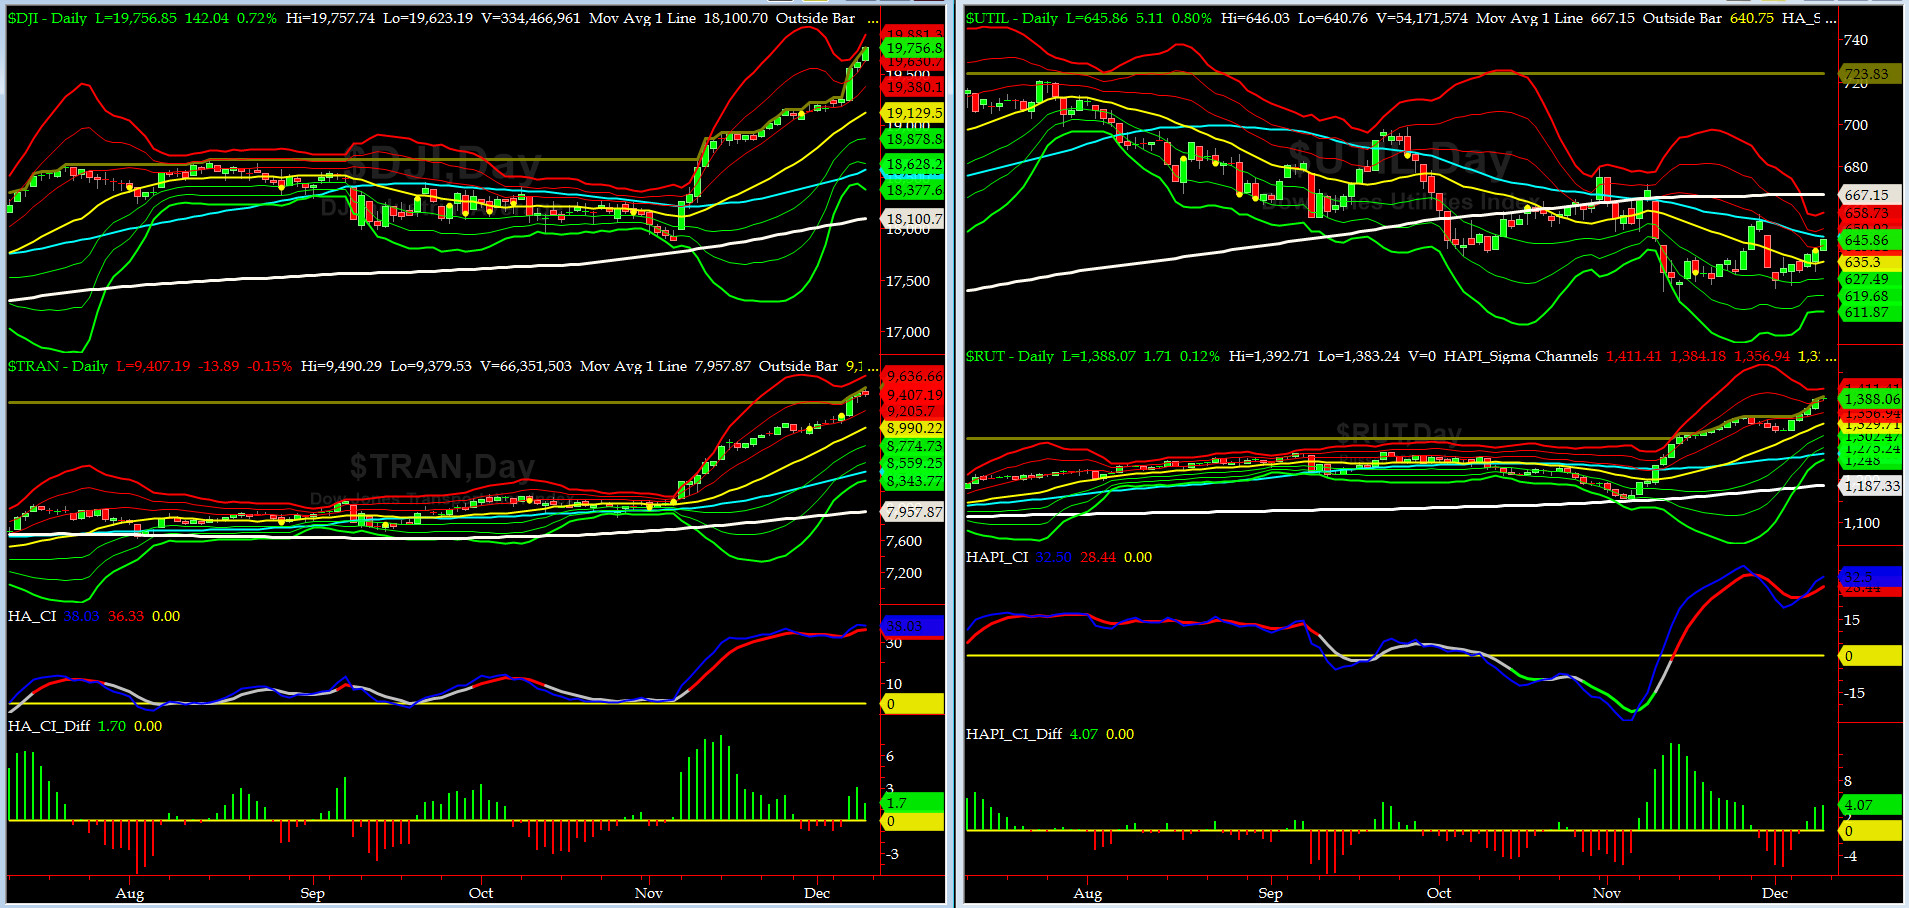
Canaries [in the Coal Mine] Chart for DJ TRAN & RUT Indices
200-Day MA DJ TRAN = 7957 or 18.2% below DJ TRAN (max observed in last 5 yrs = 20.2%, min = -20.3%)
200-Day MA RUT = 1187 or 16.9% below RUT (max observed in last 5 yrs = 21.3%, min = -22.6%)
DJ Transports (proxy for economic conditions 6 to 9 months hence) went into full parabolic mode, as its price action trajectory went vertical.
Russell 2000 small caps (proxy for Risk ON/OFF) followed in tandem, finishing the week very strong. RISK remains firmly ON.
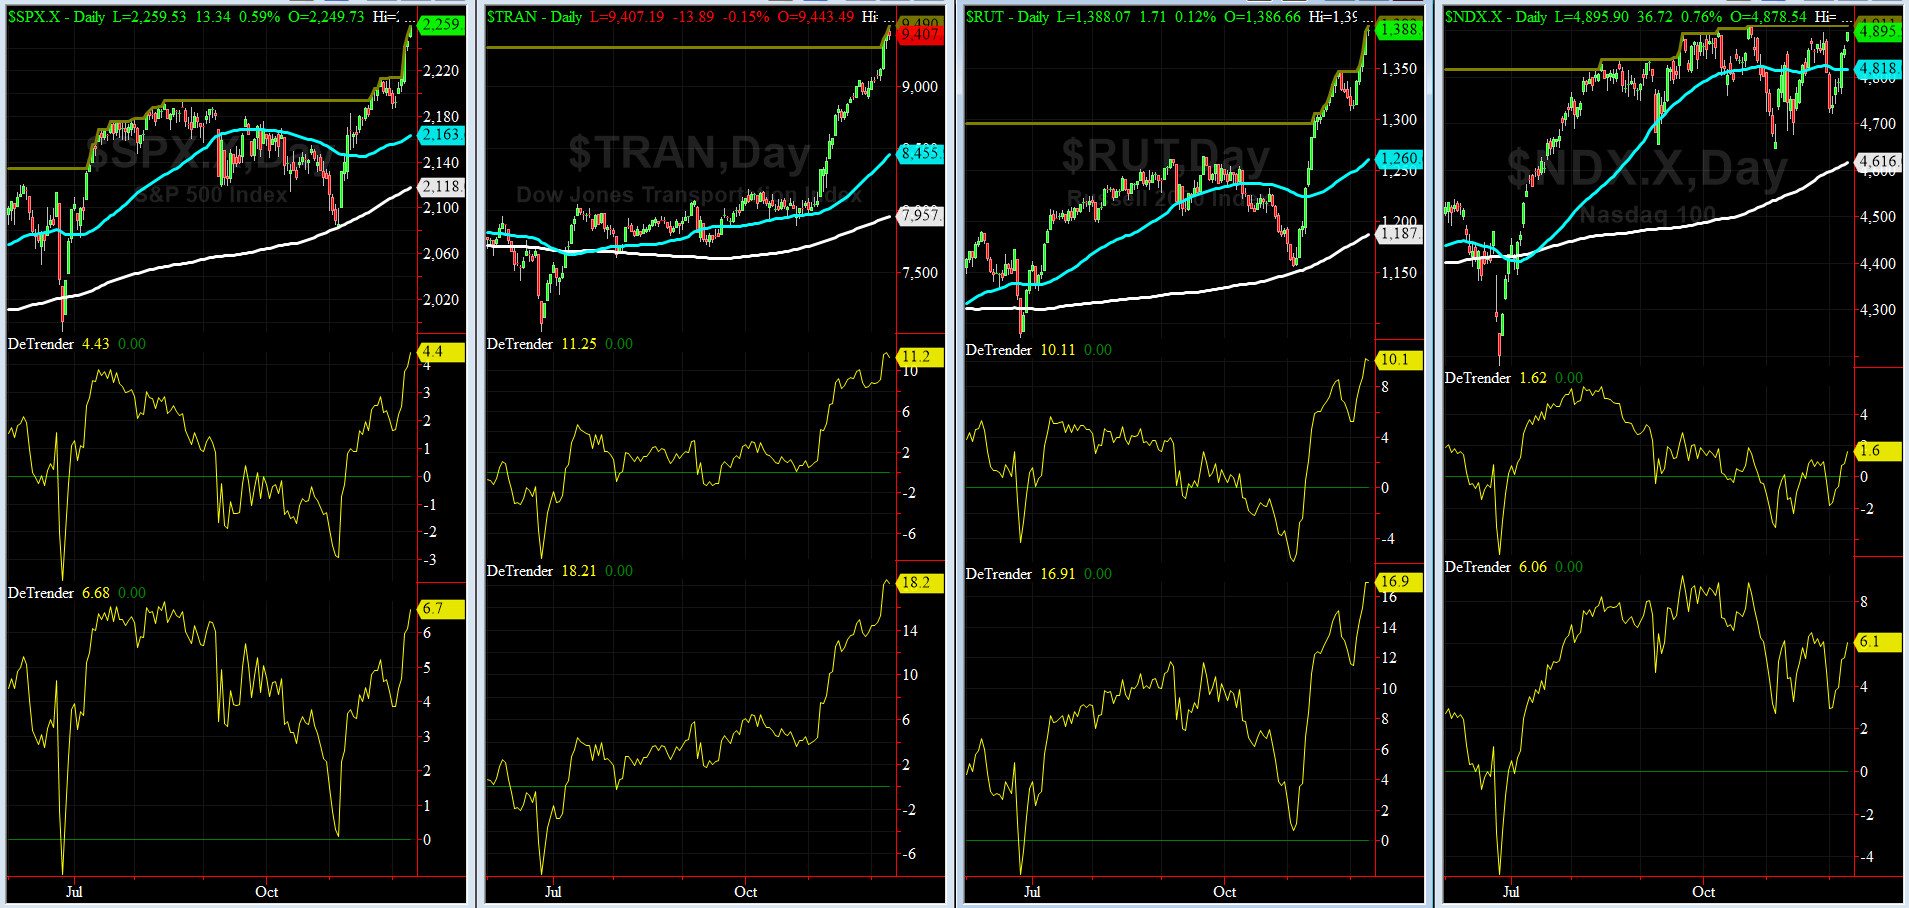
DeTrenders Charts for SPX, NDX, TRAN & RUT Indices
50-Day MA SPX = 2163 or 4.4% below SPX closed on Friday (max observed in last 5 yrs = +8.6%, min = -9.3%)
200-Day MA SPX = 2118 or 6.7% below SPX (max observed in last 5 yrs = 15.2%, min = -14%)
NONE of our eight DeTrenders are negative. The DeTrenders for DJ TRAN & RUT will continue to be harbingers of future price behavior in broad indices.
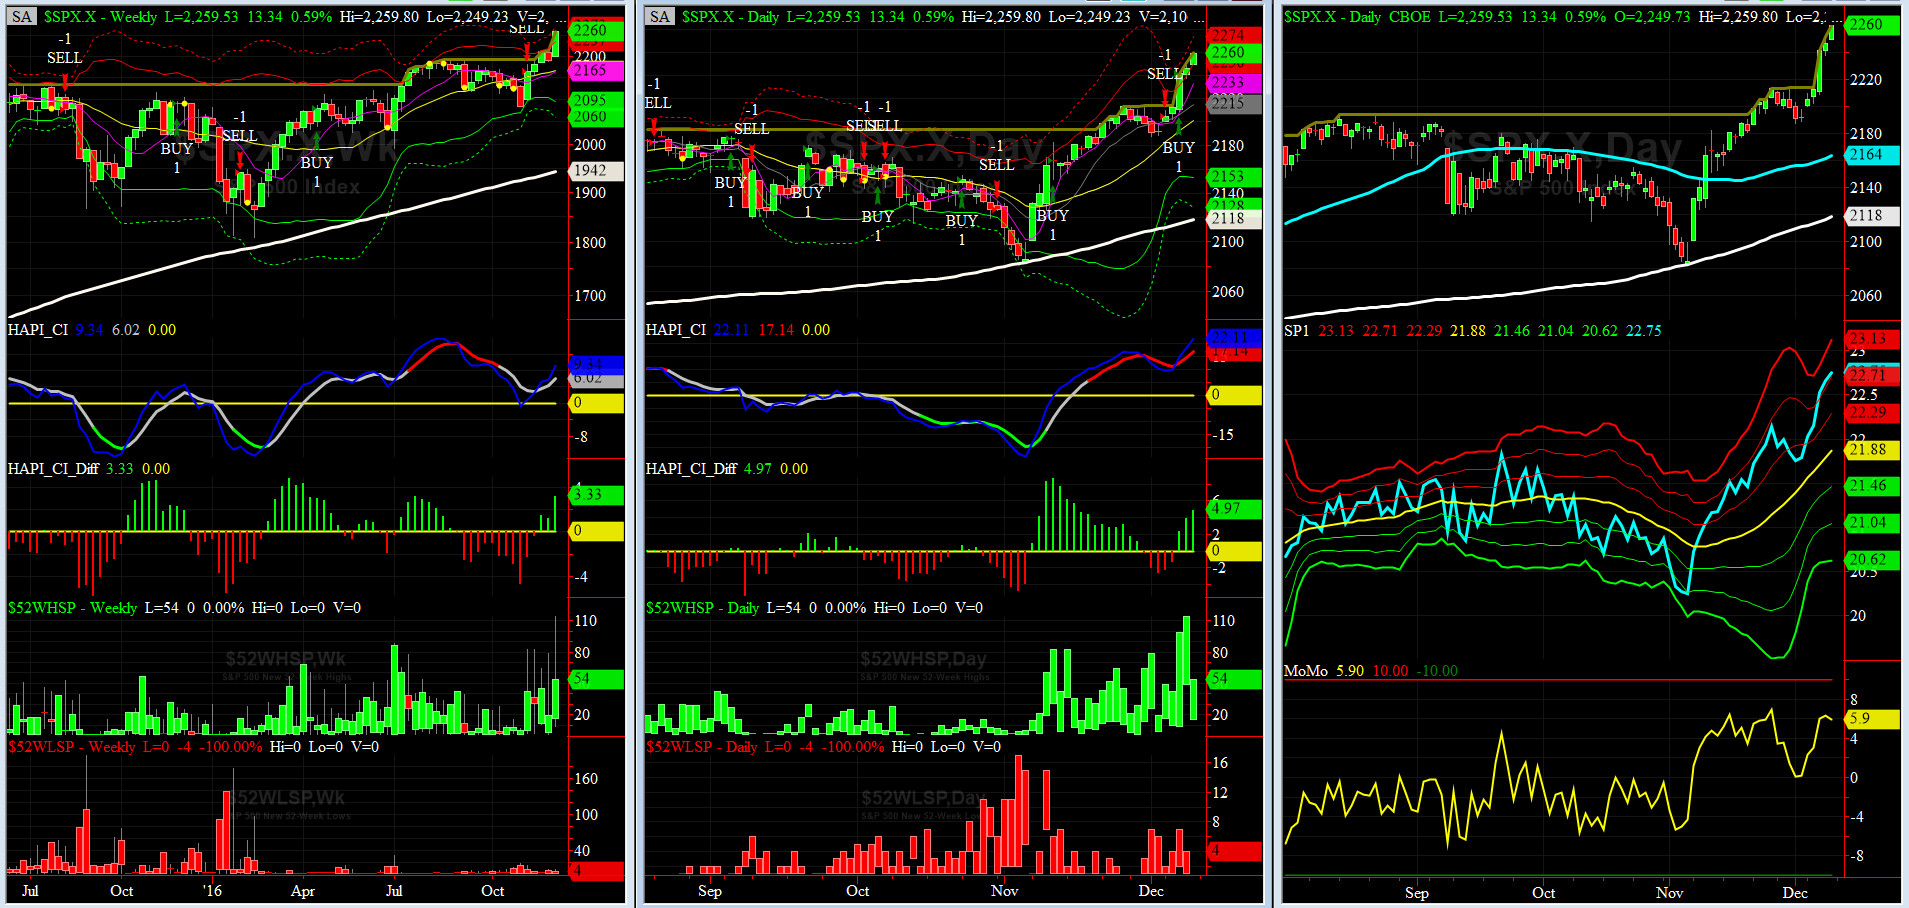
HA_SP1_Momo Chart
WEEKLY Timing Model = on a SELL Signal since Friday 11/11/16 CLOSE at 2164
DAILY Timing Model = on a BUY Signal since Wednesday 12/07/16 CLOSE at 2241
Max SPX 52wk-highs reading last week = 114 (over 120-140, the local maxima is in)
Max SPX 52wk-Lows reading last week = 7 (over 40-60, the local minima is in)
HA_SP1 = very near its +2 sigma channels
HA_Momo = +5.9 (reversals most likely occur above +10 or below -10)
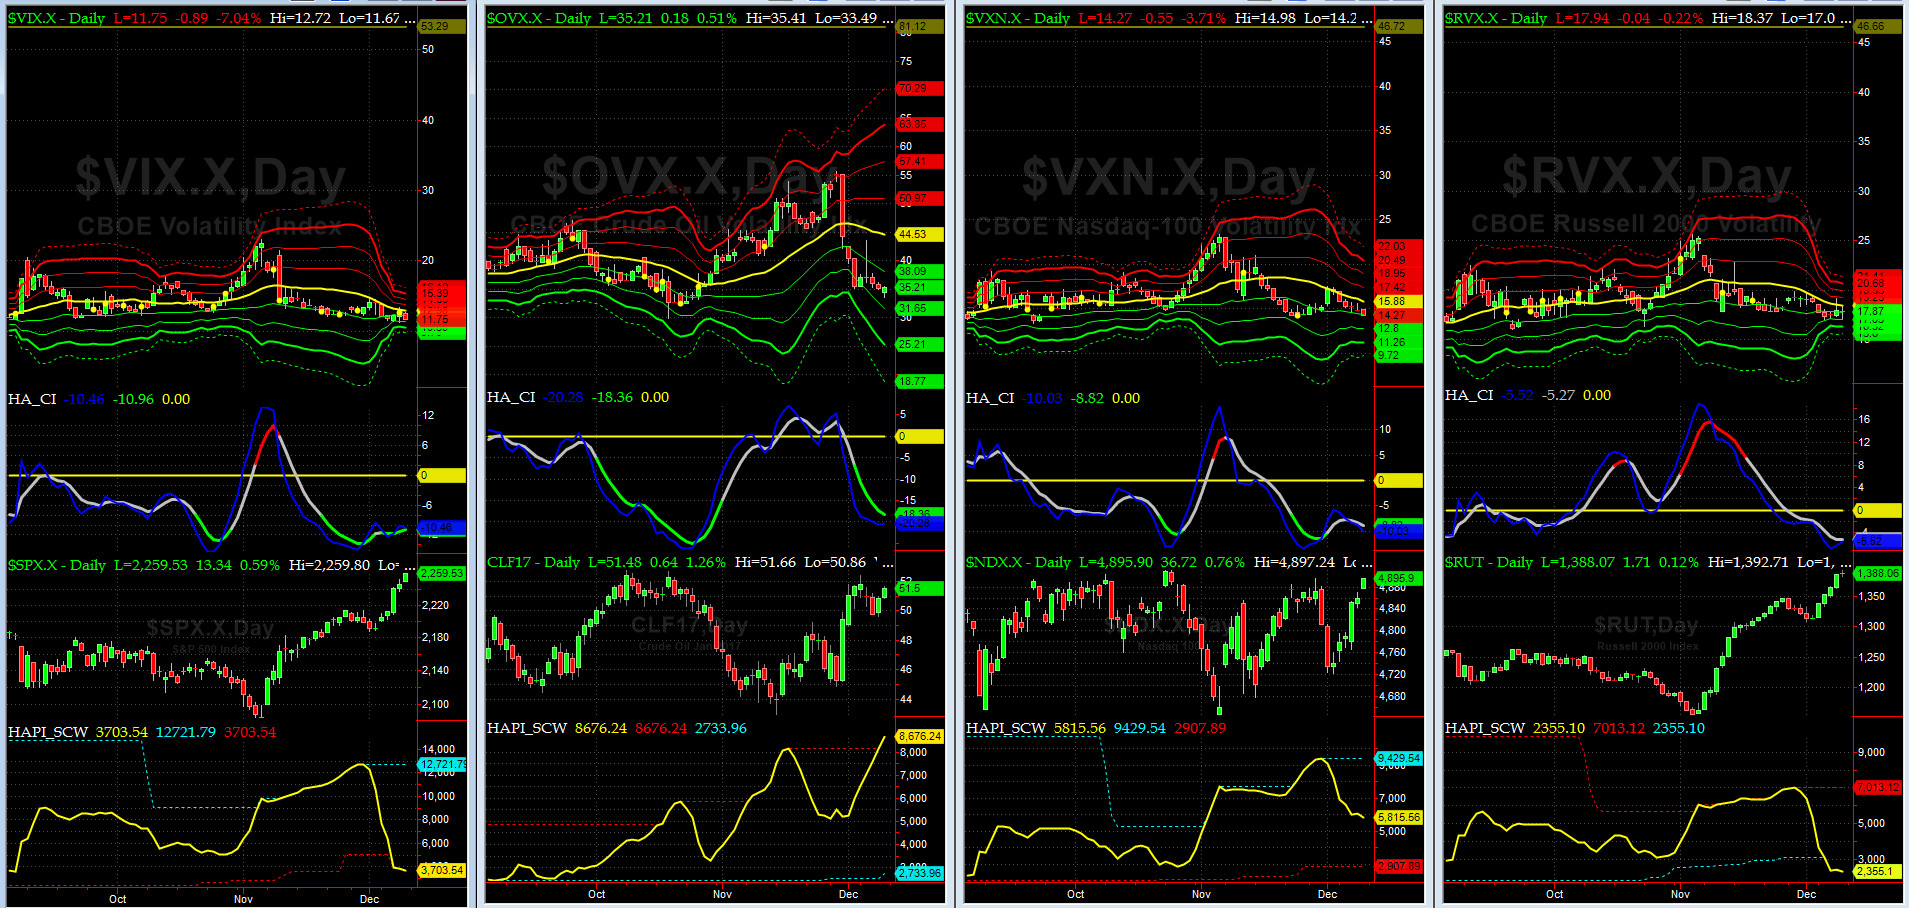
Vol of the Vols Chart
VIX is currently at its +1 sigma level at 11.75 (remember it�s the VIX�s vol pattern (its sigma channels) that matters, and not the level of VIX itself (this is per Dr. Robert Whaley, a great mentor and the inventor of original VIX, now called VXO). VIX usually peaks around a test of its +4 sigma).
The final shock wave in VIX has long been faded. Crude Oil Vol continued to drop as Crude Oil futures staged a strong rally post production freeze news out of OPEC meeting.
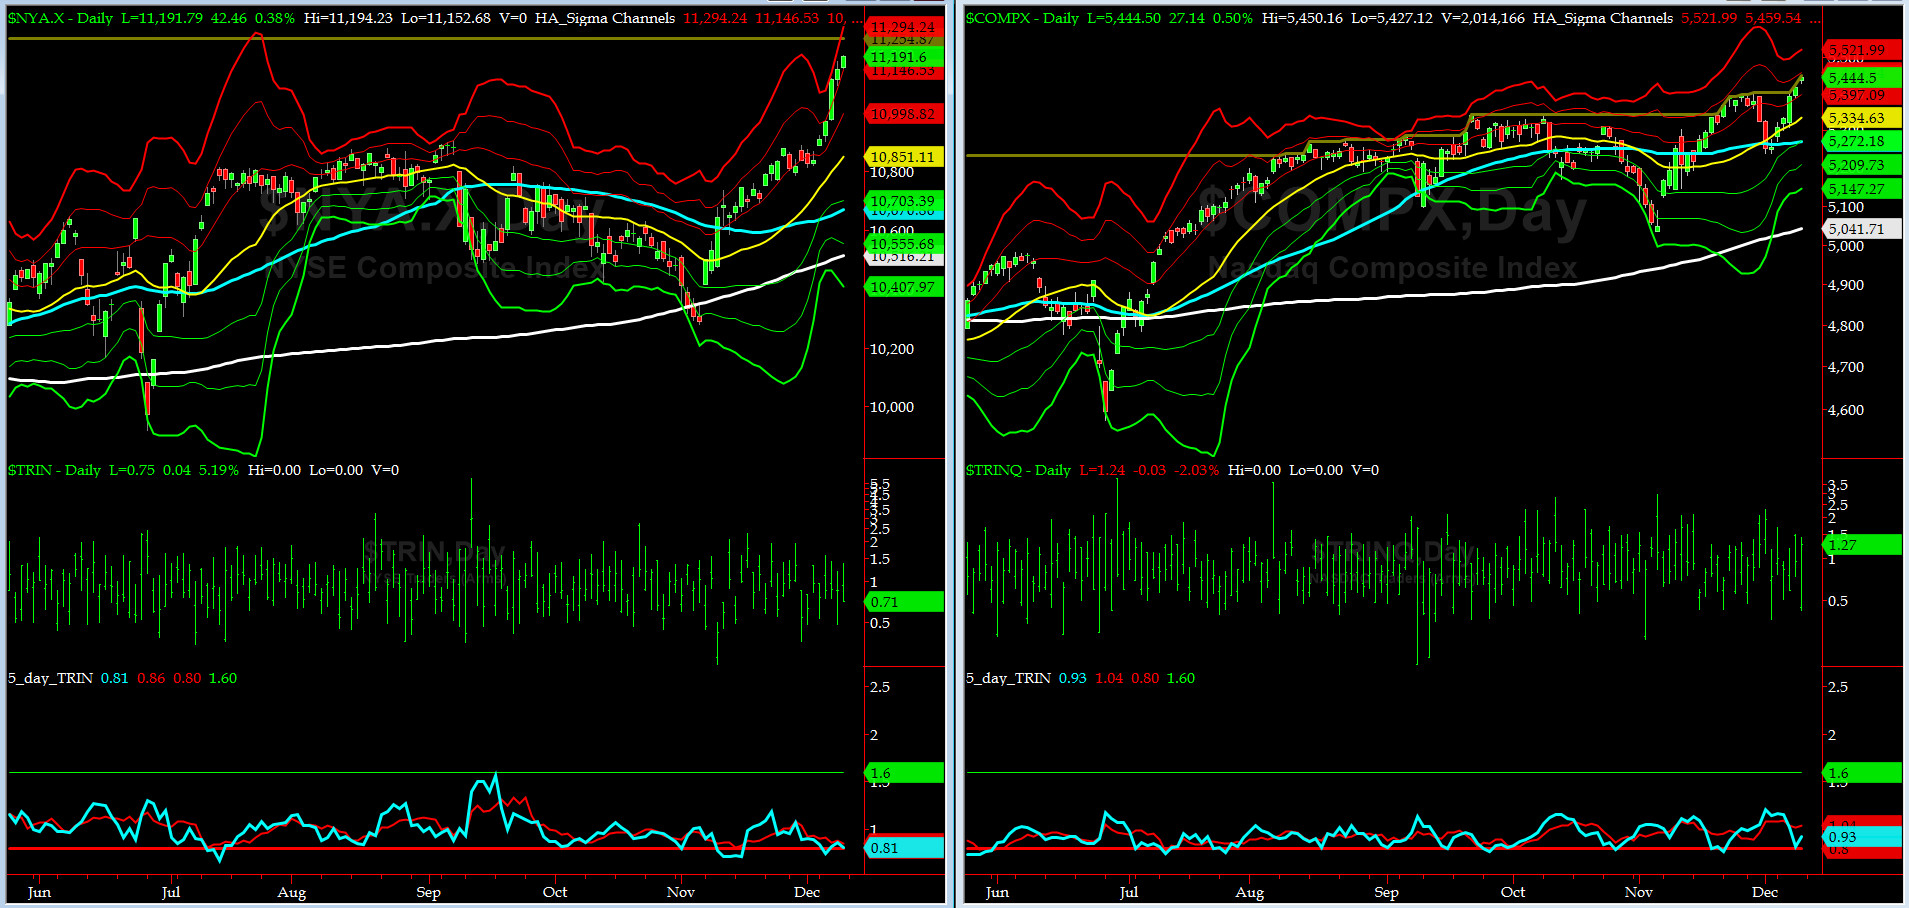
5-day TRIN & TRINQ Charts
Both NYSE & NASDAQ 5-day TRINs are in SELL zones.
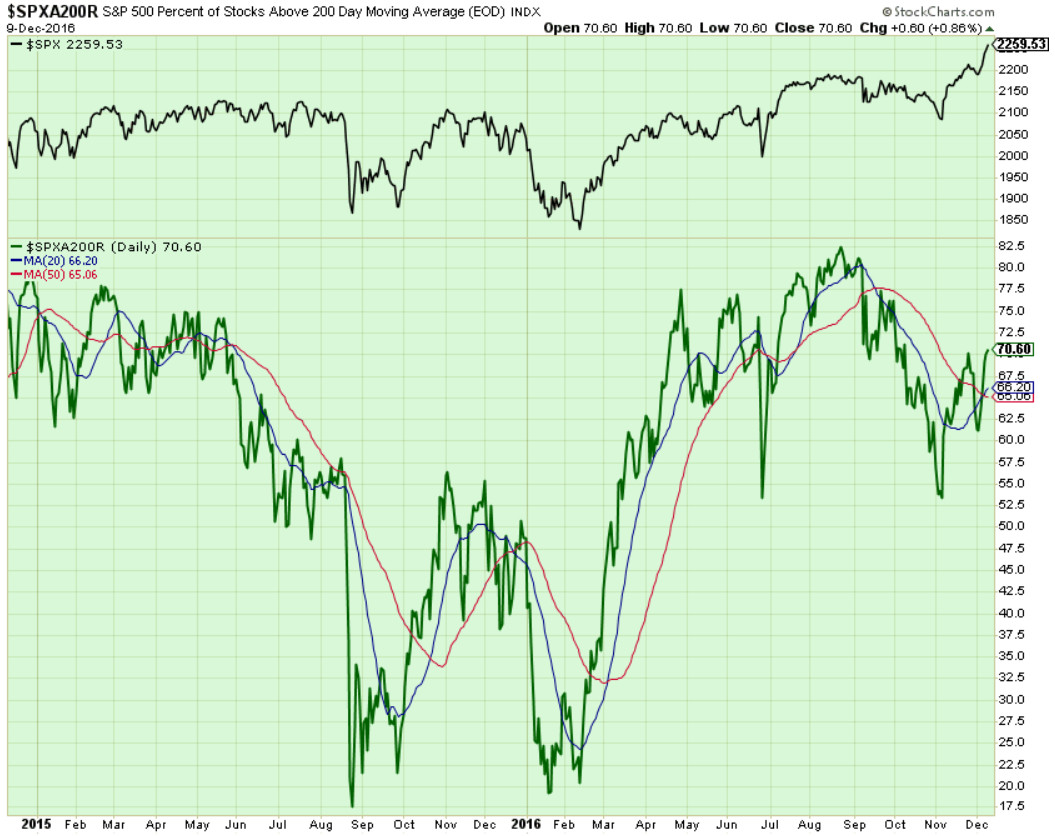
Components of SPX above their respective 200day MA Chart
This scoring indicator continued bounced back hard to 70%. Either this is very close double top (and followed by a sell-off) or a test 75%-77% is in the works. Either way, fasten your harnesses (equivalent of seatbelts in the NAVY).
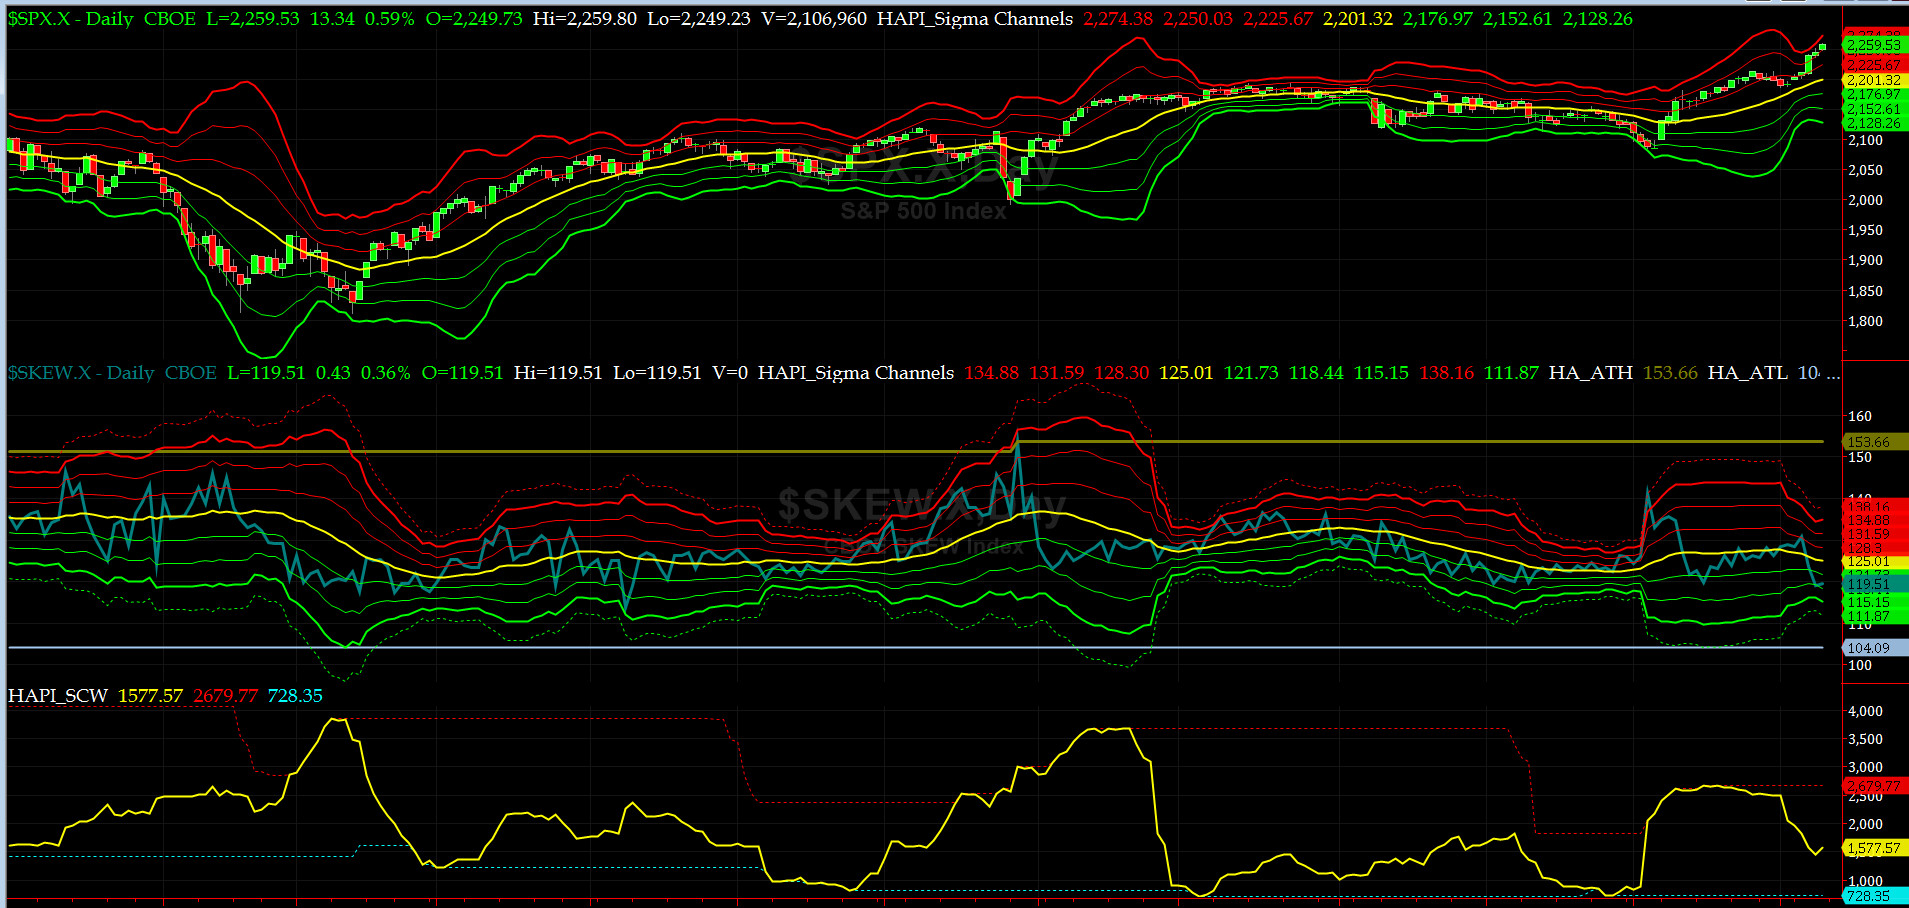
SPX SKEW (Tail Risk) Chart
Last week SPX SKEW (Tail Risk) dropped below its zero sigma level and then closed at 119. (normal = 120-125, range 100-150).
All remain quiet on the Eastern & Mid-Western Fronts.
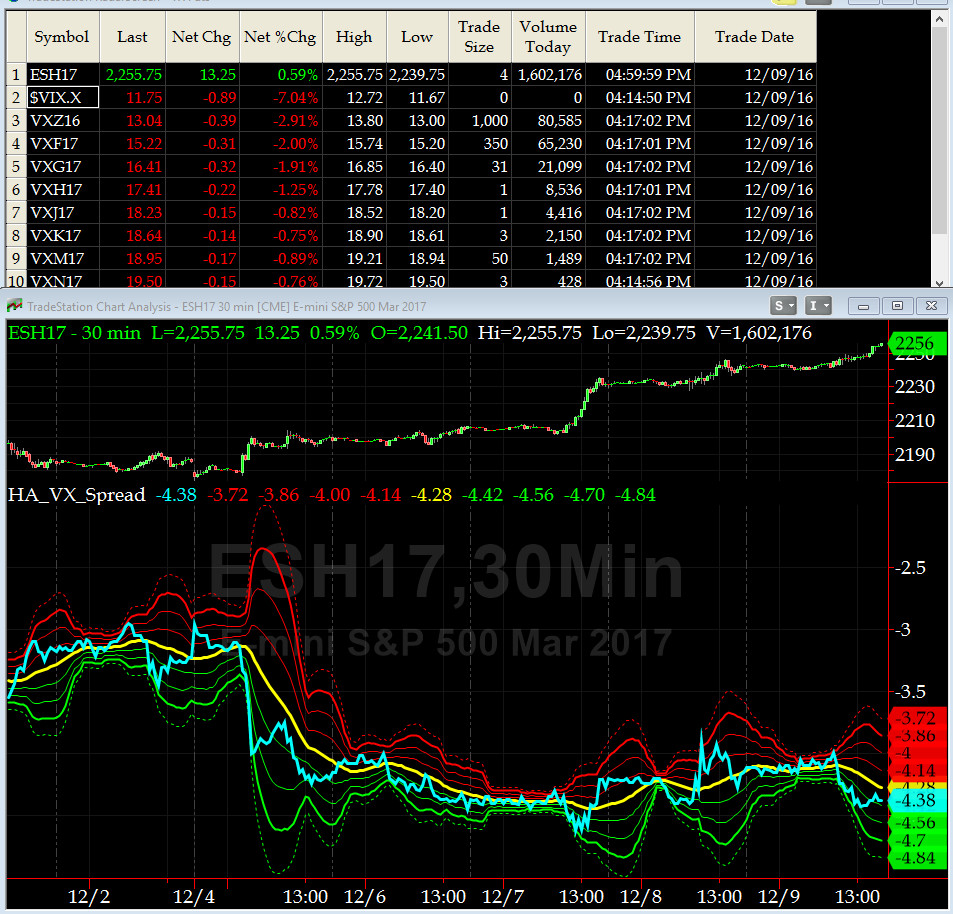
3-month VIX Futures Spread(VX) Chart
Our 3-month VIX Futures Spread (LONG DEC16 & SHORT MAR17) closed at -4.38 on Friday. This spread continues to drop as SPX thrusts higher. @Capt_Tiko asks, when is MECO (NASA term for "Main Engine Cut Off", as the space ship enters its peak orbit) .
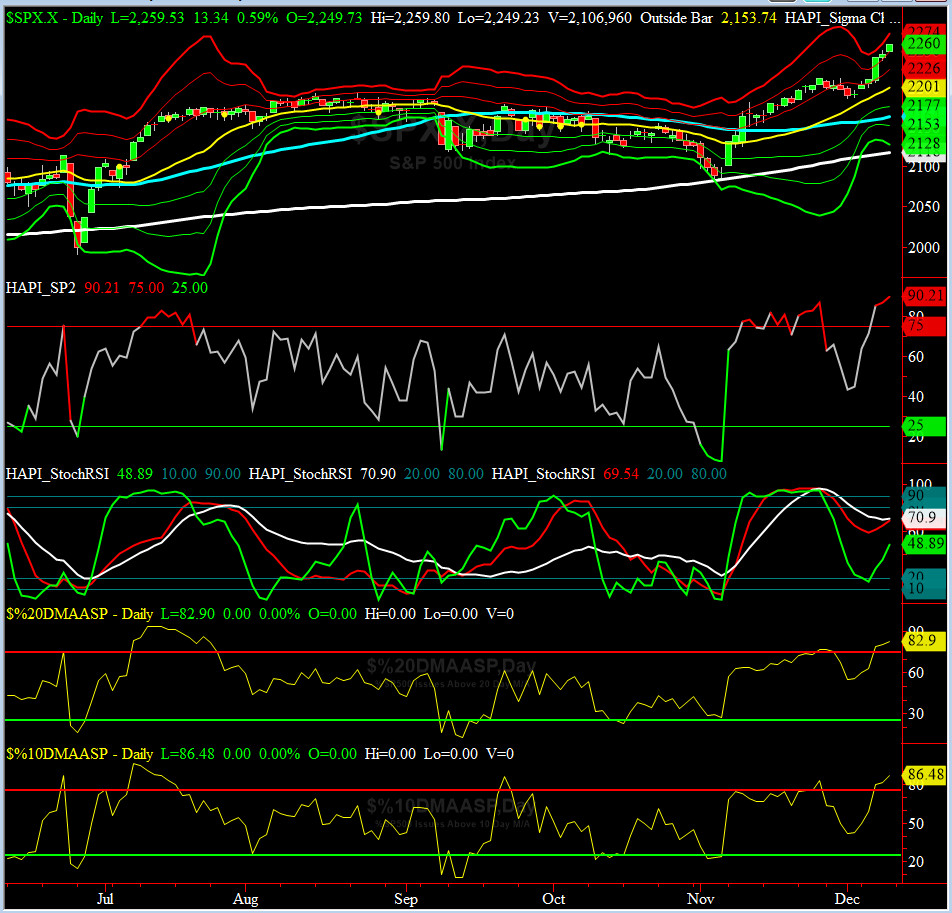
HA_SP2 Chart
HA_SP2 = 90.2 (Buy signal <= 25, Sell Signal >= 75)
With exception of late Q4 1999 and early Q1 2000, we do not recall seeing SP2 this overbought. Check your parachute and/or ejection seat one more time.

US Treasury T-Notes & T-Bonds Yields Chart
The YTMs on Treasury Complex were fairly quiet this past week. Two days from now, these charts should come alive when FOMC meets for last time in 2016.
Fari Hamzei
|
|
|
|
|
|
Customer Care:
|
|
|
|
|
|
|
 |
 |
|
 |
|
 |
 |
 |
HA YouTube Channel ::: HA Blog ::: Testimonials ::: Tutorials & FAQs ::: Privacy Policy
|
Trading Derivatives (Options & Futures) contains substantial risk and is not for every investor. An investor could potentially lose all or more than his/her initial investment.
Only risk capital should be used for trading and only those with sufficient risk capital should consider trading derivatives. Past performance is not
necessarily indicative of future results. Testimonials appearing on this website may not be representative of other clients or customers
and are not a guarantee of future performance or success.
|
| (c) 1998-2025, Hamzei Analytics, LLC.® All Rights Reserved. |
|
|