|
Sunday, December 18, 2016, 1045ET
Market Timing Charts, Analysis & Commentary for Issue #172
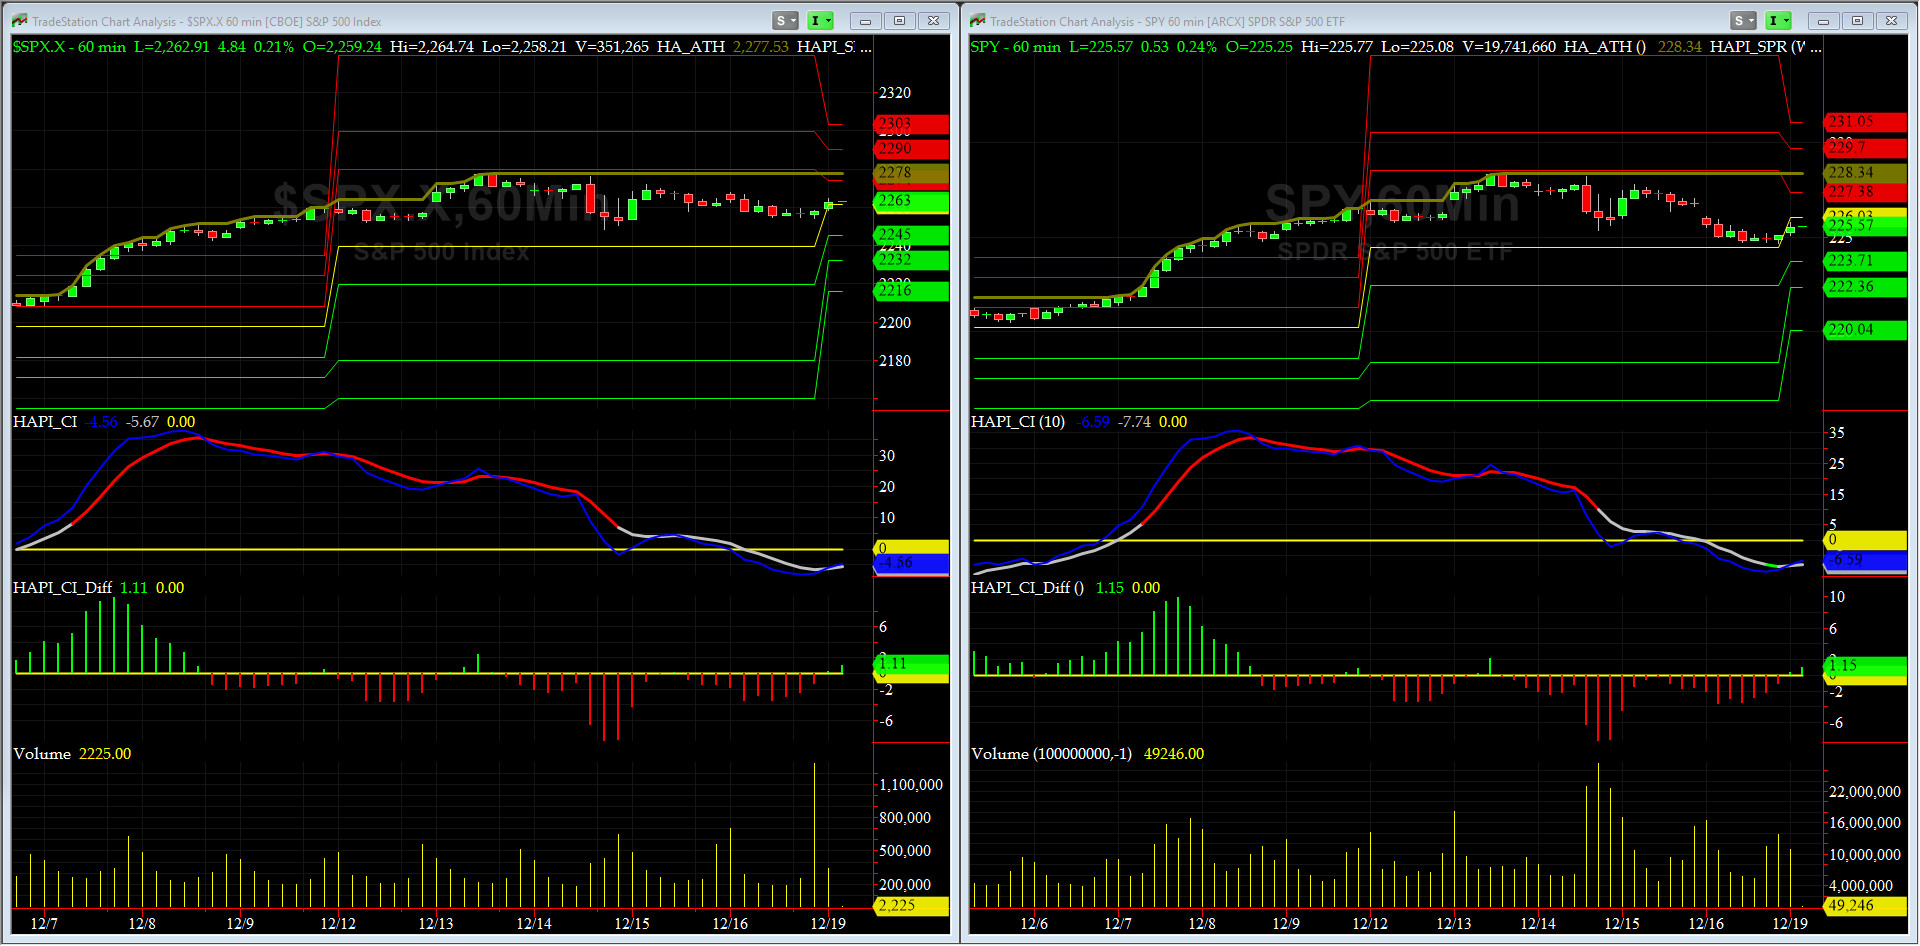
Timer Charts of S&P-500 Cash Index (SPX) + NASDAQ-100 Cash Index (NDX)
Most recent S&P-500 Cash Index (SPX): 2258.07 down -1.46 (down 0%) for the week ending Friday, December 16th, 2016, which closed near its +1 sigma.
SPX ALL TIME INTRADAY HIGH = 2277.53 (reached on Tuesday, December 13, 2016)
SPX ALL TIME CLOSING HIGH = 2271.72 (reached on Tuesday, December 13, 2016)
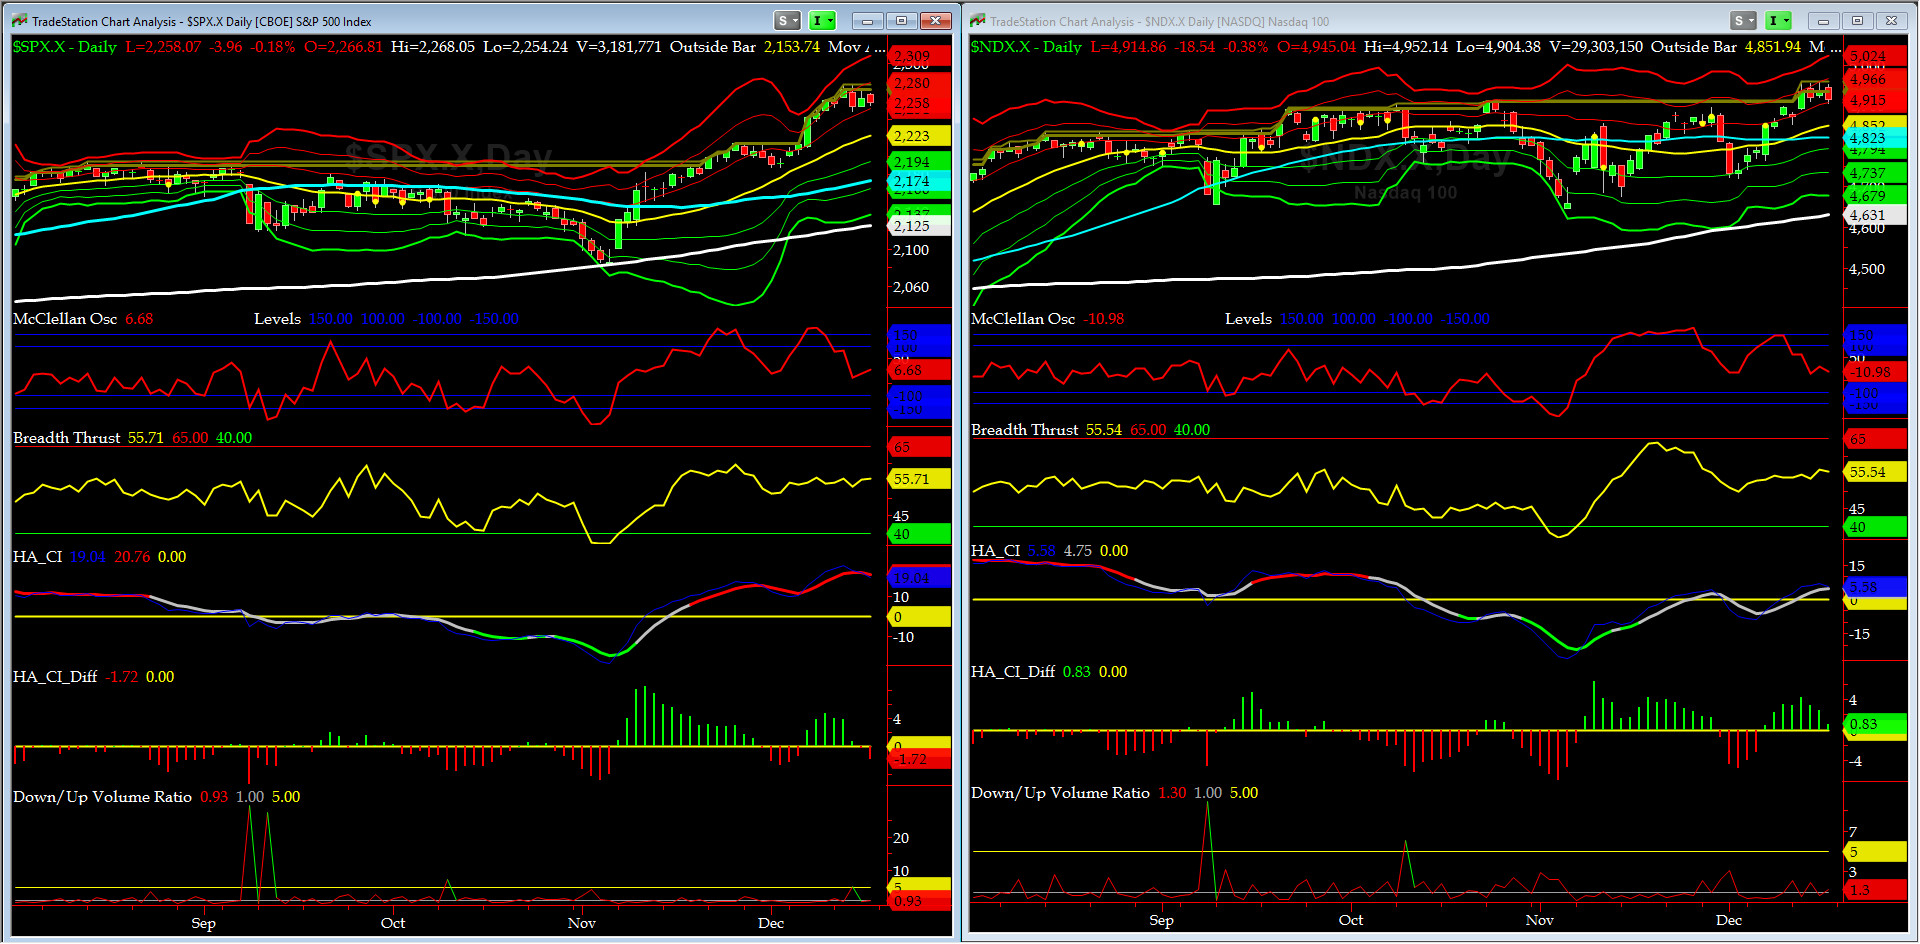
Current DAILY +2 Sigma SPX = 2280 with WEEKLY +2 Sigma = 2252
Current DAILY 0 Sigma (20 day MA) SPX = 2223 with WEEKLY 0 Sigma = 2170
Current DAILY -2 Sigma SPX = 2166 with WEEKLY -2 Sigma = 2089
NYSE McClellan Oscillator = +7 (-150 is start of the O/S area; around -275 to -300 area or lower, we go into the �launch-pad� mode, over +150, we are in O/B area)
NYSE Breadth Thrust = 55.7 (40 is considered as oversold and 65 as overbought)
Overbought readings have abated for the time being.

Canaries [in the Coal Mine] Chart for DJ TRAN & RUT Indices
200-Day MA DJ TRAN = 8001 or 14.6% below DJ TRAN (max observed in last 5 yrs = 20.2%, min = -20.3%)
200-Day MA RUT = 1194 or 14.2% below RUT (max observed in last 5 yrs = 21.3%, min = -22.6%)
DJ Transports (proxy for economic conditions 6 to 9 months hence) is now off 3.4% from its all time high put in last Friday.
Russell 2000 small caps (proxy for Risk ON/OFF) followed in tandem, shedding 2% for the week. RISK continues to remain ON for the time being.

DeTrenders Charts for SPX, NDX, TRAN & RUT Indices
50-Day MA SPX = 2173 or 3.9% below SPX closed on Friday (max observed in last 5 yrs = +8.6%, min = -9.3%)
200-Day MA SPX = 2125 or 6.3% below SPX (max observed in last 5 yrs = 15.2%, min = -14%)
NONE of our eight DeTrenders are negative. The DeTrenders for DJ TRAN & RUT will continue to be harbingers of future price behavior in broad indices.
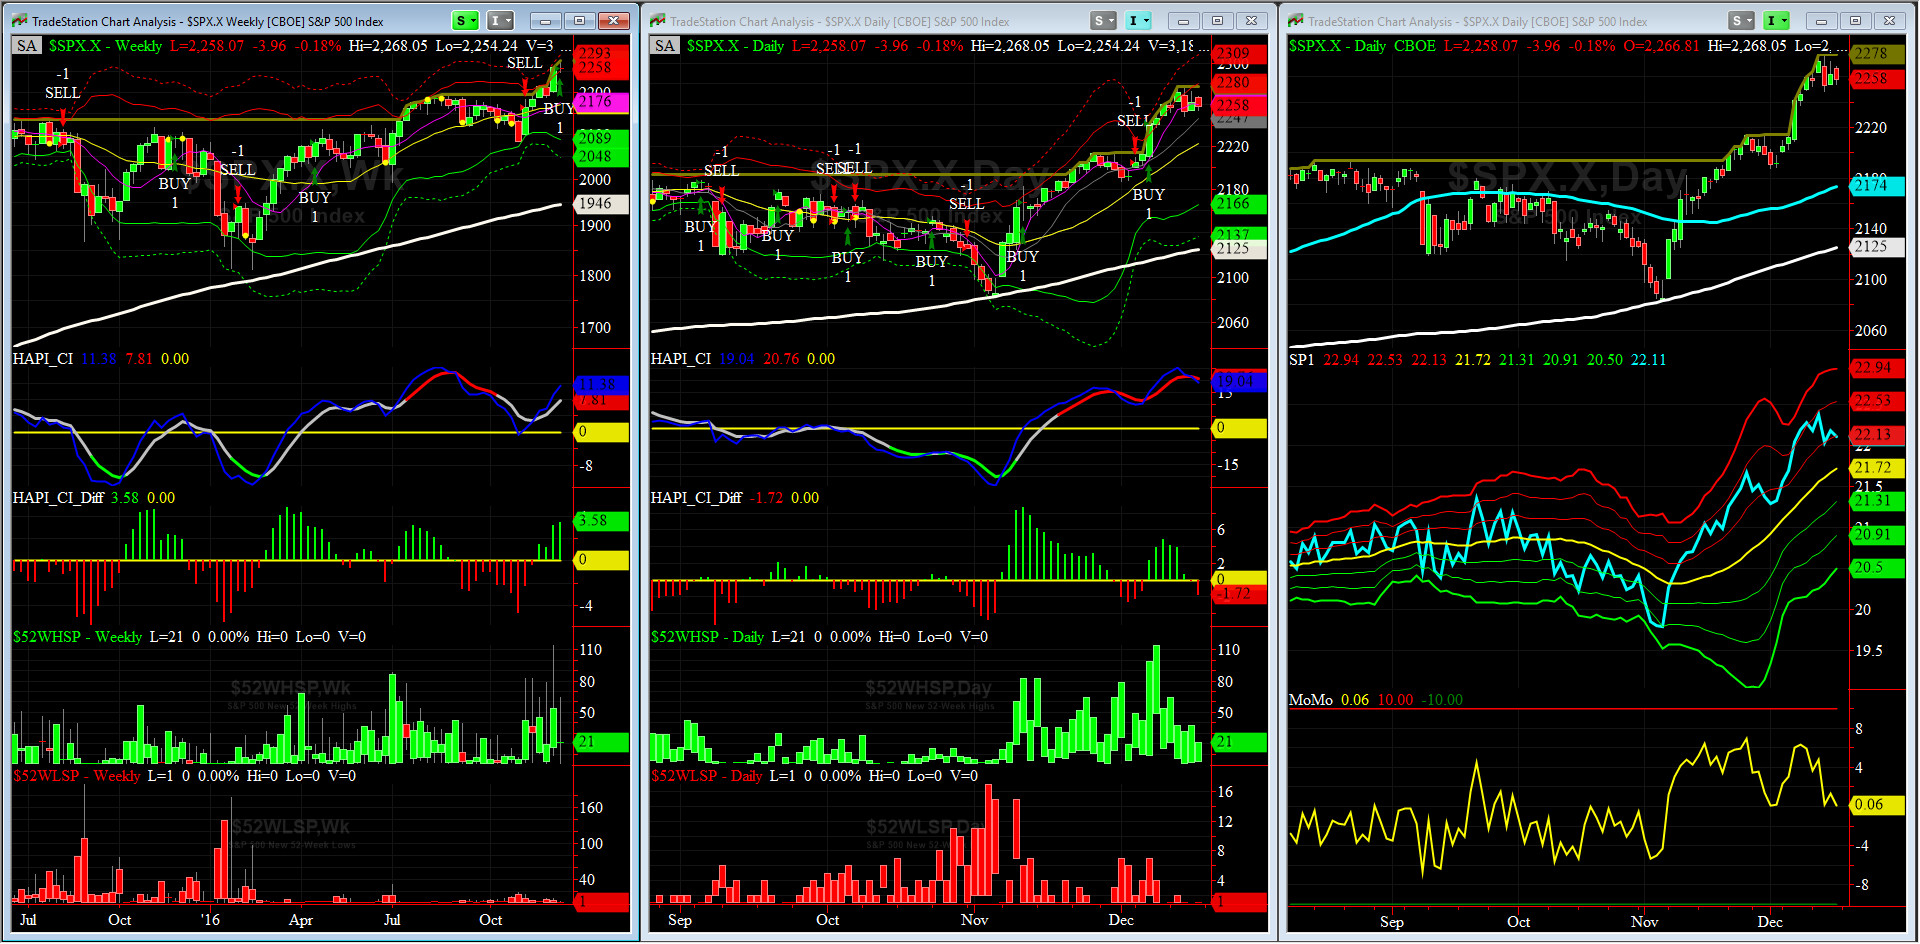
HA_SP1_Momo Chart
WEEKLY Timing Model = on a BUY Signal since Friday 12/16/16 CLOSE at 2258
DAILY Timing Model = on a BUY Signal since Wednesday 12/07/16 CLOSE at 2241
Max SPX 52wk-highs reading last week = 64 (over 120-140, the local maxima is in)
Max SPX 52wk-Lows reading last week = 2 (over 40-60, the local minima is in)
HA_SP1 = very near its +1 sigma channels
HA_Momo = zero (reversals most likely occur above +10 or below -10)
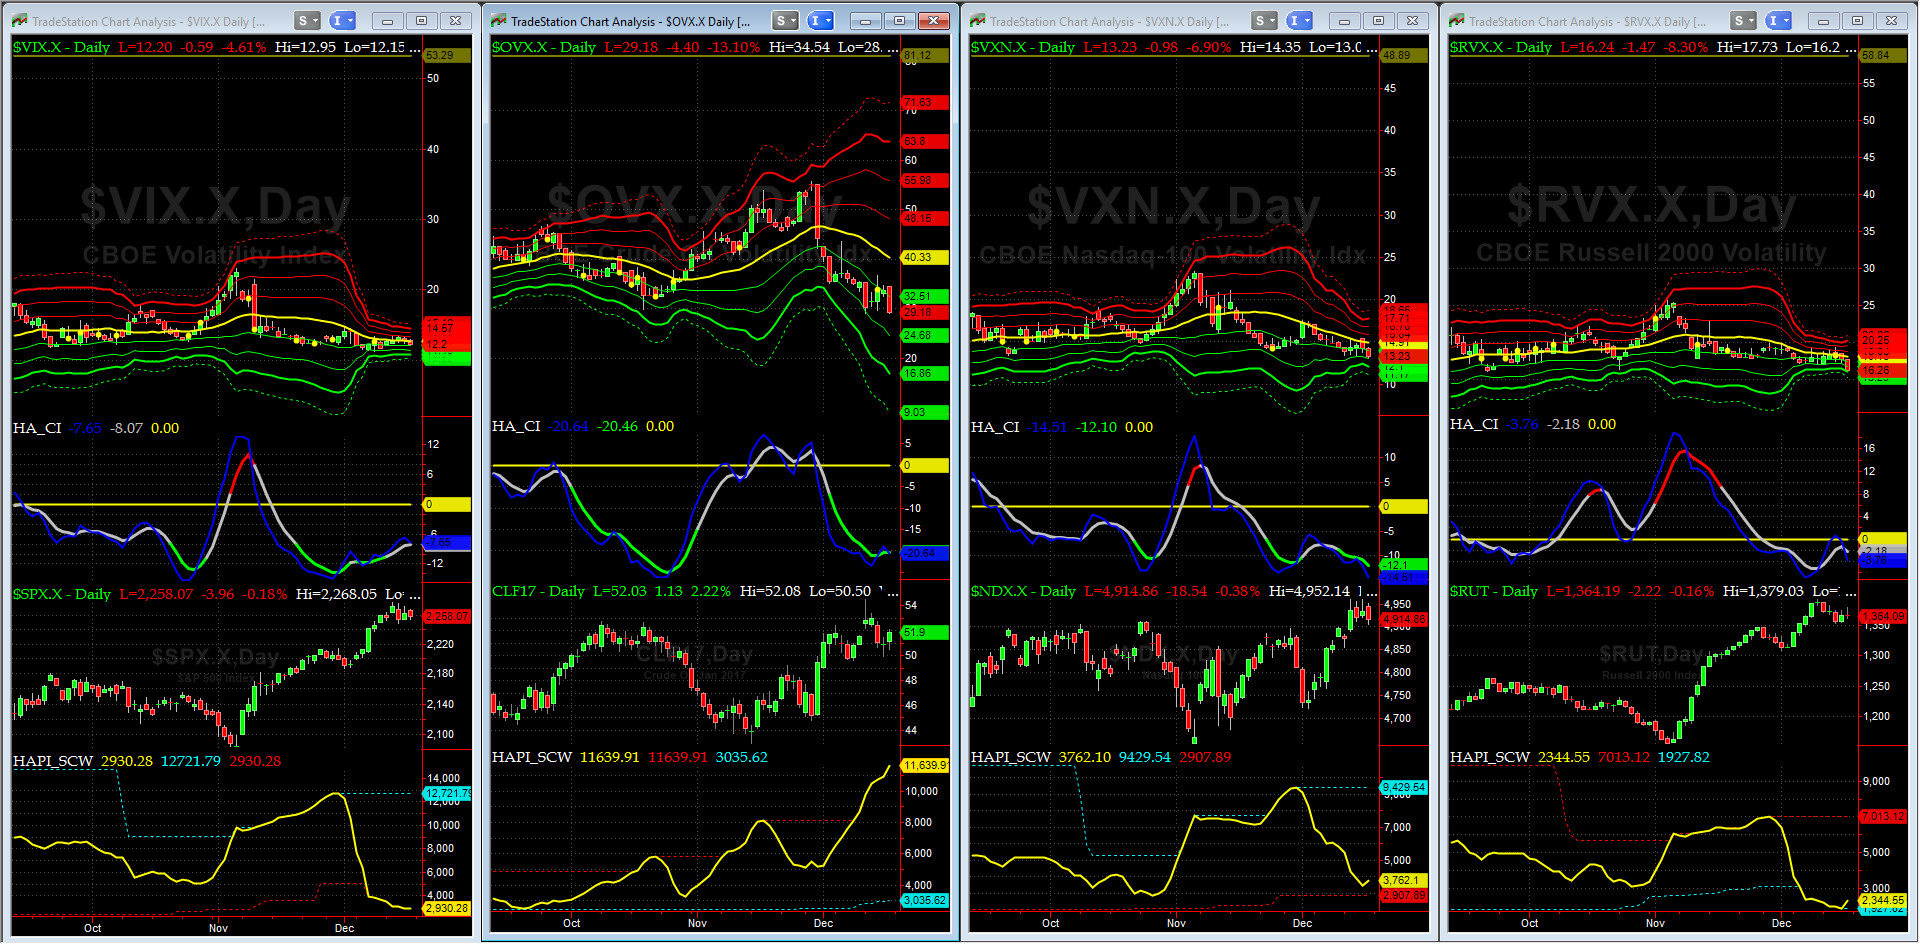
Vol of the Vols Chart
VIX is currently at its zero sigma level at 12.2 (remember it�s the VIX�s vol pattern (its sigma channels) that matters, and not the level of VIX itself (this is per Dr. Robert Whaley, a great mentor and the inventor of original VIX, now called VXO). VIX usually peaks around a test of its +4 sigma).
The final shock wave in VIX has long been faded. Crude Oil Vol continued to drop as Crude Oil futures staged a strong rally post production freeze by OPEC.

5-day TRIN & TRINQ Charts
NYSE 5-day TRIN is in the NEUTRAL zone with NASDAQ going into the SELL zone.
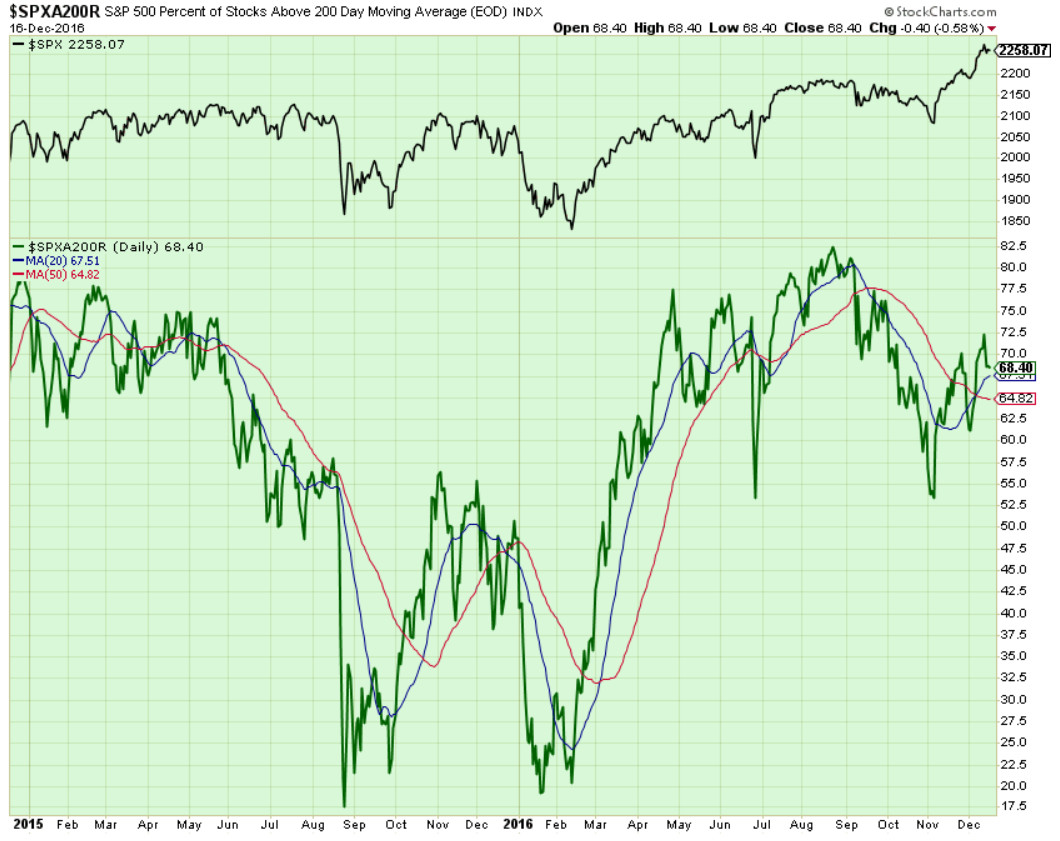
Components of SPX above their respective 200day MA Chart
This scoring indicator retreated to 68%. No signal here (no divergence seen, yet).
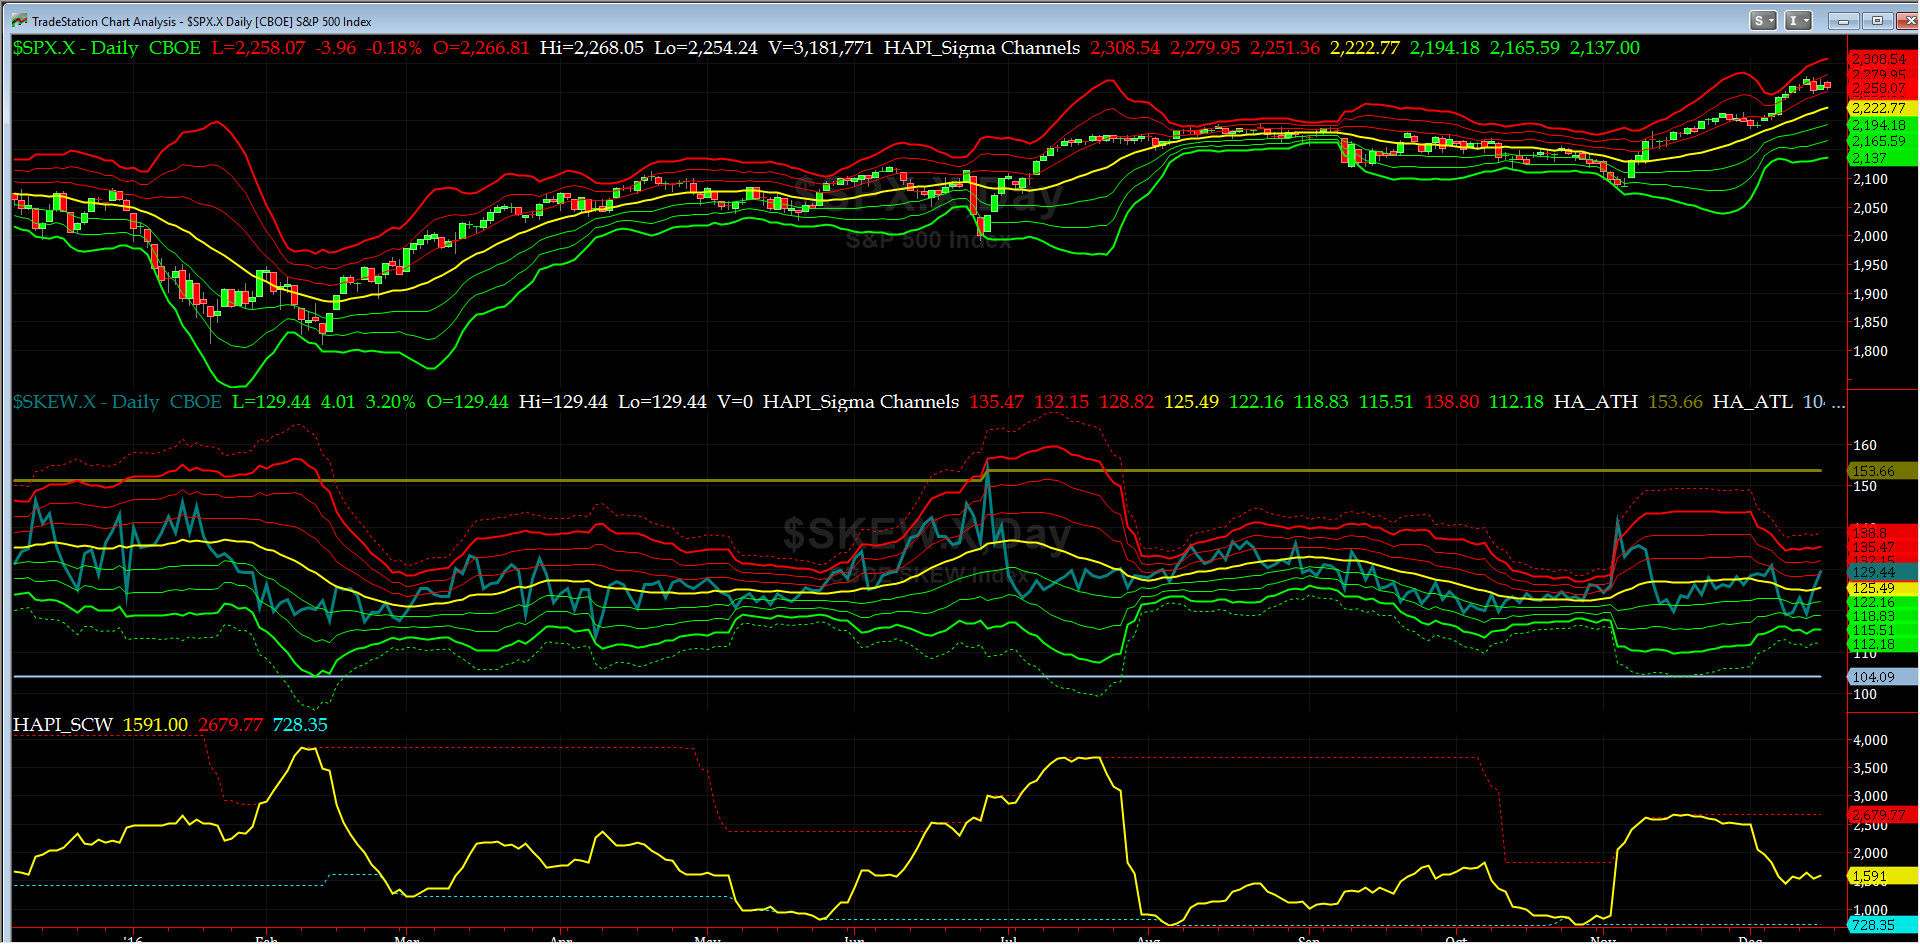
SPX SKEW (Tail Risk) Chart
Last week SPX SKEW (Tail Risk) spiked to its +1 sigma level and then closed at 129. (normal = 120-125, range 100-150).
All remain quiet on the Eastern & Mid-Western Fronts as sigma channels are very tightly spaced.
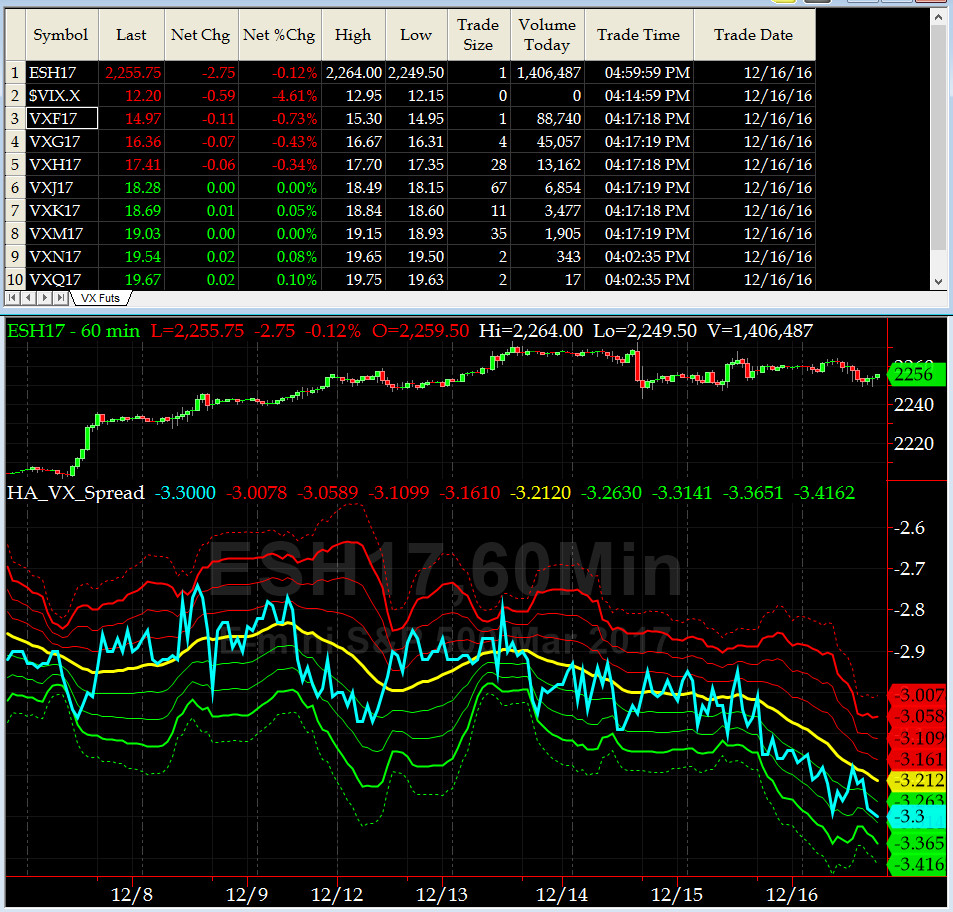
3-month VIX Futures Spread(VX) Chart
This Wednesday DEC VIX Options will expire and our protocol calls for roll over to next contract (JAN) on Friday Close preceding its OX.
So, Our 3-month VIX Futures Spread (LONG JAN17 & SHORT APR17) closed at -3.30 on Friday. This spread continues to drop as SPX thrusts higher. @Capt_Tiko, our XO, asks when is MECO (NASA term for "Main Engine Cut Off", as his spaceship enters its peak orbit).
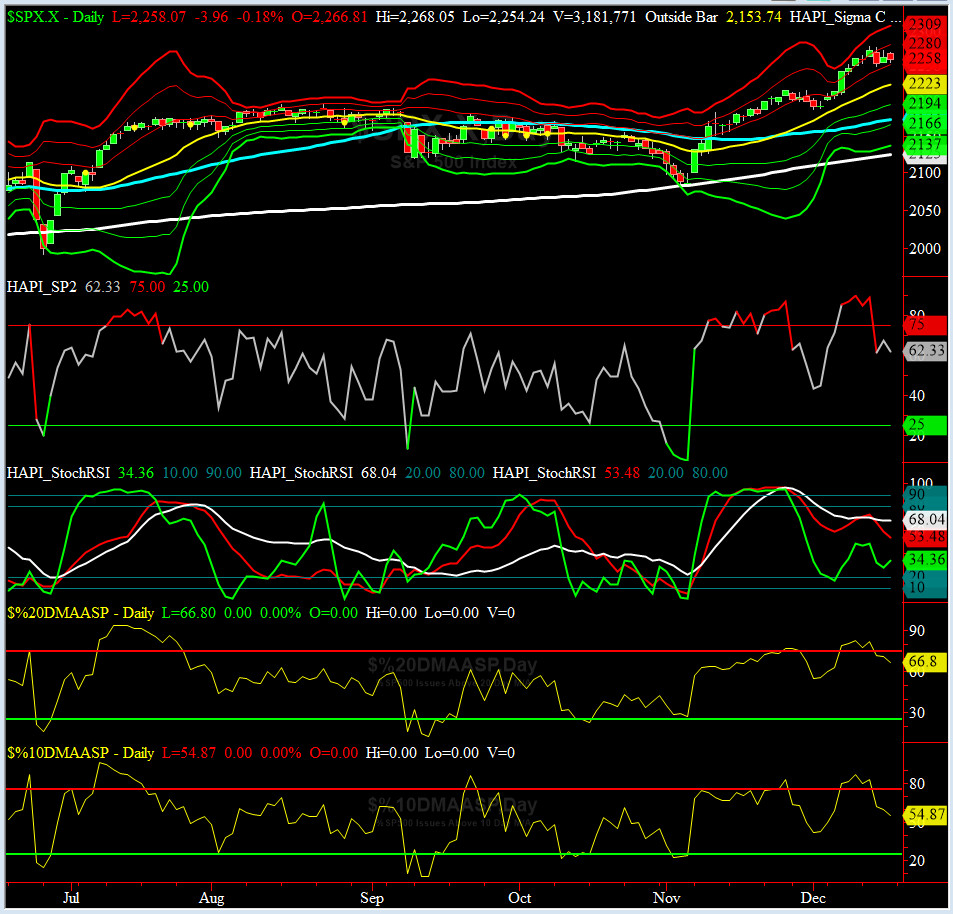
HA_SP2 Chart
HA_SP2 = 62 (Buy signal <= 25, Sell Signal >= 75)
Like clockwork, this indicator pulled back from 92 to 62. Should we see further drop, say past 50, then we could shoot down to 20 area as a short-term test. I love this indicator, been very loyal to me since its inception in '97-'98.
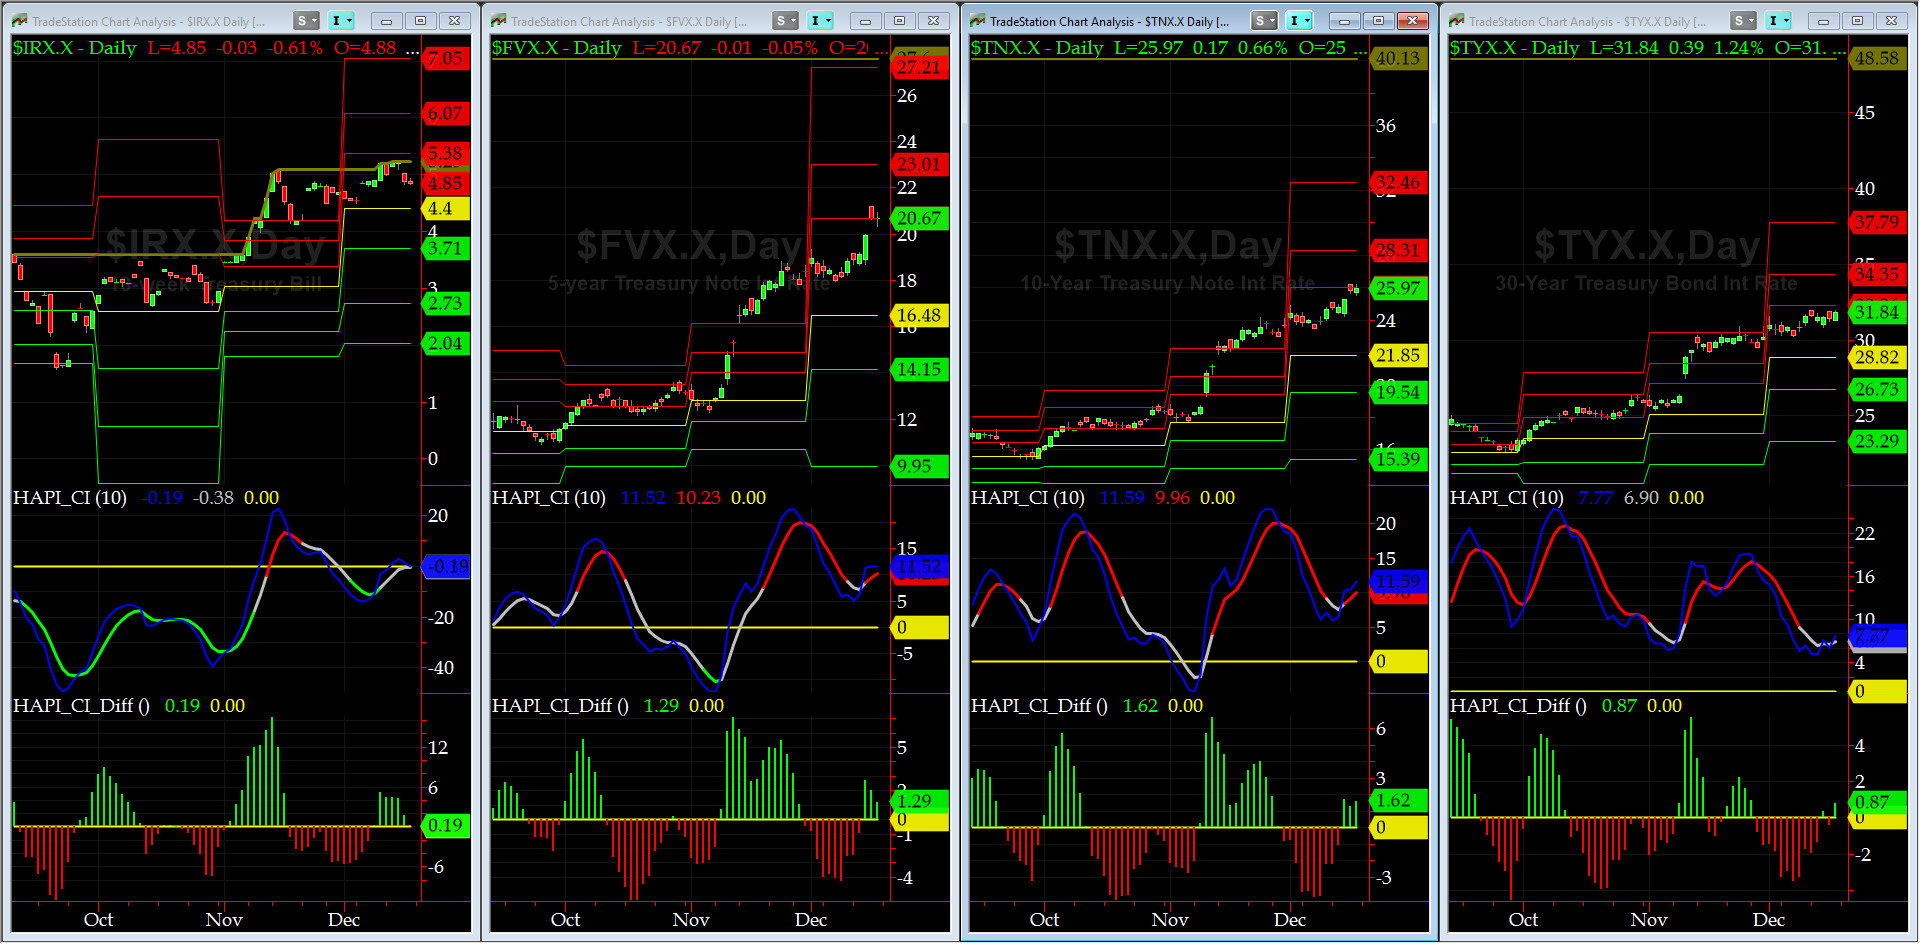
US Treasury T-Notes & T-Bonds Yields Chart
The YTMs on Treasury Complex were fairly quiet this past week post FOMC message from Auntie Janet (oh, it was priced in: surprise, surprise).
Fari Hamzei
|


 Proactive Market Timing