|
Sunday, January 15, 2017, 2200ET
Market Timing Charts, Analysis & Commentary for Issue #176

Timer Charts of S&P-500 Cash Index (SPX) + NASDAQ-100 Cash Index (NDX)
Most recent S&P-500 Cash Index (SPX): 2274.64 down -2.34 (down -0.1%) for the week ending Friday, January 13th, 2017, which closed at its +1 sigma.
SPX ALL TIME INTRADAY HIGH = 2282.10 (reached on Friday, January 6, 2017)
SPX ALL TIME CLOSING HIGH = 2276.98 (reached on Friday, January 6, 2017)
Current DAILY +2 Sigma SPX = 2283 with WEEKLY +2 Sigma = 2299
Current DAILY 0 Sigma (20 day MA) SPX = 2264 with WEEKLY 0 Sigma = 2187
Current DAILY -2 Sigma SPX = 2245 with WEEKLY -2 Sigma = 2075
NYSE McClellan Oscillator = +48 (-150 is start of the O/S area; around -275 to -300 area or lower, we go into the �launch-pad� mode, over +150, we are in O/B area)
NYSE Breadth Thrust = 57.4 (40 is considered as oversold and 65 as overbought)
Last week, SPX failed to provide any significant price action in either direction. We saw a good mount of intraday vol, however, SPX cash closed the week where it started on Jan 6th. Glad we stayed FLAT. NDX displayed a better price action and moved up slightly over 1%, but only after exhibiting some intraday vol.
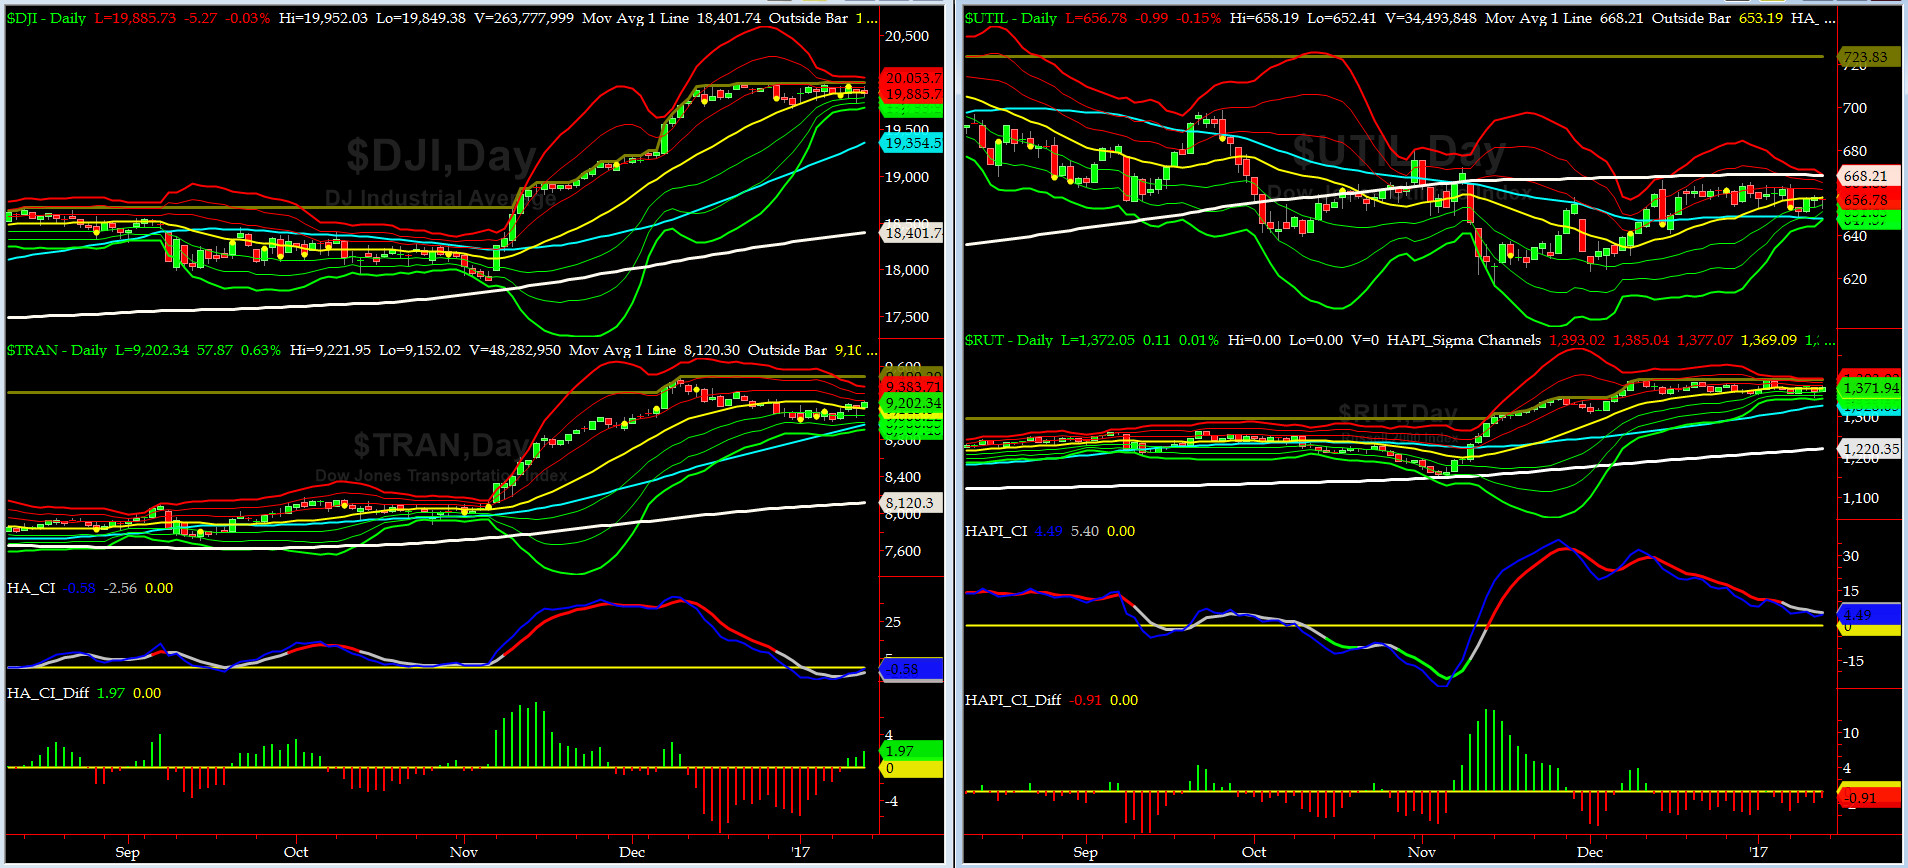
Canaries [in the Coal Mine] Chart for DJ TRAN & RUT Indices
200-Day MA DJ TRAN = 8120 or 12.5% below DJ TRAN (max observed in last 5 yrs = 20.2%, min = -20.3%)
200-Day MA RUT = 1220 or 12.6% below RUT (max observed in last 5 yrs = 21.3%, min = -22.6%)
DJ Transports (proxy for economic conditions 6 to 9 months hence) was tepid as well, after trading with higher vol than normal on the intraday basis.
Russell 2000 small caps (proxy for Risk ON/OFF) stayed confused, as evidenced by either a very tight range, or candlesticks with huge wicks. RISK is still ON, IMHO.

DeTrenders Charts for SPX, NDX, TRAN & RUT Indices
50-Day MA SPX = 2219 or 2.5% below SPX closed on Friday (max observed in last 5 yrs = +8.6%, min = -9.3%)
200-Day MA SPX = 2146 or 6.0% below SPX (max observed in last 5 yrs = 15.2%, min = -14%)
NONE of our eight DeTrenders are negative. The DeTrenders for DJ TRAN & RUT will continue to be harbingers of future price behavior in broad indices.
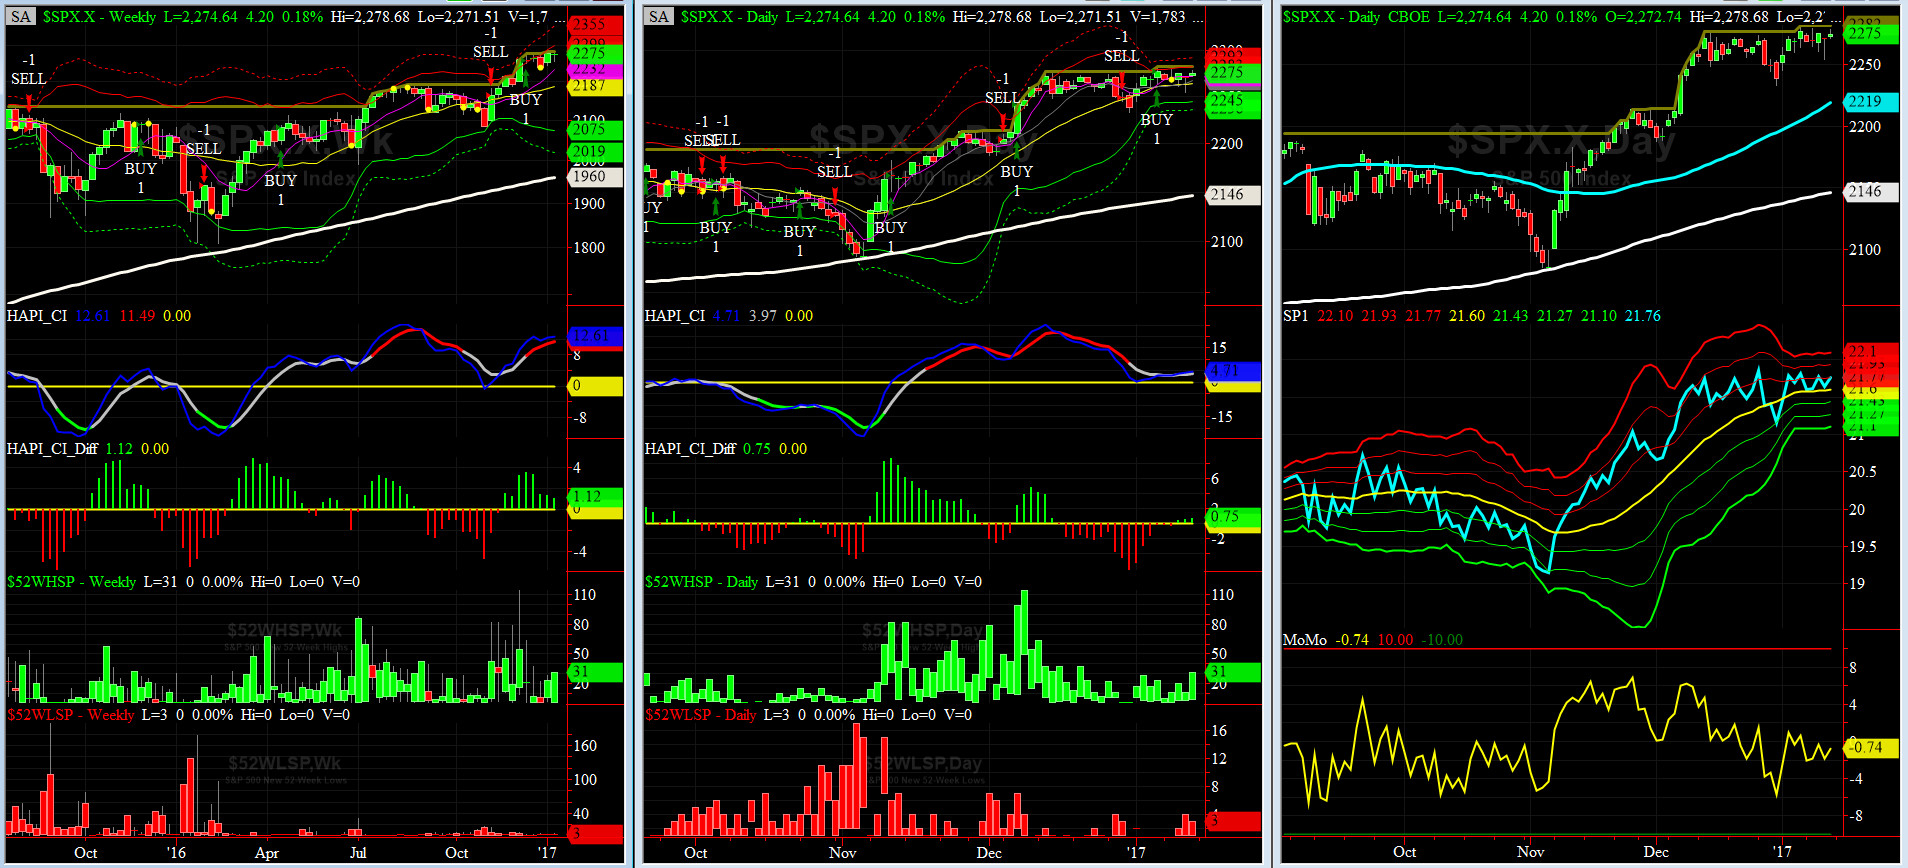
HA_SP1_Momo Chart
WEEKLY Timing Model = on a BUY Signal since Friday 12/16/16 CLOSE at 2258
DAILY Timing Model = on a BUY Signal since Friday 1/6/17 CLOSE at 2277
Max SPX 52wk-highs reading last week = 31 (over 120-140, the local maxima is in)
Max SPX 52wk-Lows reading last week = 4 (over 40-60, the local minima is in)
HA_SP1 at its +1 sigma channels
HA_Momo = -0.7 (reversals most likely occur above +10 or below -10)

Vol of the Vols Chart
VIX is currently at its -1 sigma level at 11.3 (remember it�s the VIX�s vol pattern (its sigma channels) that matters, and not the level of VIX itself (this is per Dr. Robert Whaley, a great mentor and the inventor of original VIX, now called VXO). VIX usually peaks around a test of its +4 sigma).
VIX Complex dropped modestly this past week. The big move was in OVX (crude oil)
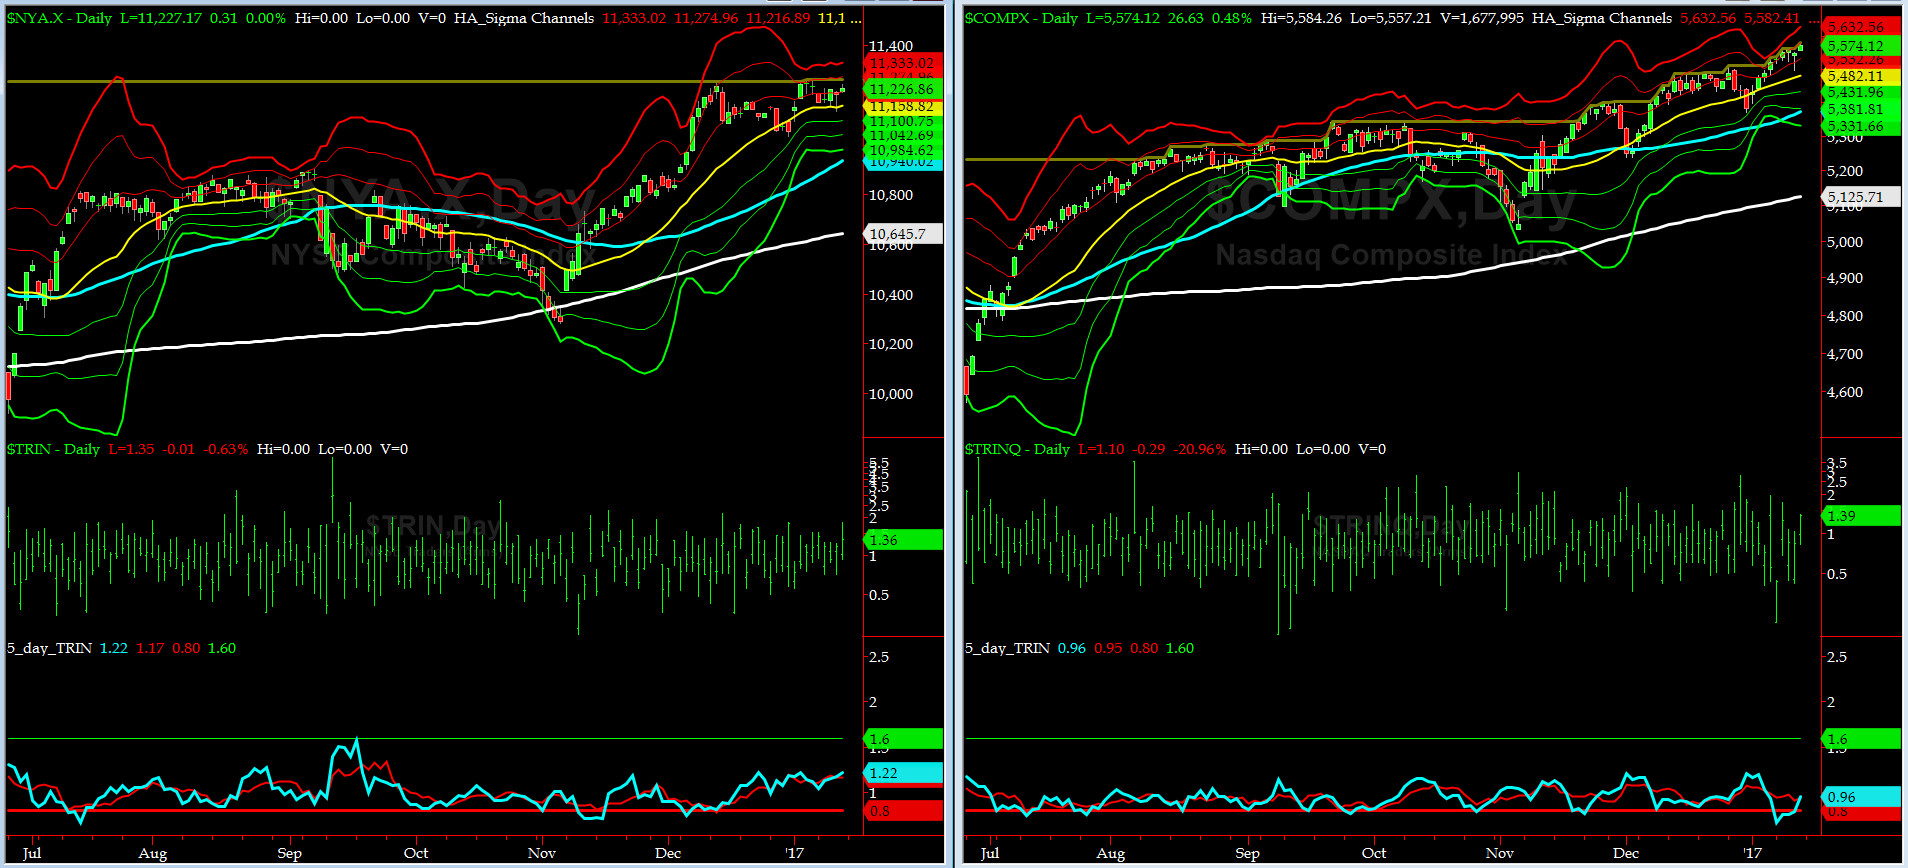
5-day TRIN & TRINQ Charts
Both NYSE & NASDAQ 5-day TRINs are again NEUTRAL for now and the strong SELL signal for NASDAQ on Jan 9th was totally ignored and set aside (Teflon like Reagan or like Trump?).

Components of SPX above their respective 200day MA Chart
This past week, this scoring indicator was flat-lined between 69% to 70%.
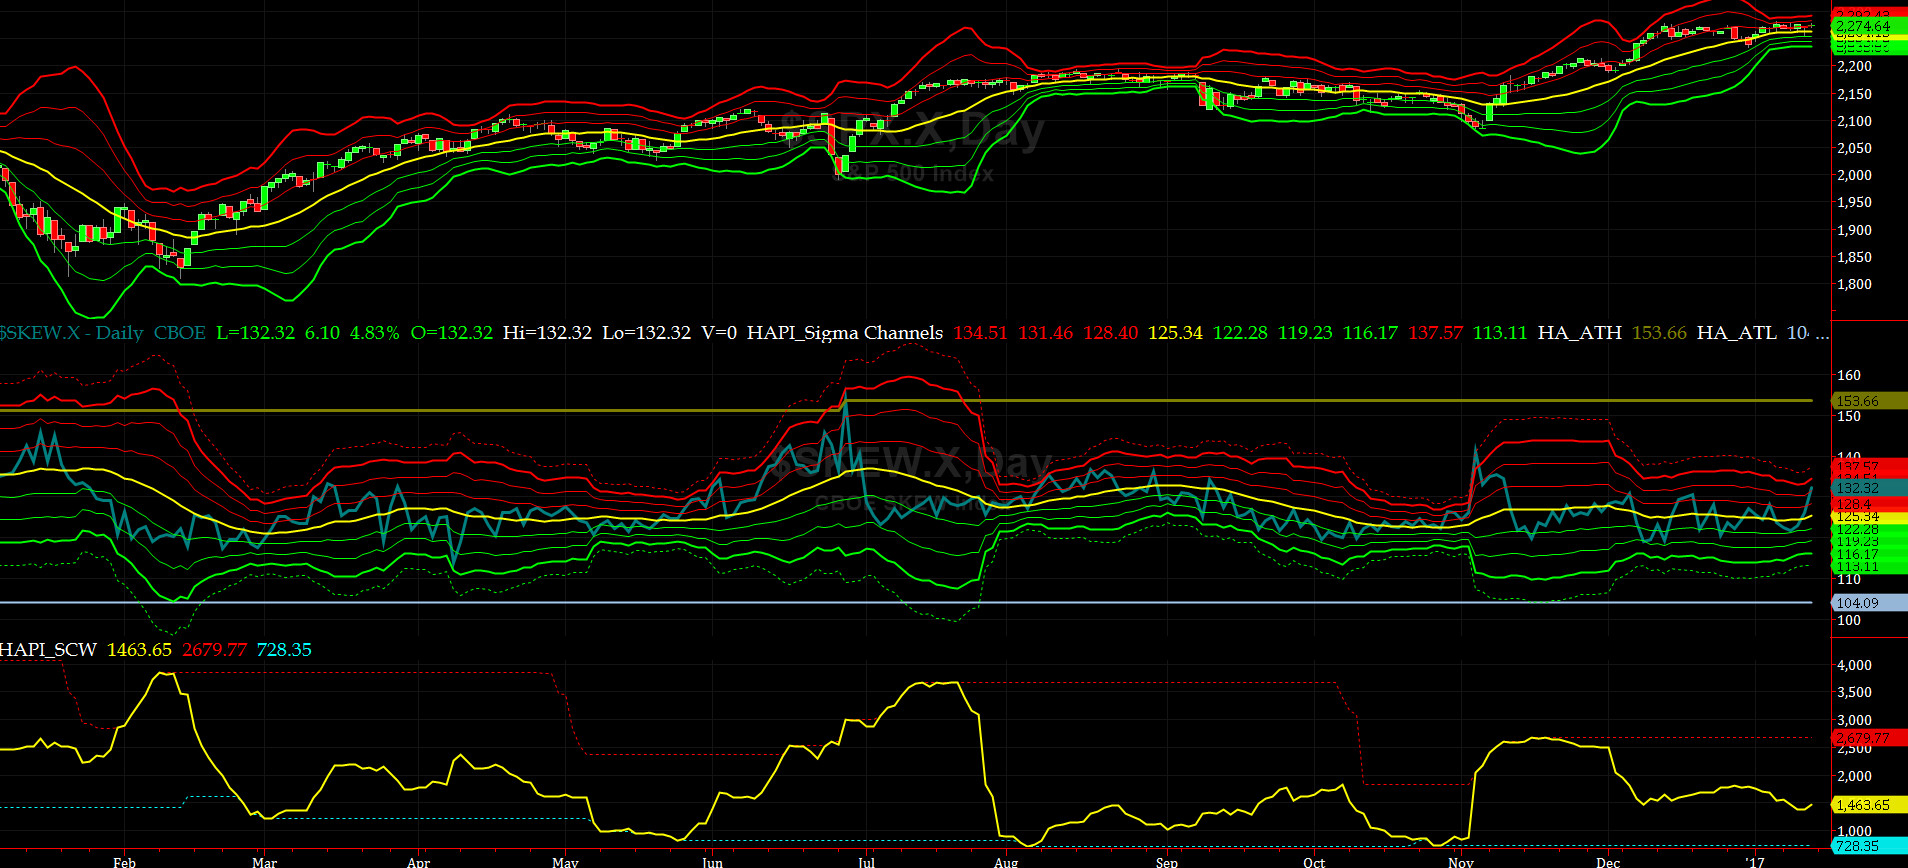
SPX SKEW (Tail Risk) Chart
Last week SPX SKEW (Tail Risk) dropped to -1 sigma and then rose gradually and finally ending at about its +2 sigma at 132. (normal = 120-125, range 100-150).
May be all is not quiet on the Eastern & Mid-Western Fronts.... stay tuned sailors.
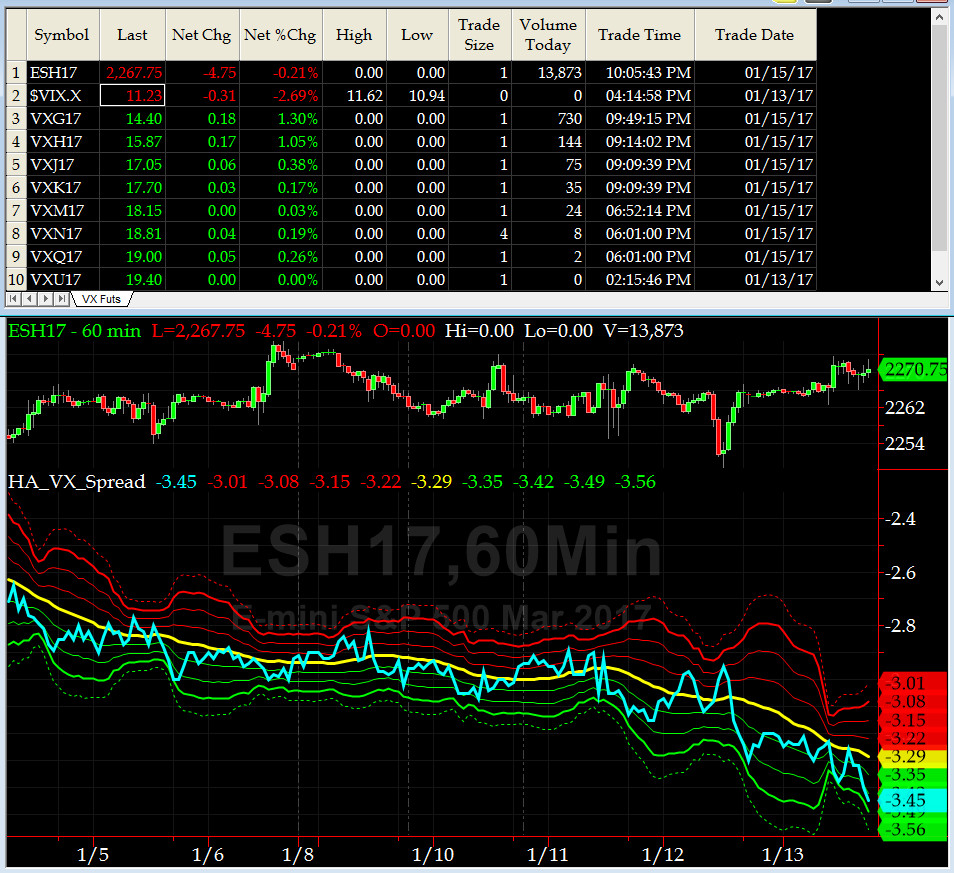
3-month VIX Futures Spread(VX) Chart
Our 3-month VIX Futures Spread (LONG FEB & SHORT MAY as we rolled on Friday from LONG JAN, SHORT APR) dropped gradually each day till it closed at -3.45 on Friday.

HA_SP2 Chart
HA_SP2 = 61 (Buy signal <= 25, Sell Signal >= 75)
SP2 went sideways and ended only slightly lower.
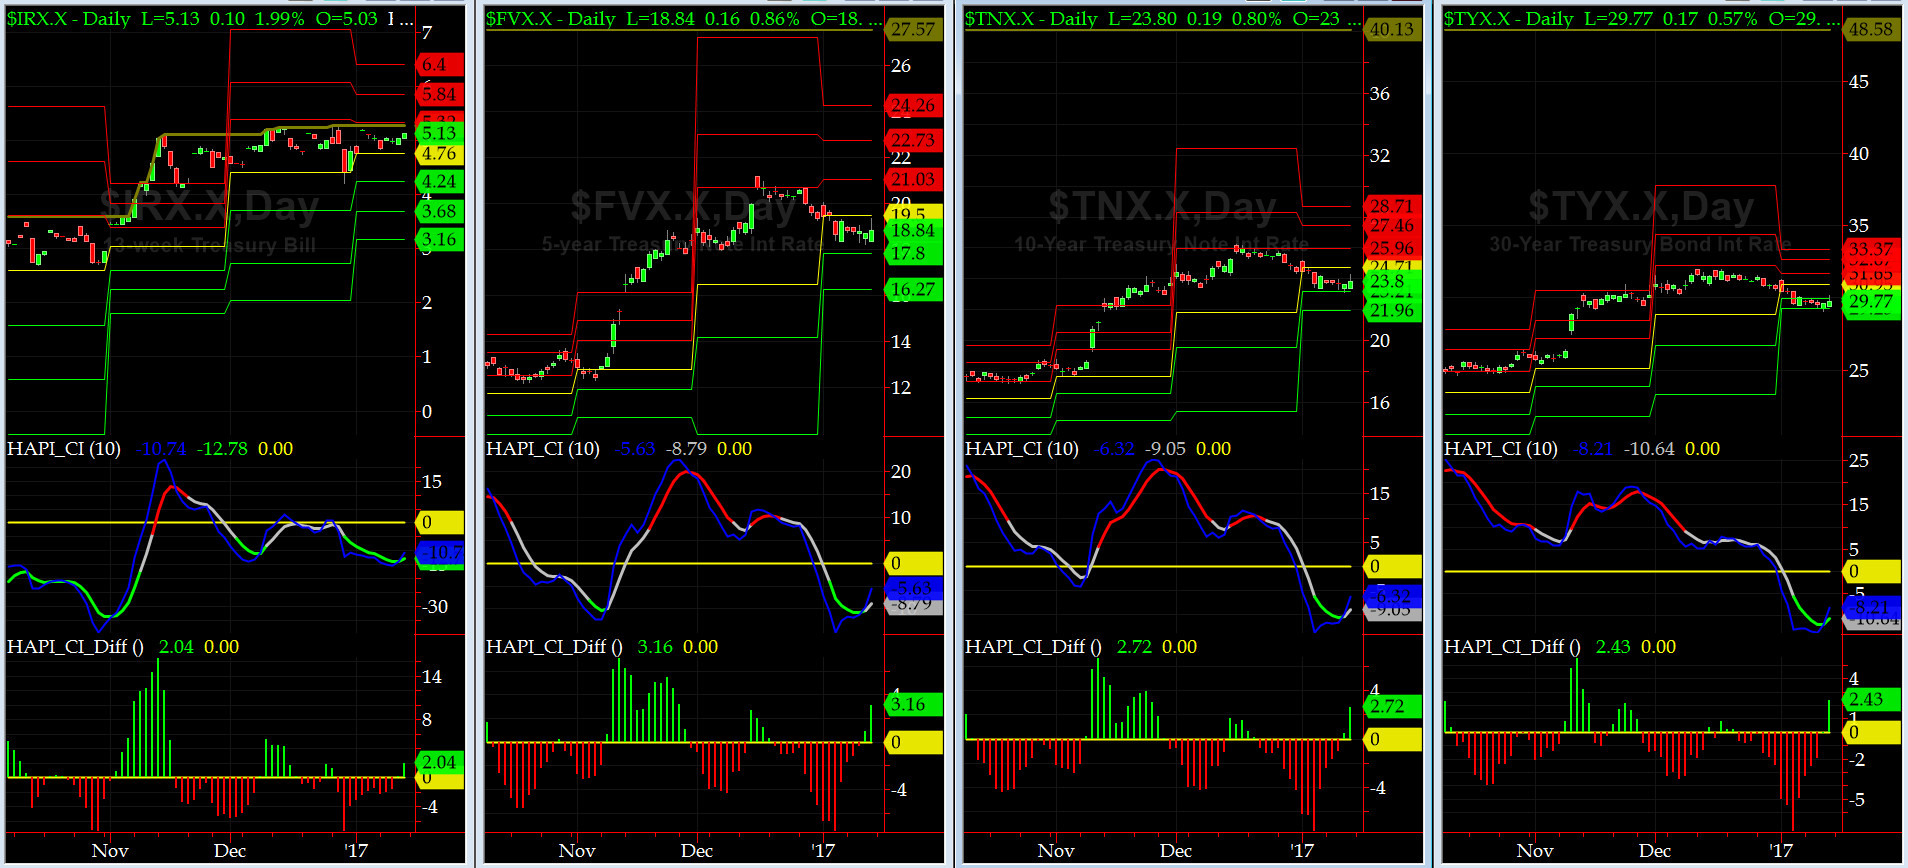
US Treasury T-Notes & T-Bonds Yields Chart
The YTMs on Treasury Complex also had a very tight week specially in the longer end of the Yield Curve.
Fari Hamzei
|


 Proactive Market Timing


