
|
 |
 |
 |
 |
 |
 |
 |
 |
 Proactive Market Timing Proactive Market Timing
|
|
|
Most Recent PMT vs SPX Performance Chart

|
|
|
|
Friday, January 27, 2017, 1040ET
UPDATED HA SP1_momo Chart
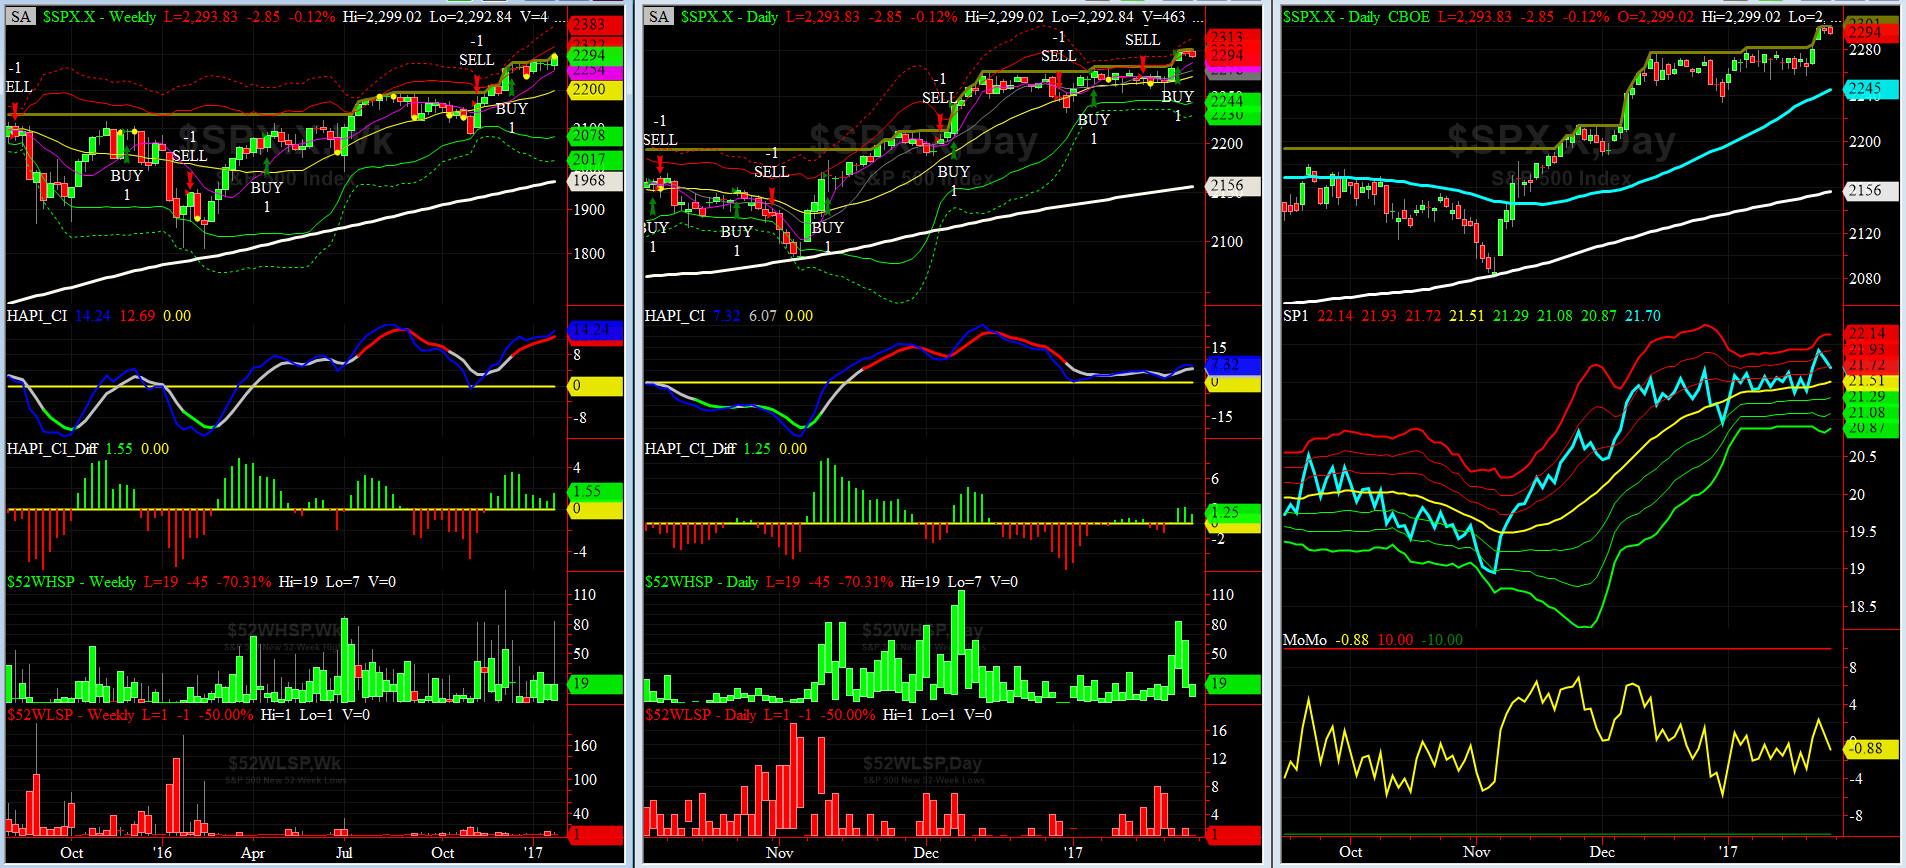
HA_SP1_Momo Chart
WEEKLY Timing Model = on a BUY Signal since Friday 12/16/16 CLOSE at 2258
DAILY Timing Model = on a BUY Signal since Wednesday 1/25/17 CLOSE at 2298
Max SPX 52wk-highs reading last week = 80 (over 120-140, the local maxima is in)
Max SPX 52wk-Lows reading last week = 7 (over 40-60, the local minima is in)
HA_SP1 at about its +1 sigma channels
HA_Momo = -1 (reversals most likely occur above +10 or below -10)
NOTE: SPX has put in a WEEKLY Outside Bar Reversal this week, in line with both of our Timing Models (this is rare), after DAILY Model went LONG SPX after Wednesday Close.
|
|
|
|
|
|
Wednesday, January 25, 2017, 1200ET
REFRESHED Companion Chart for Market Bias Review, Issue #177

|
|
|
|
|
|
Tuesday, January 24, 2017, 2245ET
UPDATED Market Bias for Issue #177
Our current Market Bias with Timer Digest is LONG SPX as of Tues Jan 24 at 2280.07
Our previous Market Bias was SHORT SPX as of Thur Jan 19 at 2263.69
Here are the trade parameters for this week:
SPX Secondary Profit Target = 2320
SPX Primary Profit Target = 2300
SPX BreakEven Stop (Last Close) = 2280
SPX Money Management Stop = 2255
|
| Action |
Asset |
Expiration |
Strike |
Option |
| BUY |
SPY |
02/10/2017 |
227 |
Calls |
| SELL |
SPY |
02/10/2017 |
232 |
Calls |
| You need to execute both legs and hold it as a Call Spread.
|
Note:
Once the Primary Profit Target has been reached, traders are advised to close 75% of their position in order to lock in profits. The remaining balance can be carried over with a BreakEven STOP, based on the SPX level at the time of entry, in order to make the trade a zero-risk trade with the final position running to reach the Secondary Profit Target.
Once either Secondary Profit or Money Management (BreakEven STOP after the 75% peel-off) is hit, our Option/ETF trade for that week is over. Go to Cash and wait for the next PMT Issue.
Fari Hamzei
|
|
|
|
|
|
Tuesday, January 24, 2017, 1544ET
Notice of Change of Market Bias with Timer Digest
Dear Jim,
With the strong move we are witnessing today in basic materials, banks, industrials, automotive & technology we should no longer be SHORT SPX.
Therefore, as of the Close today, we are getting LONG SPX���
Fari Hamzei
|
|
|
|
|
|
Monday, January 23, 2017, 1040ET
Companion Chart for Market Bias Review, Issue #177
|
|
|
|
|
|
Sunday, January 22, 2017, 1845ET
Market Bias for Issue #177
Our current Market Bias with Timer Digest is SHORT SPX as of Thur Jan 19 at 2263.69
Our previous Market Bias was FLAT SPX as of Fri Jan 6 Close at 2276.98
Here are the trade parameters for this week:
SPX Money Management Stop = 2285
SPX BreakEven Stop (Last Close) = 2271
SPX Primary Profit Target = 2250
SPX Secondary Profit Target = 2230
|
| Action |
Asset |
Expiration |
Strike |
Option |
| BUY |
SPY |
02/10/2017 |
227 |
Puts |
| SELL |
SPY |
02/10/2017 |
223 |
Puts |
| You need to execute both legs and hold it as a Put Spread.
|
Note:
Once the Primary Profit Target has been reached, traders are advised to close 75% of their position in order to lock in profits. The remaining balance can be carried over with a BreakEven STOP, based on the SPX level at the time of entry, in order to make the trade a zero-risk trade with the final position running to reach the Secondary Profit Target.
Once either Secondary Profit or Money Management (BreakEven STOP after the 75% peel-off) is hit, our Option/ETF trade for that week is over. Go to Cash and wait for the next PMT Issue.
Fari Hamzei
|
|
|
|
|
|
Sunday, January 22, 2017, 1130ET
Market Timing Charts, Analysis & Commentary for Issue #177
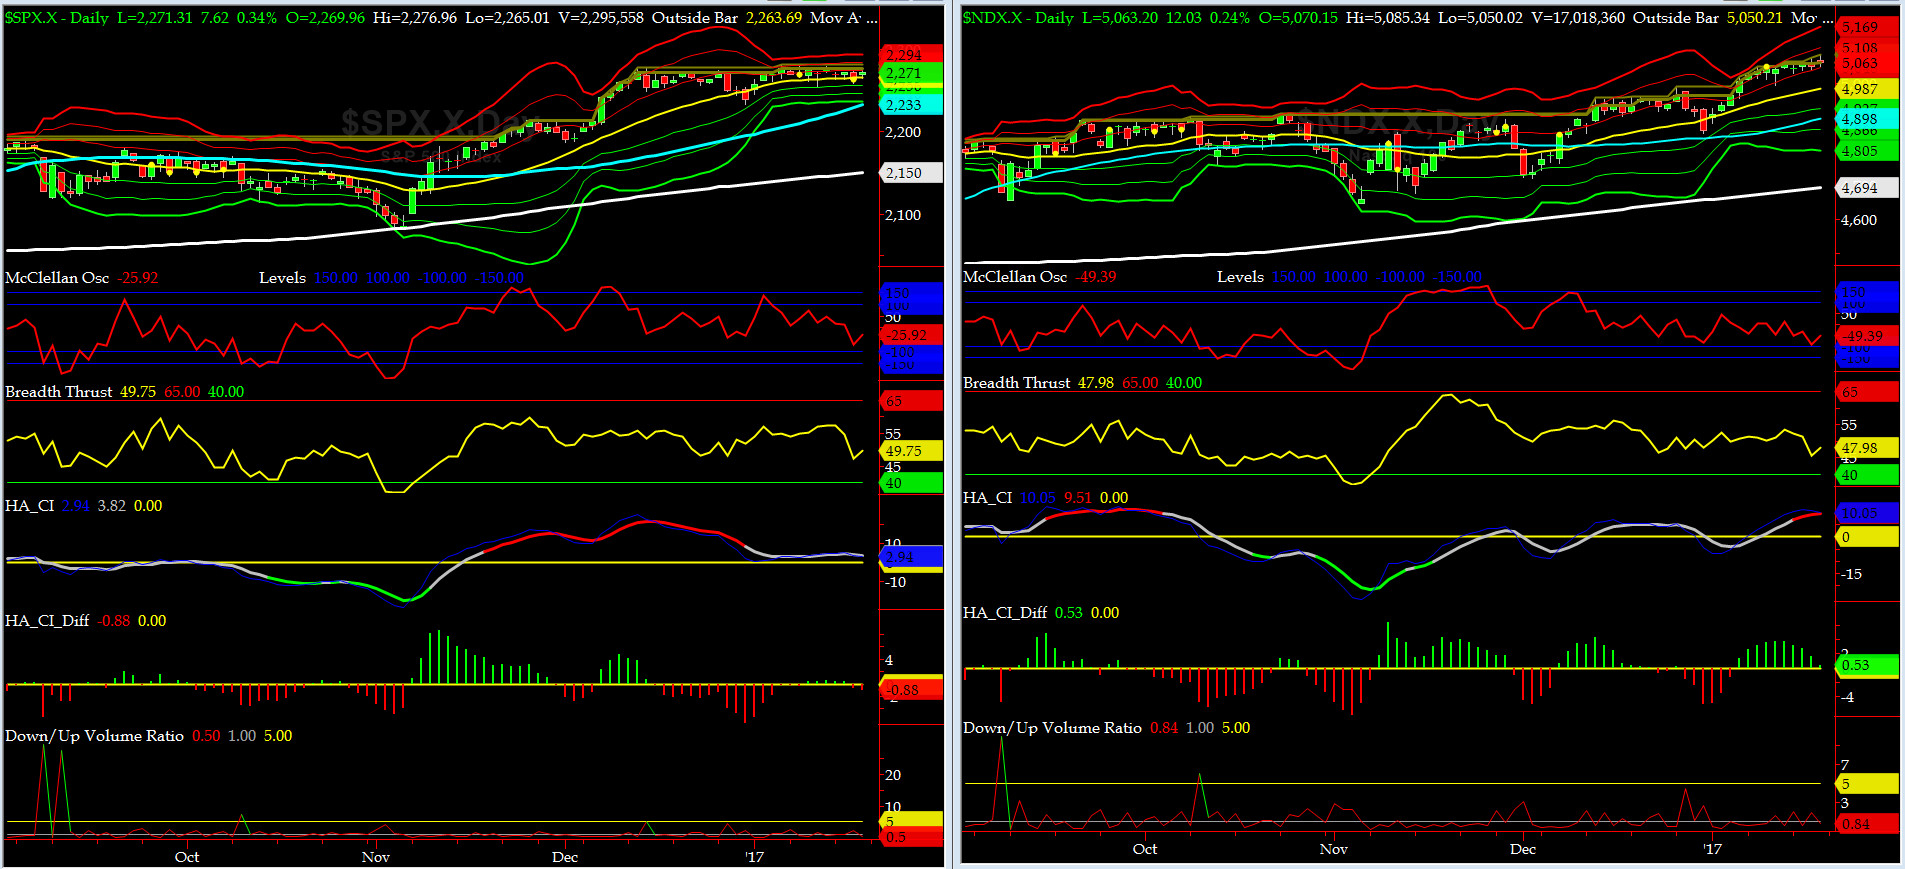
Timer Charts of S&P-500 Cash Index (SPX) + NASDAQ-100 Cash Index (NDX)
Most recent S&P-500 Cash Index (SPX): 2271.31 down -3.33 (down -0.15%) for the week ending Friday, January 20th, 2017, closed near its +1 sigma.
SPX ALL TIME INTRADAY HIGH = 2282.10 (reached on Friday, January 6, 2017)
SPX ALL TIME CLOSING HIGH = 2276.98 (reached on Friday, January 6, 2017)
Current DAILY +2 Sigma SPX = 2284 with WEEKLY +2 Sigma = 2310
Current DAILY 0 Sigma (20 day MA) SPX = 2265 with WEEKLY 0 Sigma = 2192
Current DAILY -2 Sigma SPX = 2246 with WEEKLY -2 Sigma = 2074
NYSE McClellan Oscillator = -26 (-150 is start of the O/S area; around -275 to -300 area or lower, we go into the �launch-pad� mode, over +150, we are in O/B area)
NYSE Breadth Thrust = 49.75 (40 is considered as oversold and 65 as overbought)
Once again, SPX failed to provide any price expansion in either direction. We saw a good amount of intraday vol, specially before and after inauguration of DJT 45.
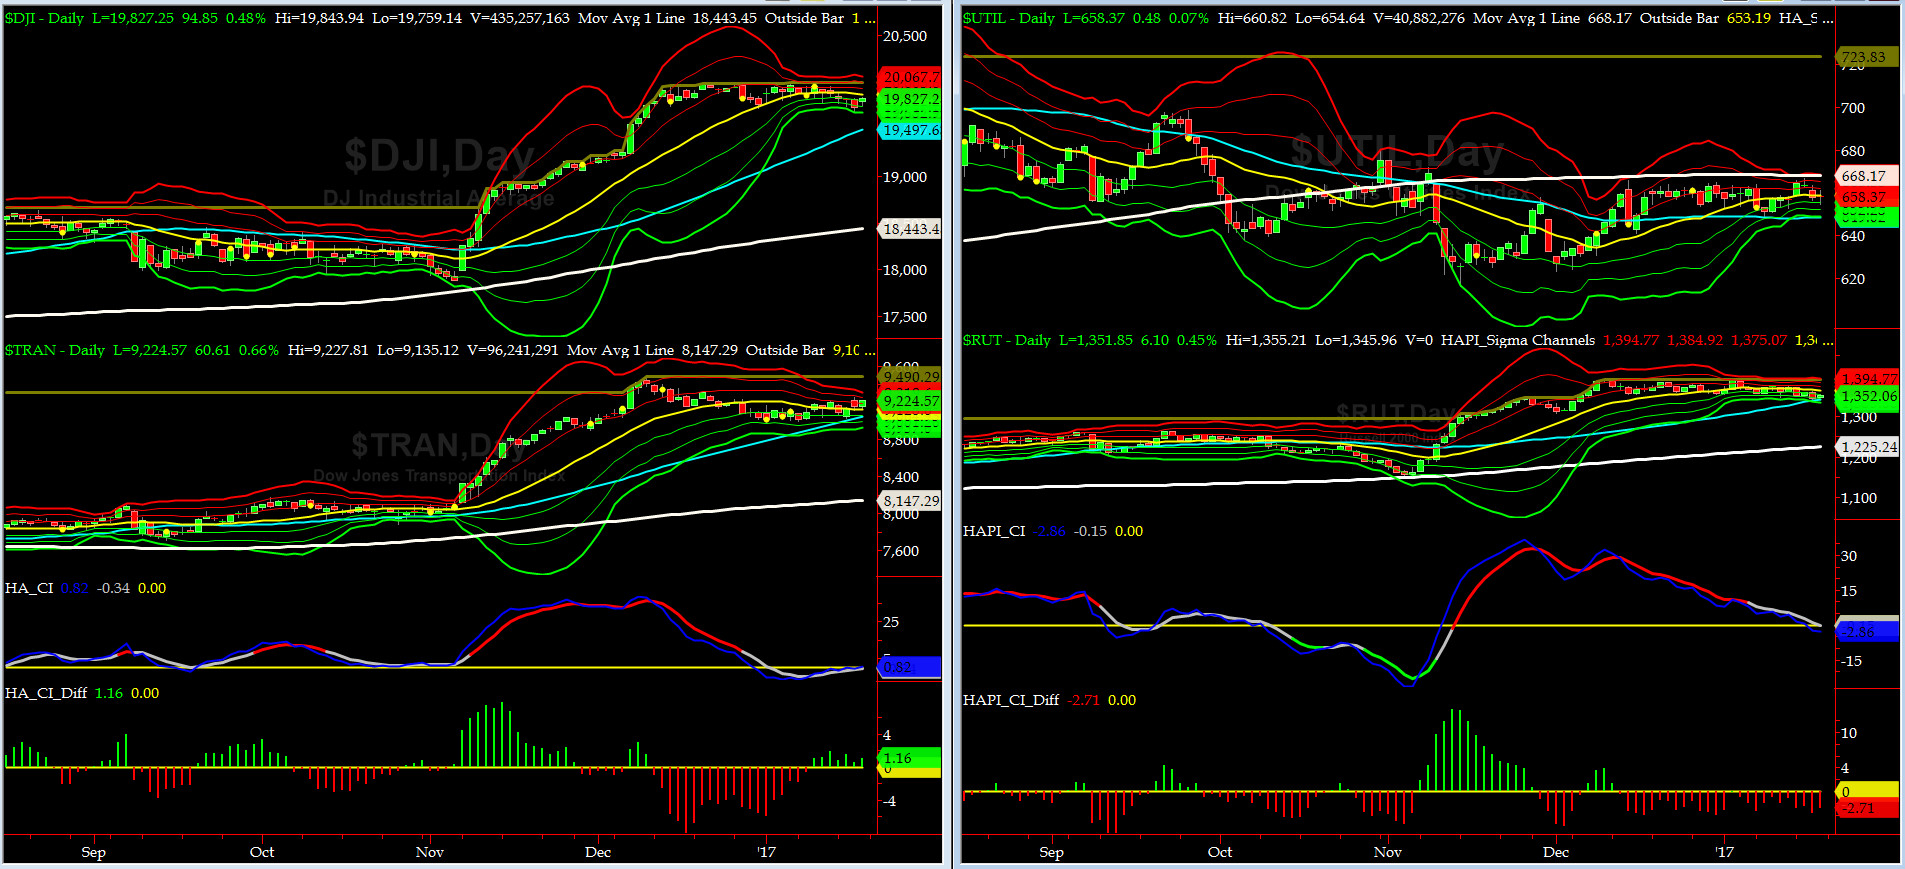
Canaries [in the Coal Mine] Chart for DJ TRAN & RUT Indices
200-Day MA DJ TRAN = 8147 or 13.2% below DJ TRAN (max observed in last 5 yrs = 20.2%, min = -20.3%)
200-Day MA RUT = 1225 or 10.4% below RUT (max observed in last 5 yrs = 21.3%, min = -22.6%)
DJ Transports ( proxy for economic conditions 6 to 9 months hence) has a minuscule uptick, amid a noisy trading backdrop.
Russell 2000 small caps ( proxy for Risk ON/OFF) sold off steadily last week. Risk is still ON, albeit, momentum reverting back, IOHO.
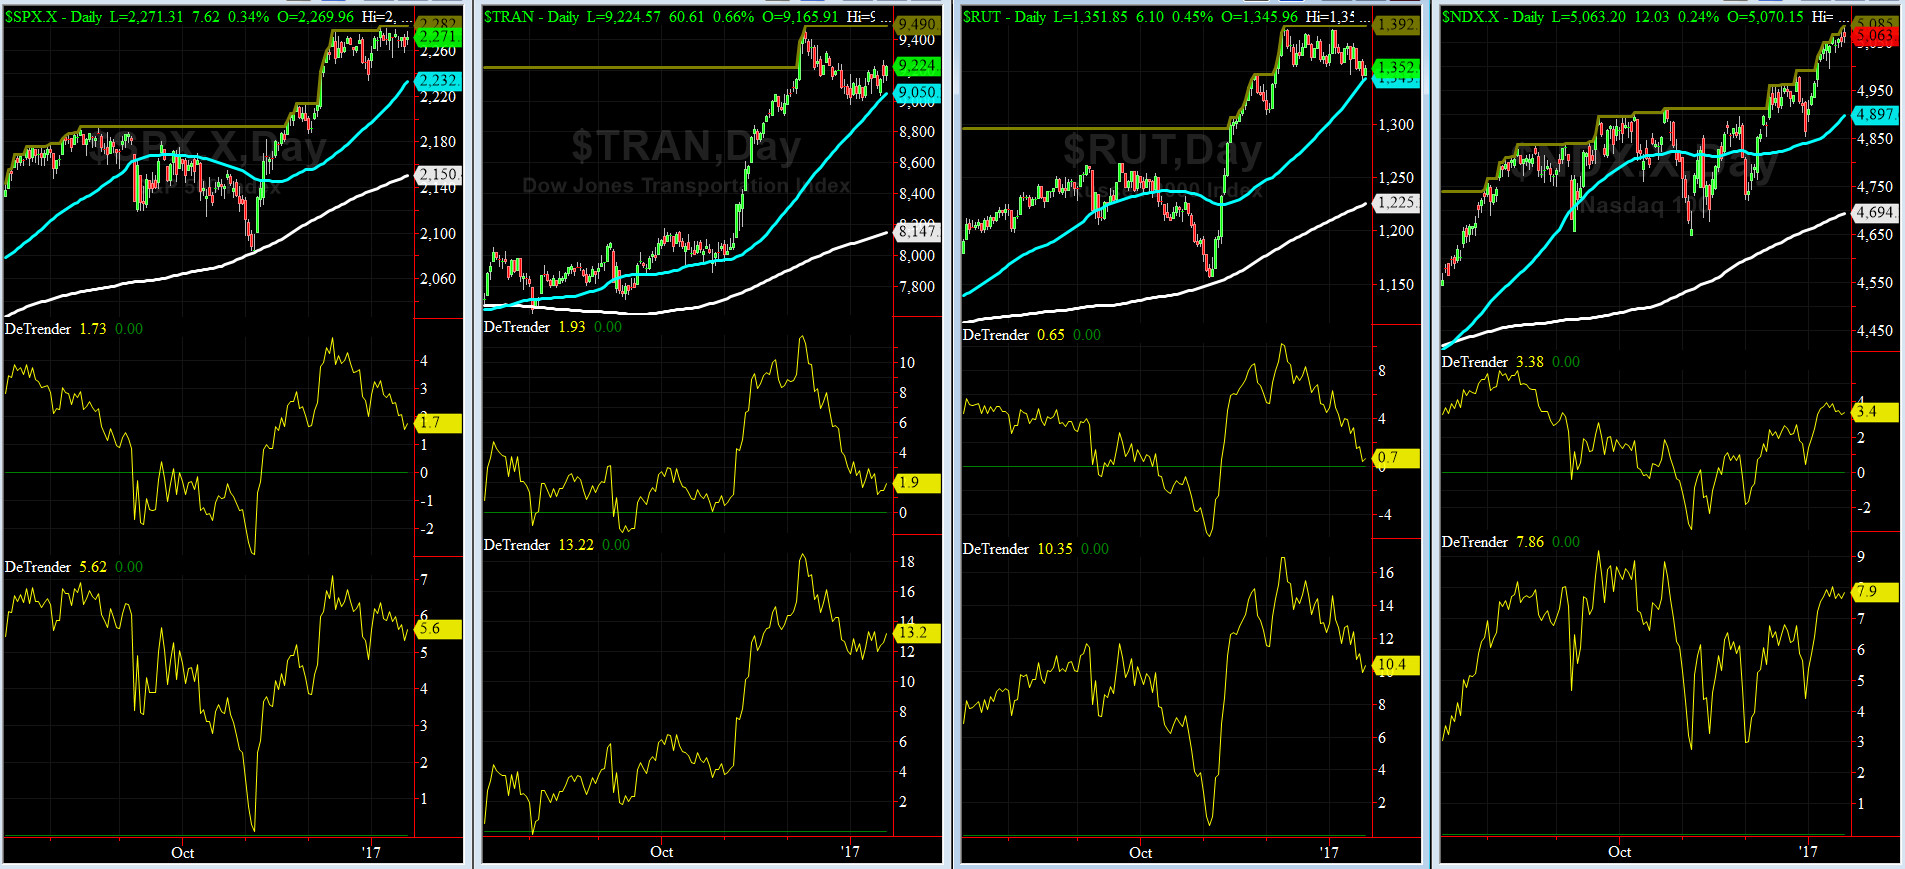
DeTrenders Charts for SPX, NDX, TRAN & RUT Indices
50-Day MA SPX = 2232 or 1.7% below SPX closed on Friday (max observed in last 5 yrs = +8.6%, min = -9.3%)
200-Day MA SPX = 2150 or 5.6% below SPX (max observed in last 5 yrs = 15.2%, min = -14%)
All of our eight De Trenders remain positive. The De Trenders for DJ Tran & RUT will continue to be harbingers of future price hehavior in broad indices.

HA_SP1_Momo Chart
WEEKLY Timing Model = on a BUY Signal since Friday 12/16/16 CLOSE at 2258
DAILY Timing Model = on a SELL Signal since Wednesday 1/18/17 CLOSE at 2272
Max SPX 52wk-highs reading last week = 19 (over 120-140, the local maxima is in)
Max SPX 52wk-Lows reading last week = 8 (over 40-60, the local minima is in)
HA_SP1 at just about its +1 sigma channels
HA_Momo = -1.2 (reversals most likely occur above +10 or below -10)
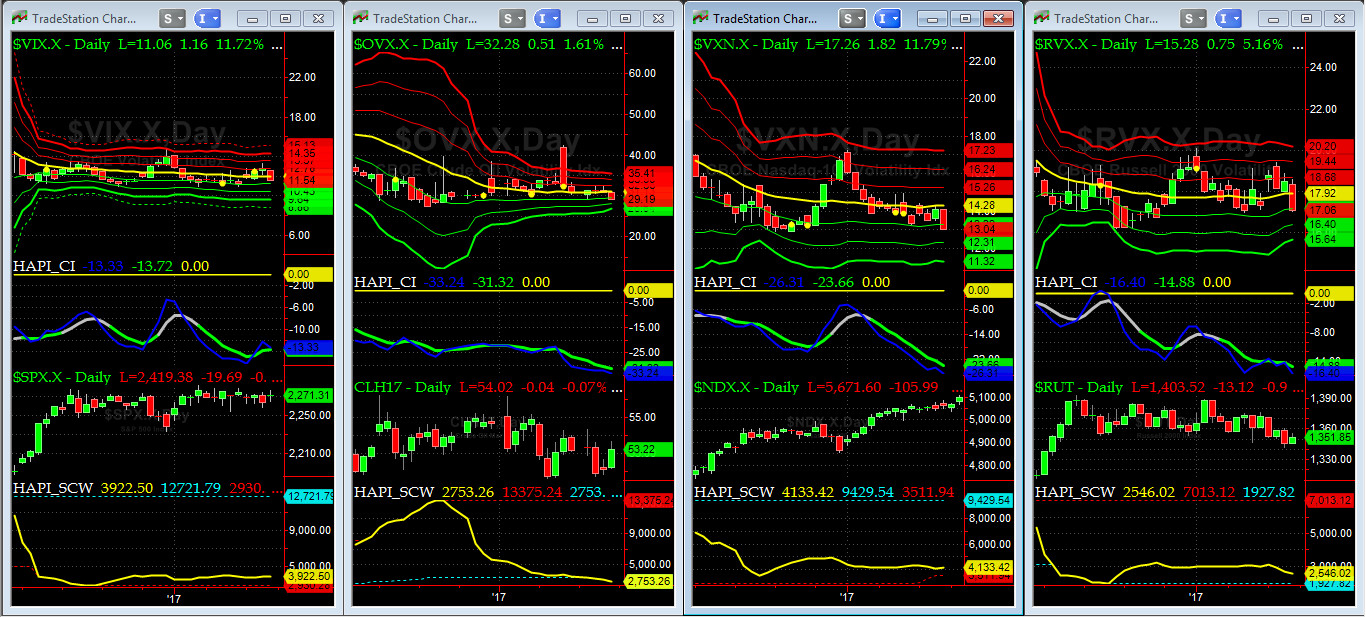
Vol of the Vols Chart
VIX is currently at its -1 sigma level at 11.5 (remember it�s the VIX�s vol pattern (its sigma channels) that matters, and not the level of VIX itself (this is per Dr. Robert Whaley, a great mentor and the inventor of original VIX, now called VXO). VIX usually peaks around a test of its +4 sigma).
The VOL Complex moved modestly this past week (less one sigma).
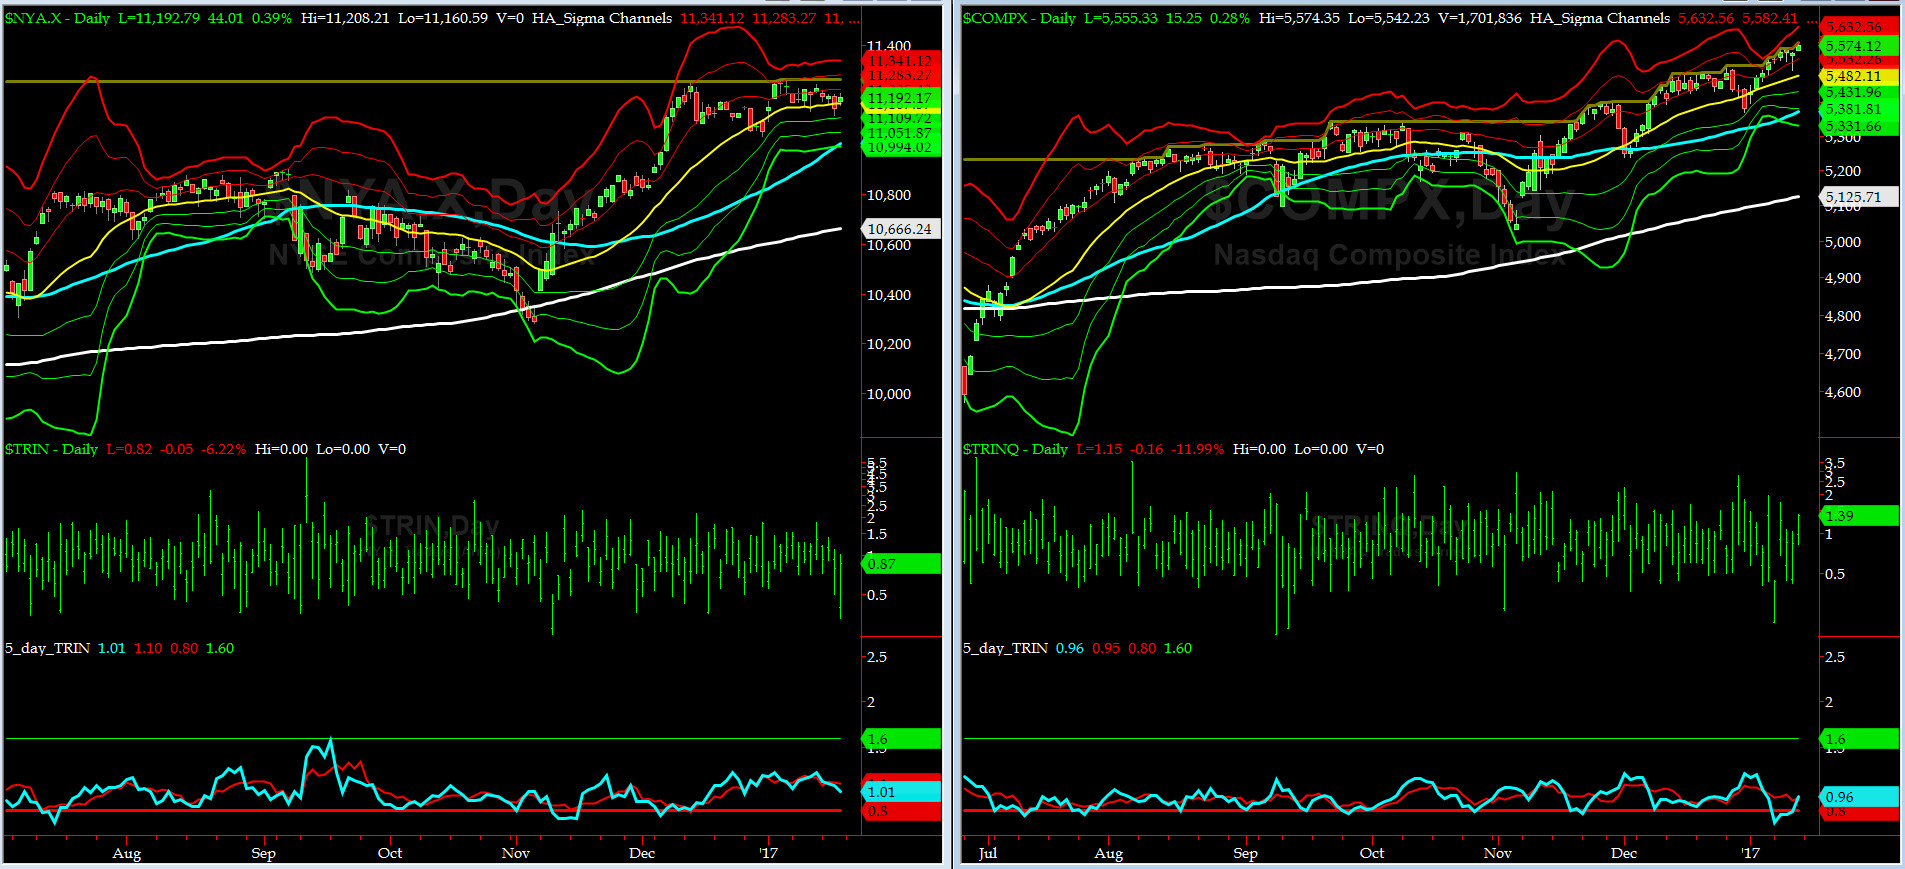
5-day TRIN & TRINQ Charts
Both NYSE & NASDAQ 5-day TRINs are again NEUTRAL for now.
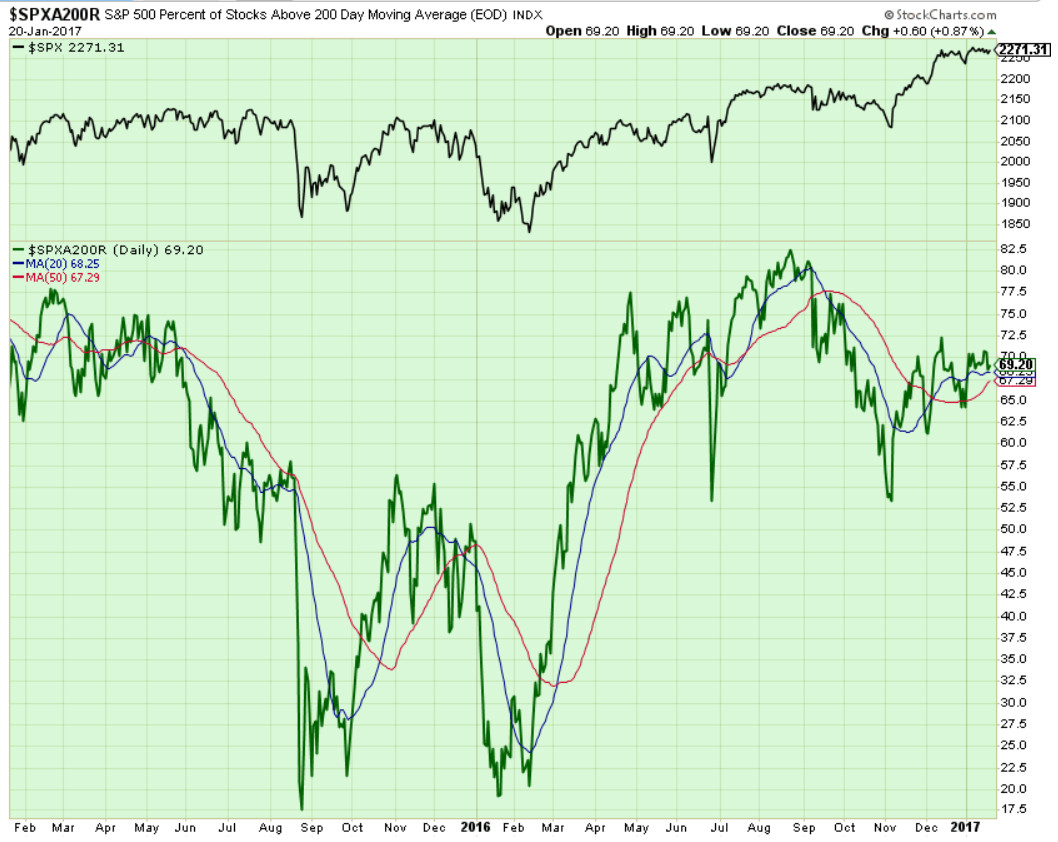
Components of SPX above their respective 200day MA Chart
This past week, this scoring indicator was again flat-lined between 69% to 70%.
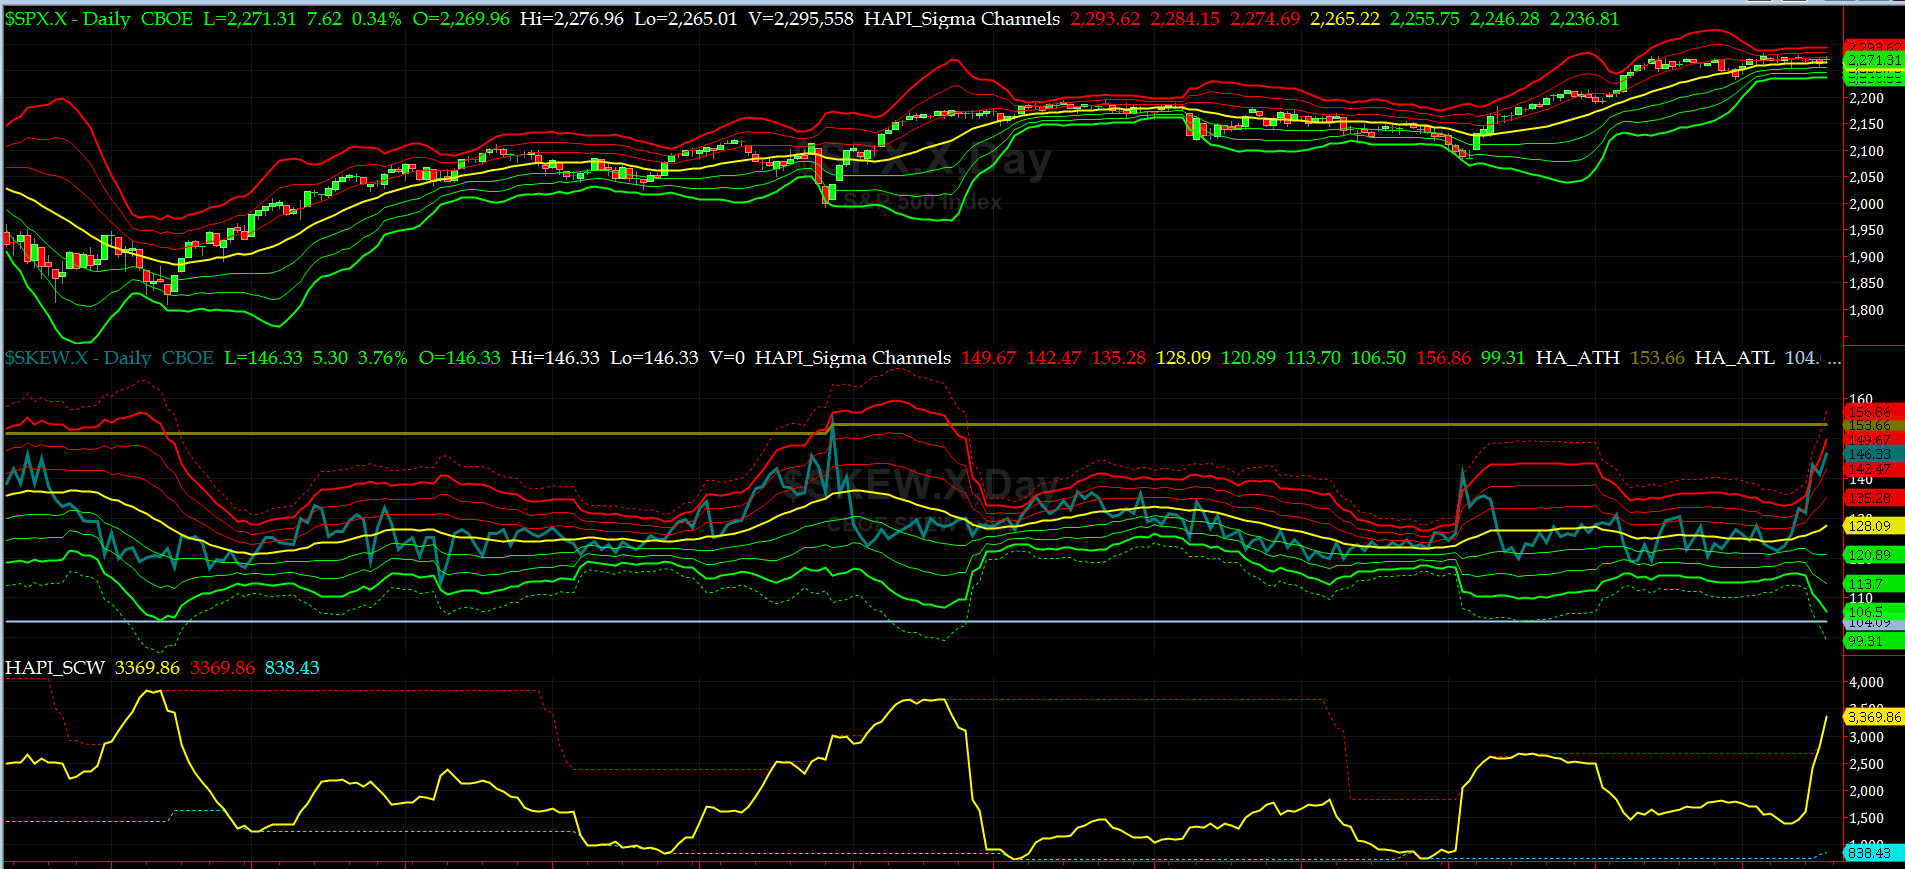
SPX SKEW (Tail Risk) Chart
Last week SPX SKEW (Tail Risk) continued to rise steadily and finally closed at about its +2.5 sigma at 146. (normal = 120-125, range 100-150).
All is no longer quiet on the Eastern & Mid-Western Fronts.... stay tuned sailors for the other shoe to drop soon.
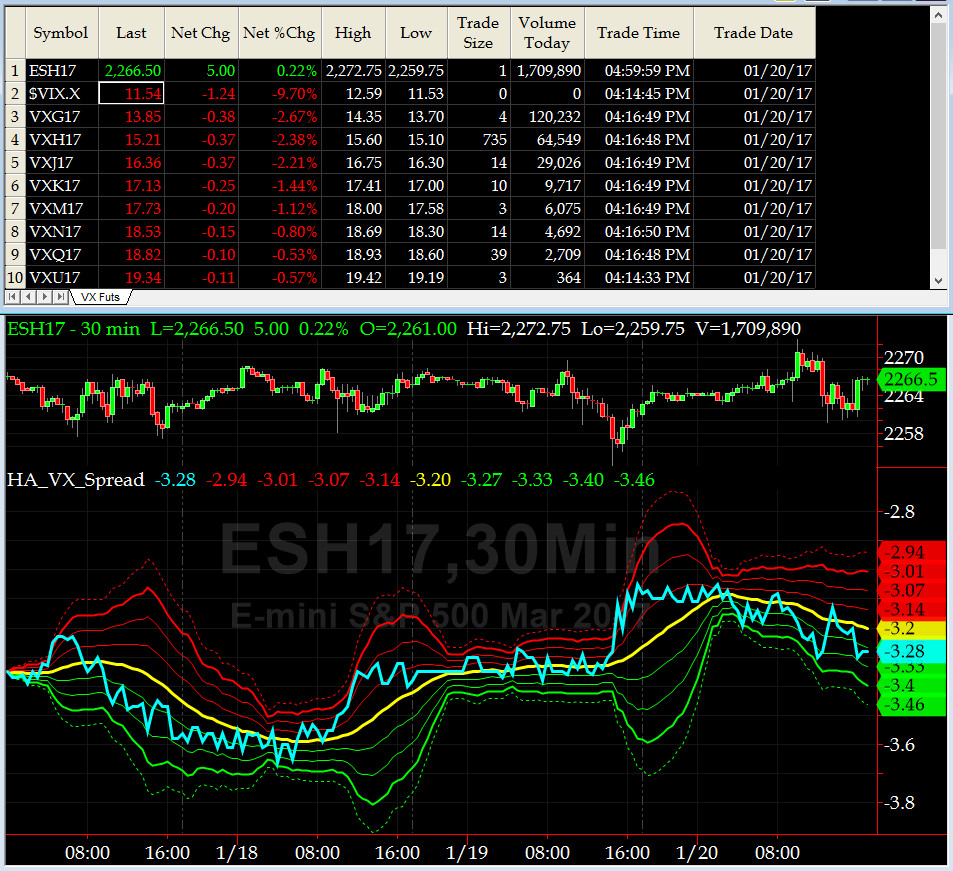
3-month VIX Futures Spread(VX) Chart
Our 3-month VIX Futures Spread (LONG FEB & SHORT MAY) did not change much last week and closed at -3.3 on Friday. NO SIGNAL HERE.
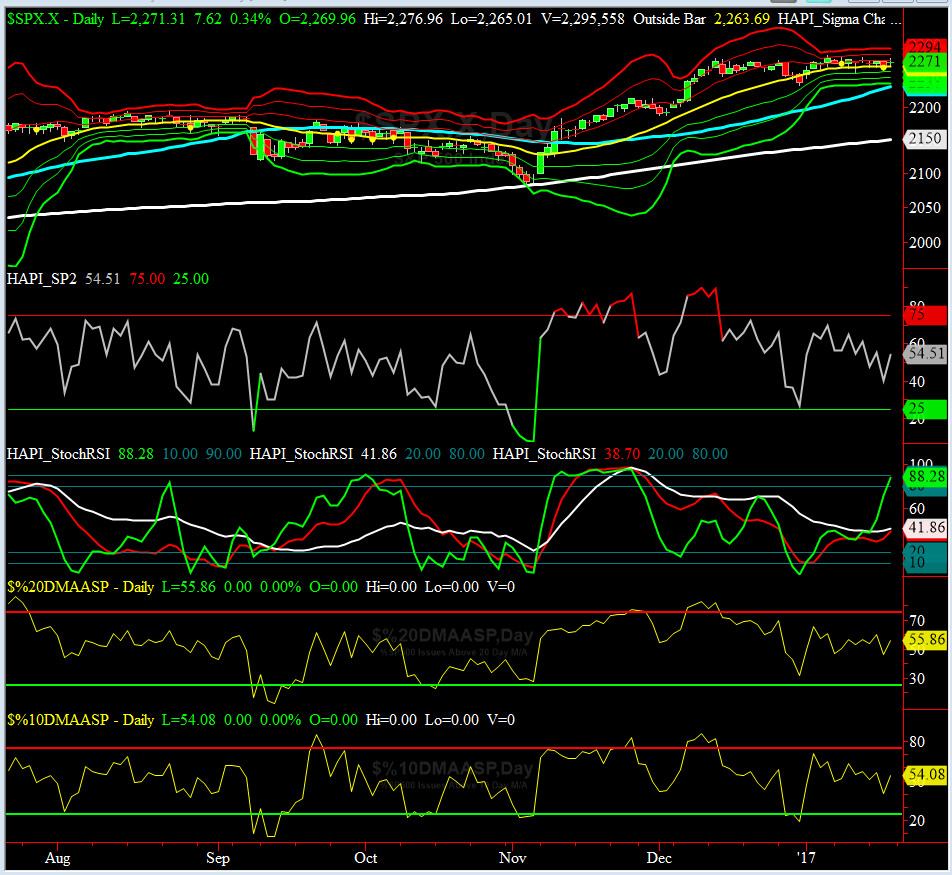
HA_SP2 Chart
HA_SP2 = 54 (Buy signal <= 25, Sell Signal >= 75)
SP2 went sideways and ended only slightly lower.
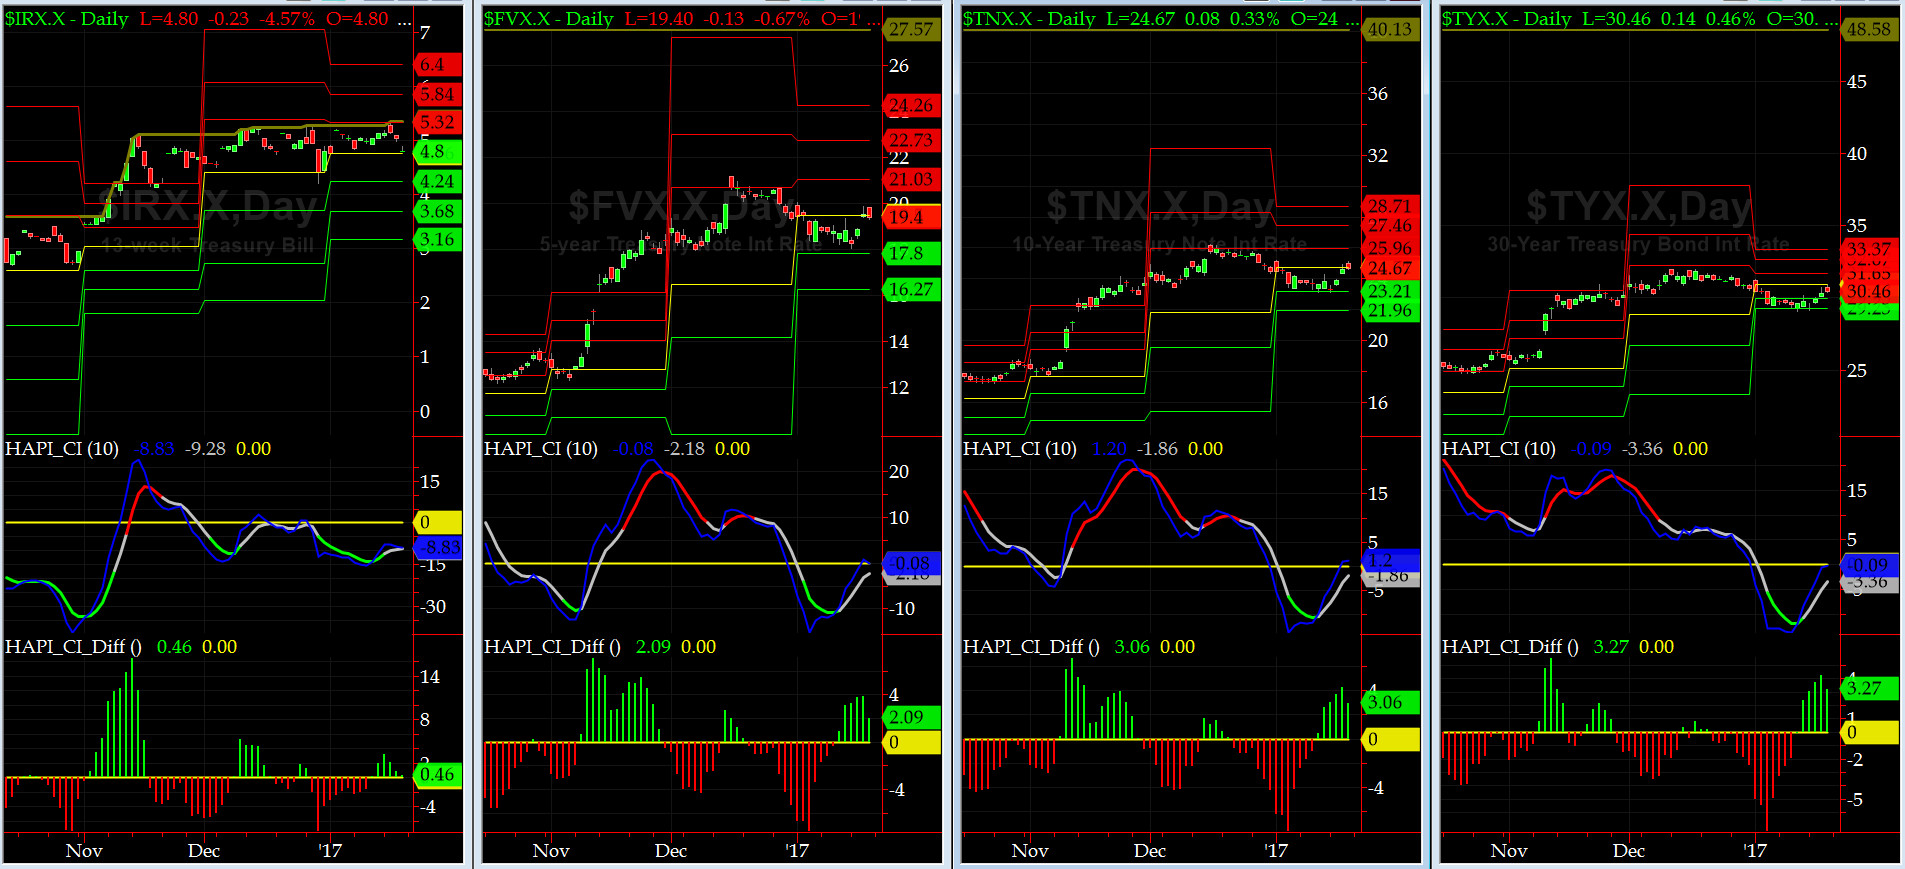
US Treasury T-Notes & T-Bonds Yields Chart
The YTMs on the long end of Treasury Complex rose slightly while the 91-day T-Bill's EBY dropped a tad.
Fari Hamzei
|
|
|
|
|
|
Customer Care:
|
|
|
|
|
|
|
 |
 |
|
 |
|
 |
 |
 |
HA YouTube Channel ::: HA Blog ::: Testimonials ::: Tutorials & FAQs ::: Privacy Policy
|
Trading Derivatives (Options & Futures) contains substantial risk and is not for every investor. An investor could potentially lose all or more than his/her initial investment.
Only risk capital should be used for trading and only those with sufficient risk capital should consider trading derivatives. Past performance is not
necessarily indicative of future results. Testimonials appearing on this website may not be representative of other clients or customers
and are not a guarantee of future performance or success.
|
| (c) 1998-2025, Hamzei Analytics, LLC.® All Rights Reserved. |
|
|