|
Sunday, January 29, 2017, 2330ET
Market Timing Charts, Analysis & Commentary for Issue #178

Timer Charts of S&P-500 Cash Index (SPX) + NASDAQ-100 Cash Index (NDX)
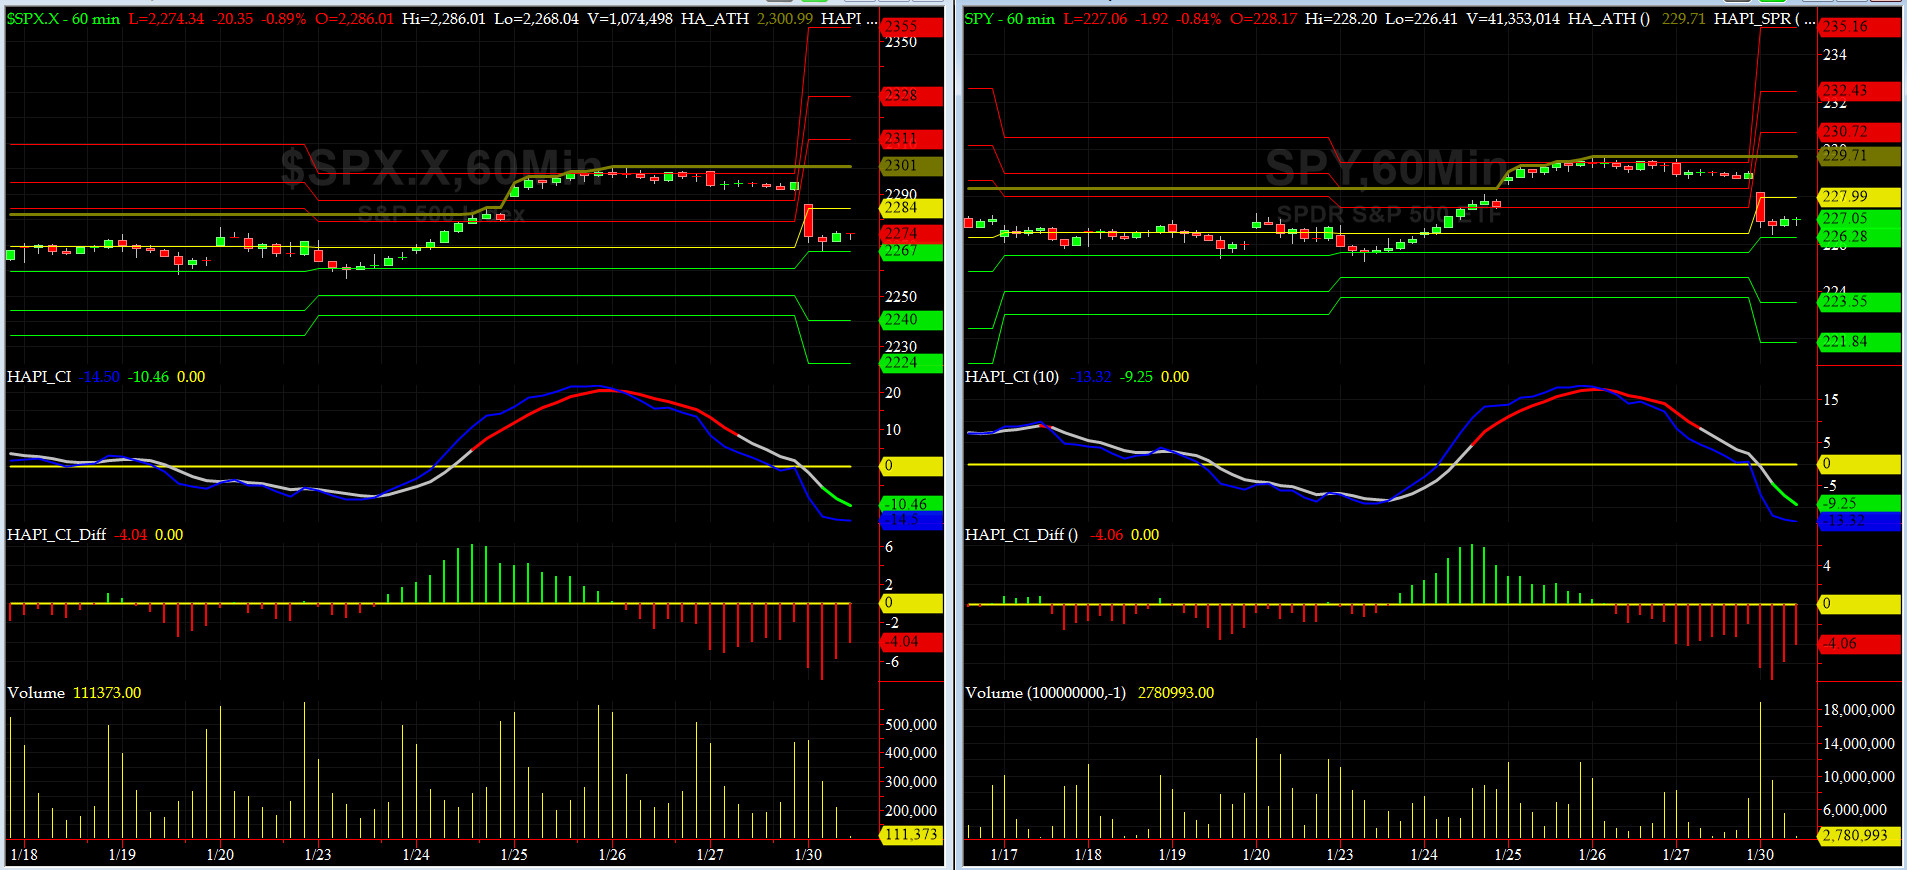
Most recent S&P-500 Cash Index (SPX): 2294.69 up +23.38 (up +1.03%) for the week ending Friday, January 27th, 2017, closed near its +2 sigma.
SPX ALL TIME INTRADAY HIGH = 2300.99 (reached on Thursday, January 26, 2017)
SPX ALL TIME CLOSING HIGH = 2298.97 (reached on Wednesday, January 25, 2017)
Current DAILY +2 Sigma SPX = 2299 with WEEKLY +2 Sigma = 2322
Current DAILY 0 Sigma (20 day MA) SPX = 2272 with WEEKLY 0 Sigma = 2200
Current DAILY -2 Sigma SPX = 2244 with WEEKLY -2 Sigma = 2078
NYSE McClellan Oscillator = +12 (-150 is start of the O/S area; around -275 to -300 area or lower, we go into the �launch-pad� mode, over +150, we are in O/B area)
NYSE Breadth Thrust = 53.4 (40 is considered as oversold and 65 as overbought)
Once again, SPX failed to provide any price expansion in either direction. We saw a good amount of intraday vol, specially before and after inauguration of DJT 45.
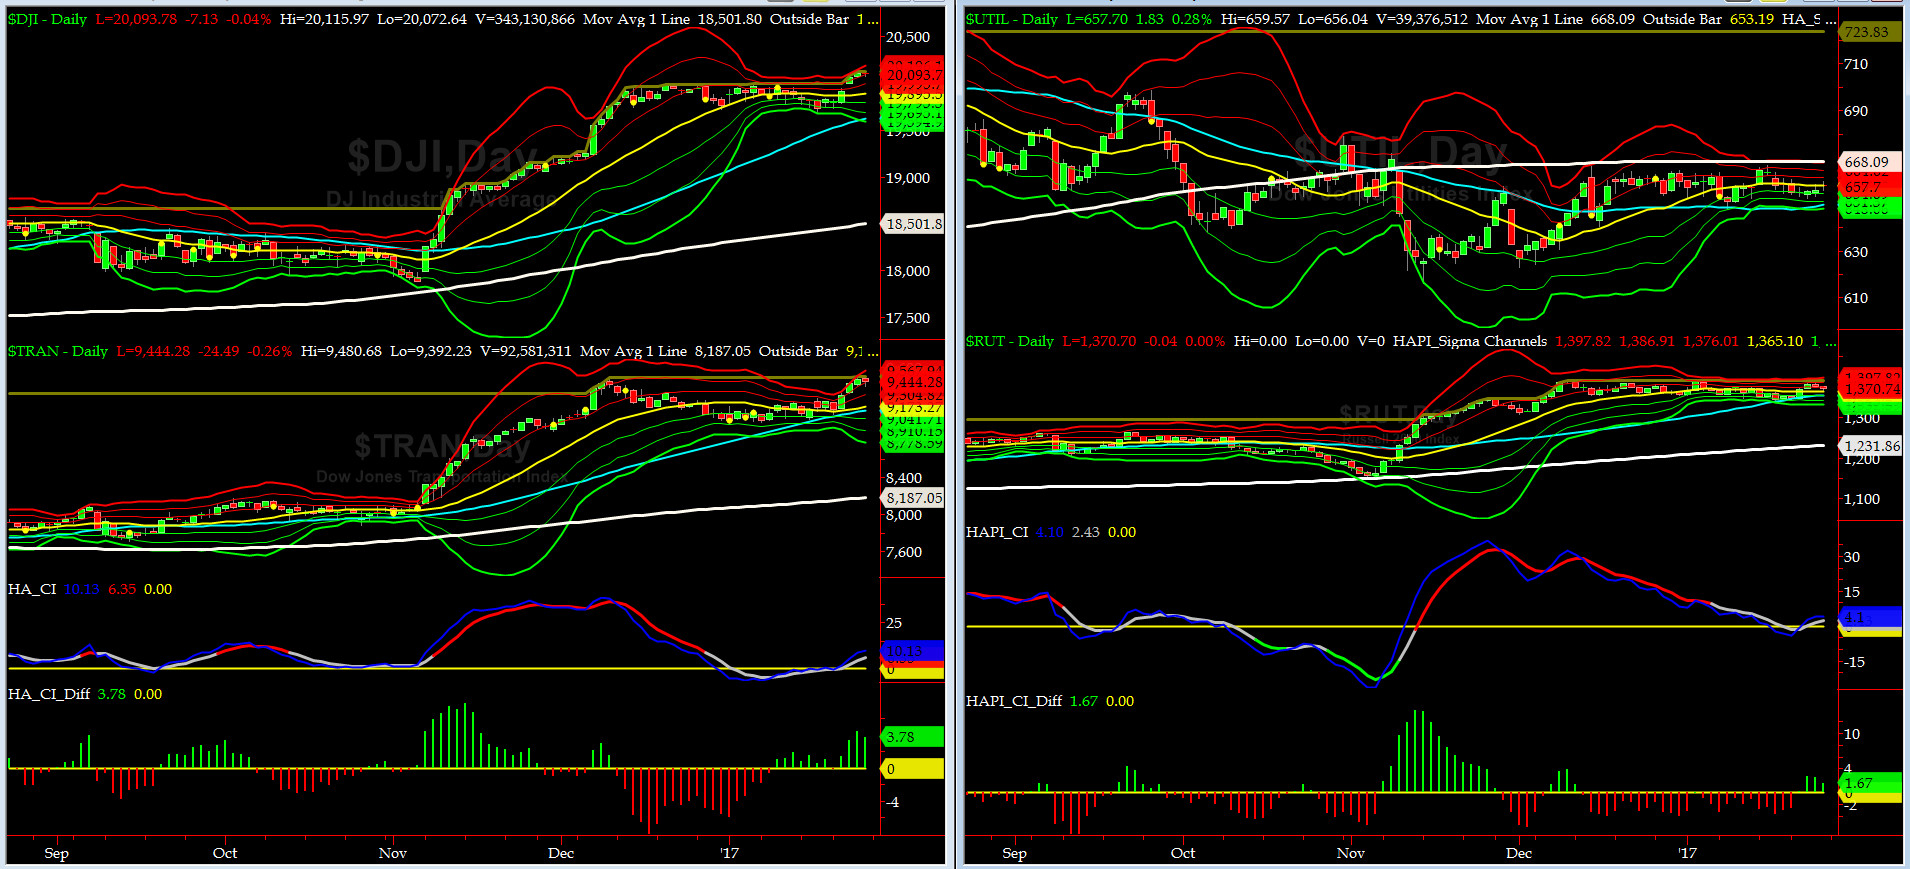
Canaries [in the Coal Mine] Chart for DJ TRAN & RUT Indices
200-Day MA DJ TRAN = 8187 or 15.4% below DJ TRAN (max observed in last 5 yrs = 20.2%, min = -20.3%)
200-Day MA RUT = 1231 or 11.3% below RUT (max observed in last 5 yrs = 21.3%, min = -22.6%)
DJ Transports (proxy for economic conditions 6 to 9 months hence) had a nice run-up to ATH.
Russell 2000 small caps (proxy for Risk ON/OFF) also had a nice rally but not to new ATH. Risk remains ON.
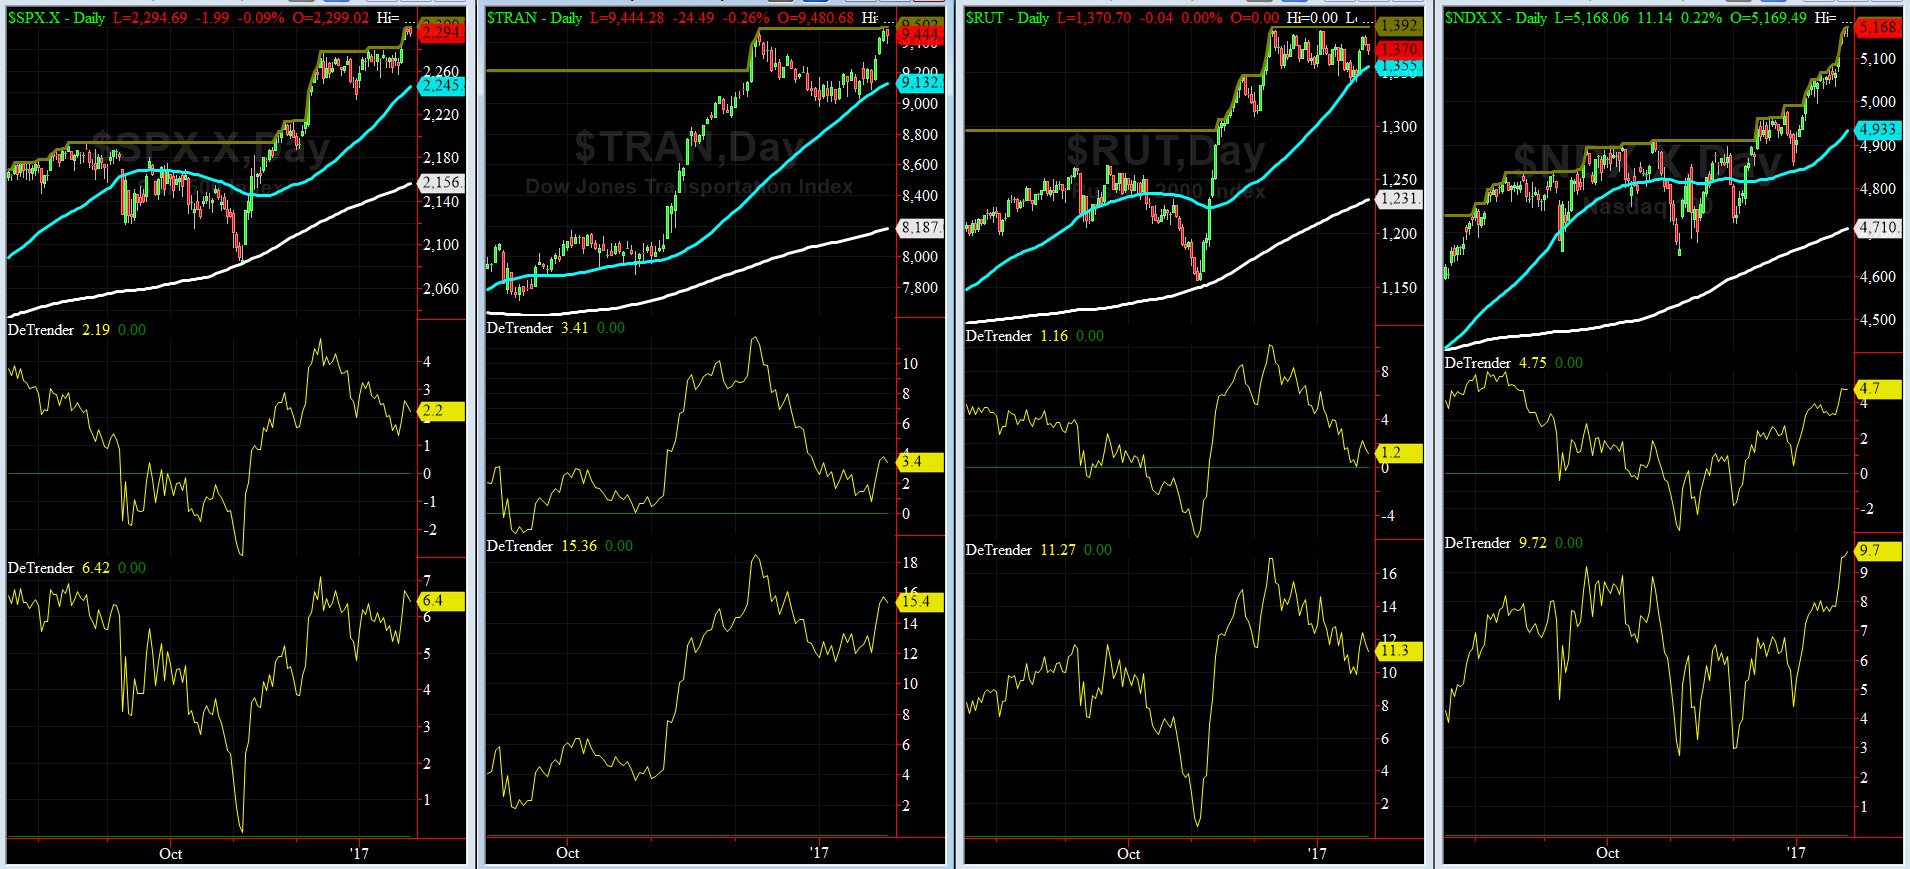
DeTrenders Charts for SPX, NDX, TRAN & RUT Indices
50-Day MA SPX = 2245 or 2.2% below SPX closed on Friday (max observed in last 5 yrs = +8.6%, min = -9.3%)
200-Day MA SPX = 2156 or 6.4% below SPX (max observed in last 5 yrs = 15.2%, min = -14%)
All of our eight De Trenders remain positive. The De Trenders for DJ Tran & RUT will continue to be harbingers of future price behavior in broad indices.
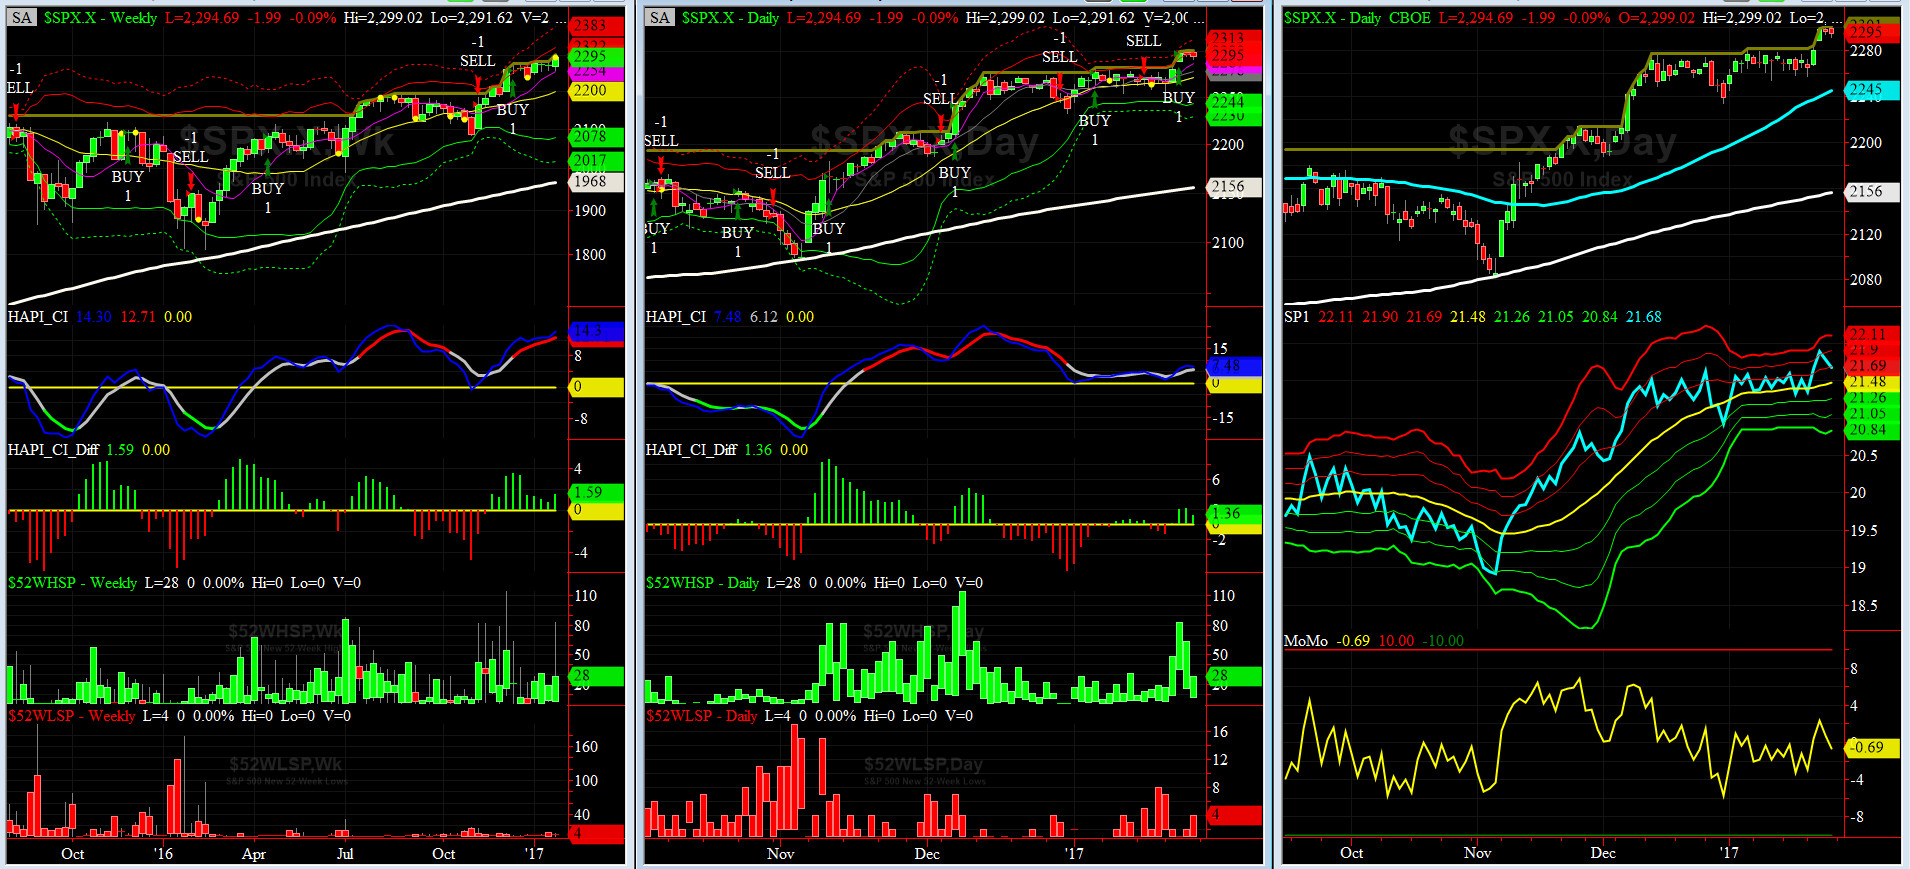
HA_SP1_Momo Chart
WEEKLY Timing Model = on a BUY Signal since Friday 12/16/16 CLOSE at 2258
DAILY Timing Model = on a BUY Signal since Wednesday 1/25/17 CLOSE at 2272
Max SPX 52wk-highs reading last week = 83 (over 120-140, the local maxima is in)
Max SPX 52wk-Lows reading last week = 7 (over 40-60, the local minima is in)
HA_SP1 at just about its +1 sigma channels
HA_Momo = -0.7 (reversals most likely occur above +10 or below -10)
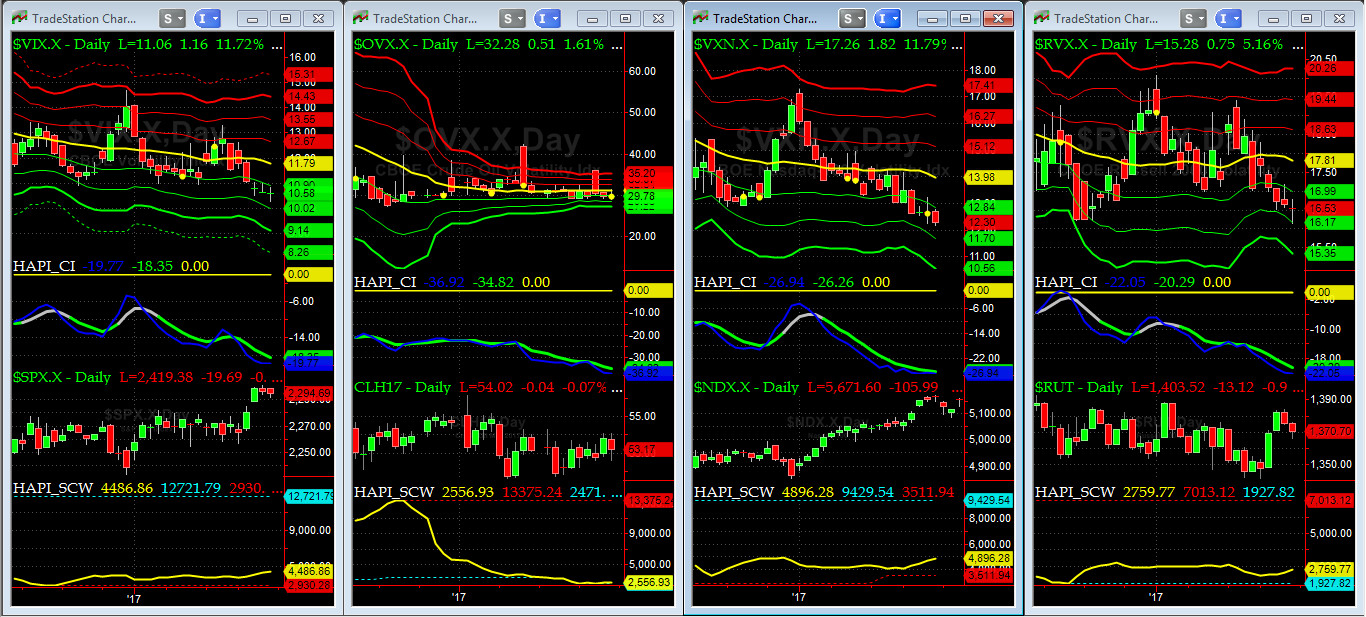
Vol of the Vols Chart
VIX is currently at its -1.5 sigma level at 10.58 (remember it�s the VIX�s vol pattern (its sigma channels) that matters, and not the level of VIX itself (this is per Dr. Robert Whaley, a great mentor and the inventor of original VIX, now called VXO). VIX usually peaks around a test of its +4 sigma).
The VOL Complex moved modestly this past week.
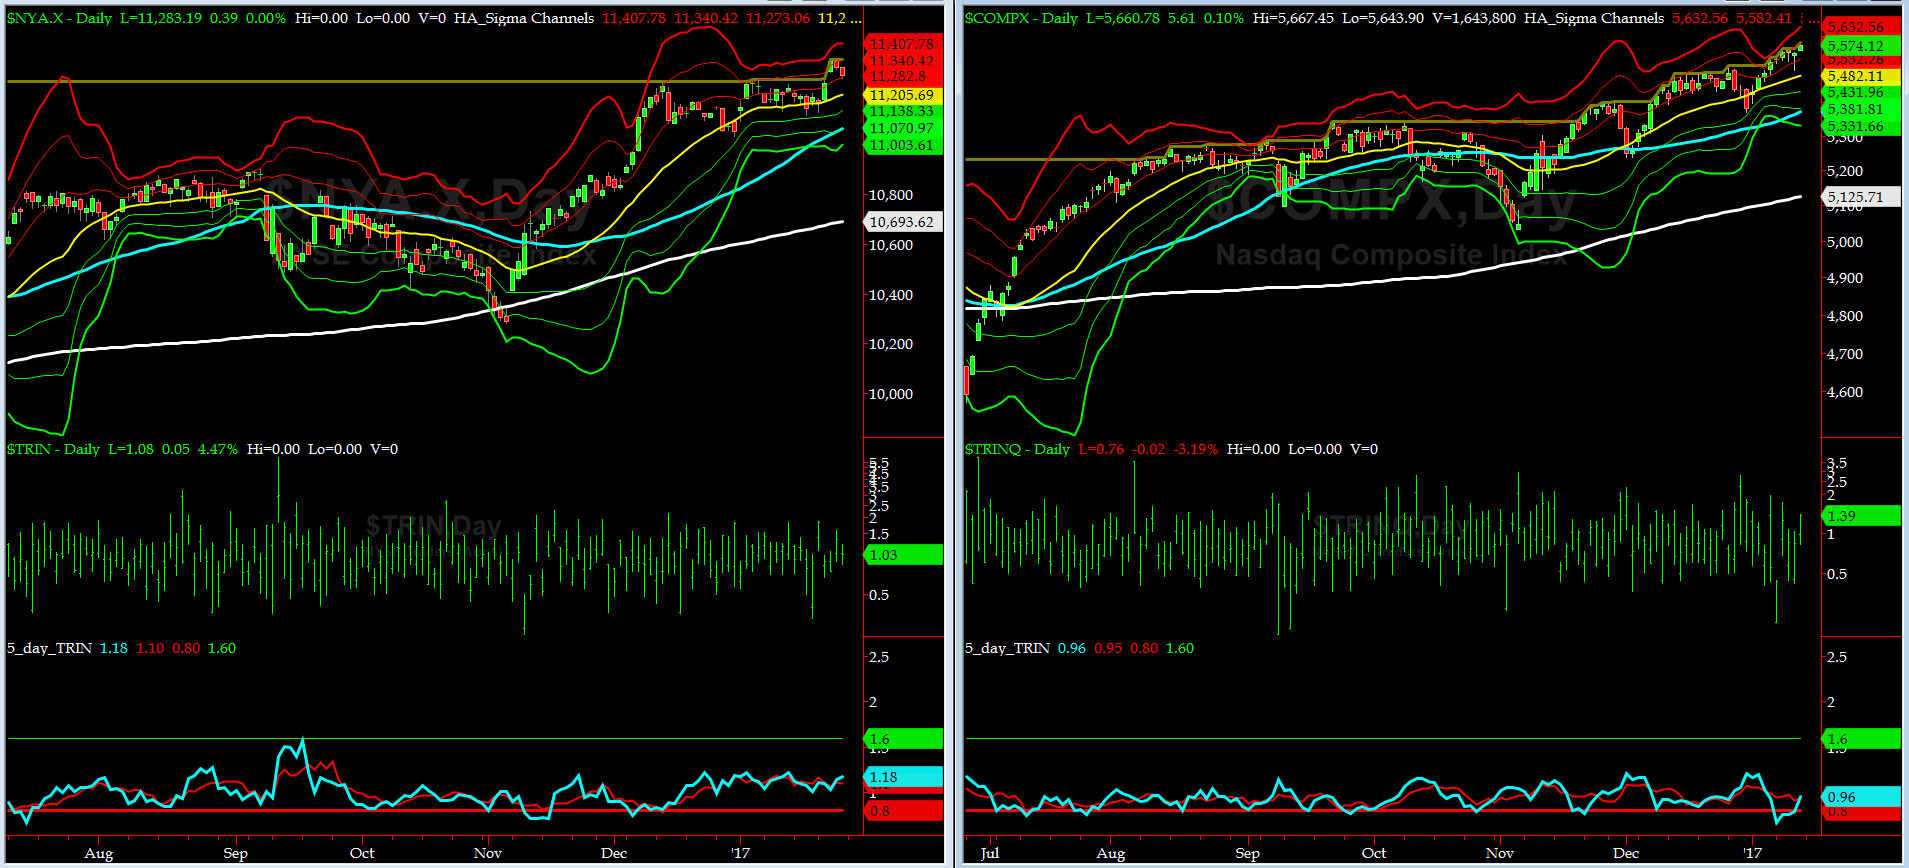
5-day TRIN & TRINQ Charts
Both NYSE & NASDAQ 5-day TRINs are again NEUTRAL for now.
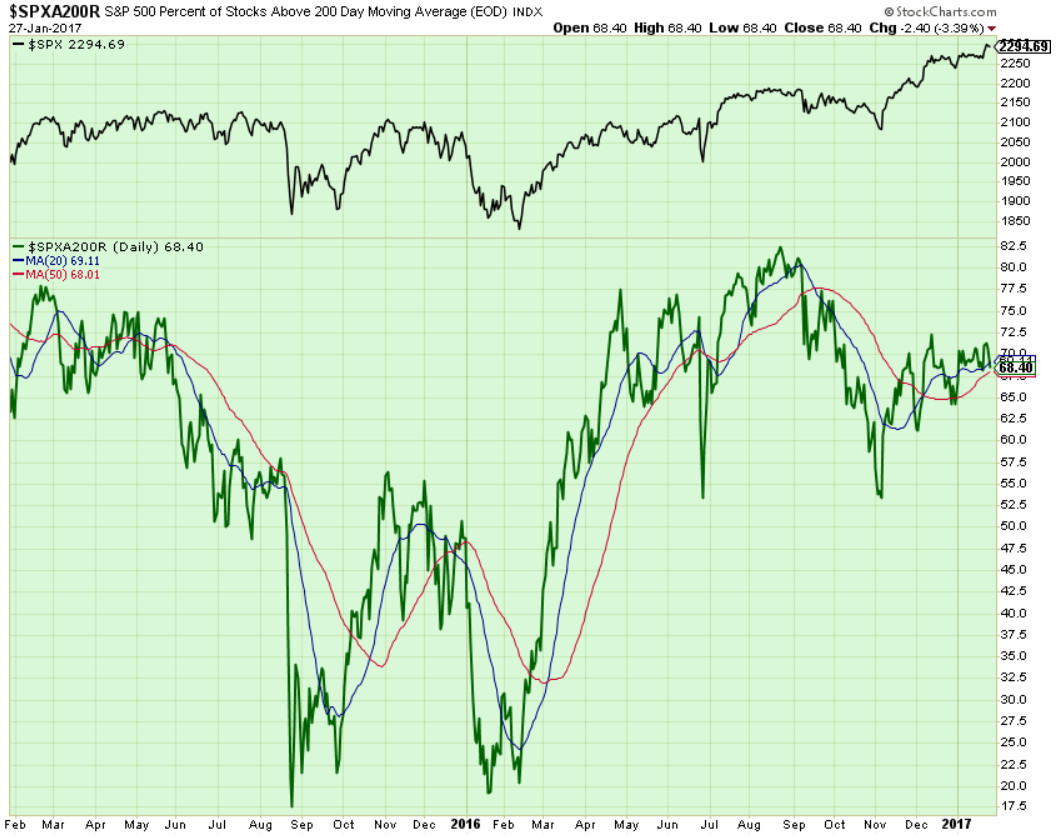
Components of SPX above their respective 200day MA Chart
This past week, this scoring indicator was again flat-lined between 69% to 71%.
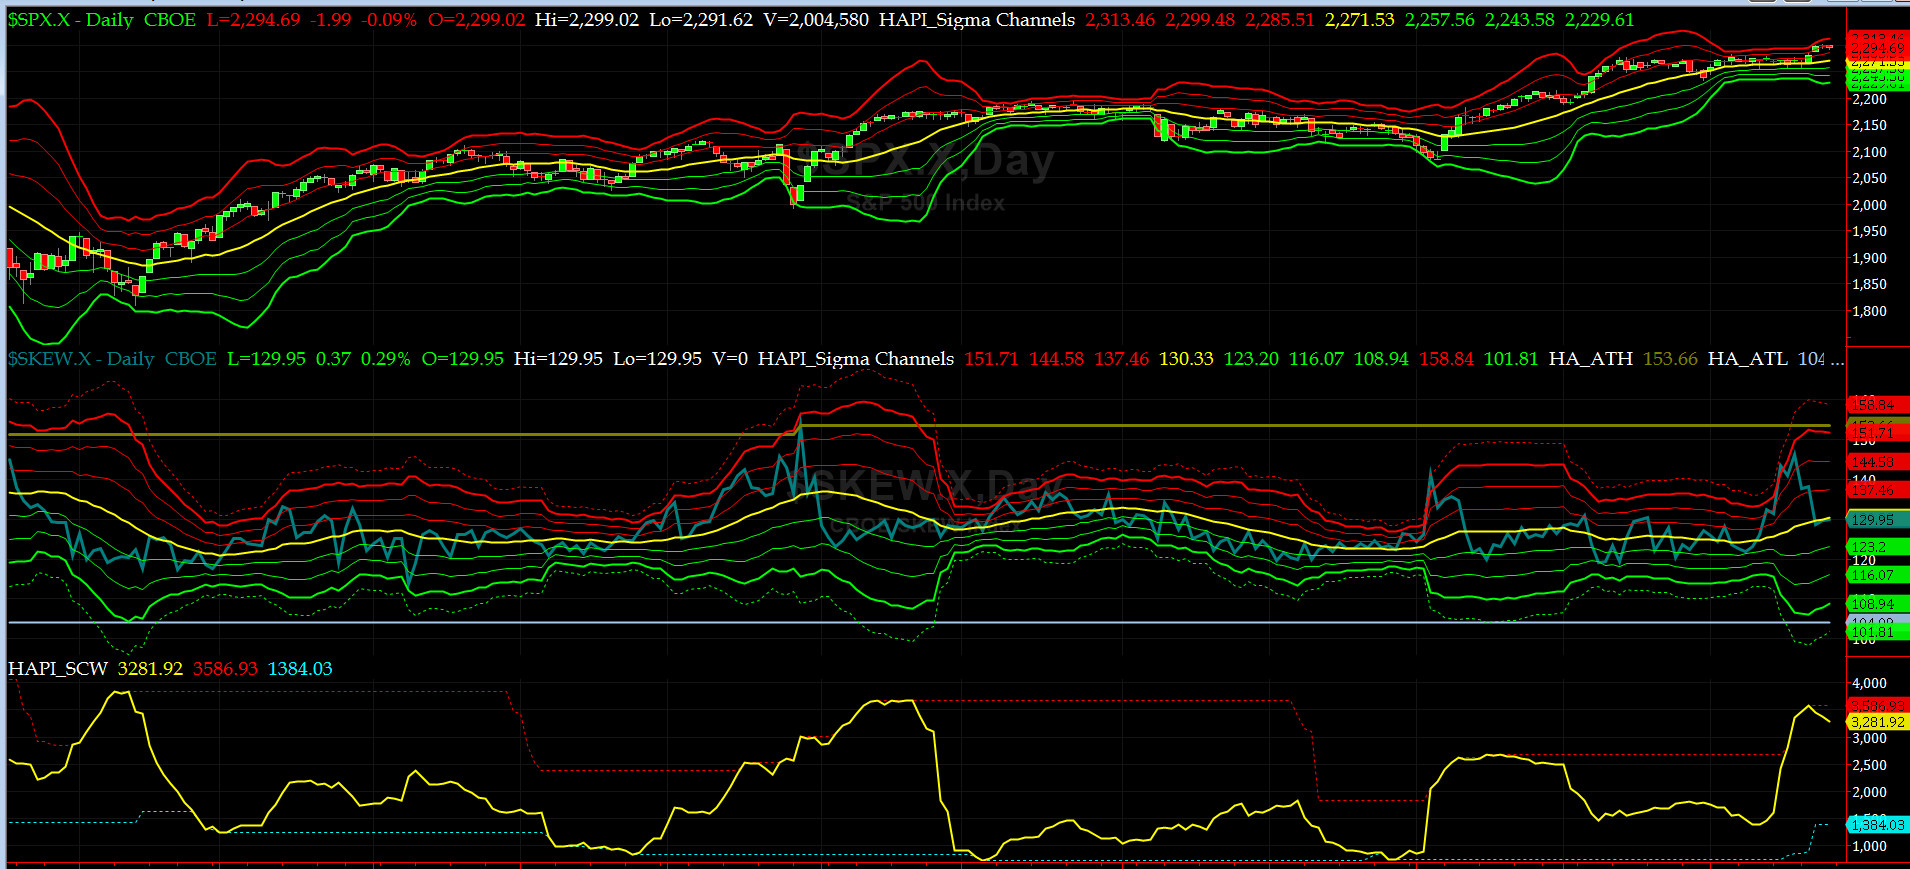
SPX SKEW (Tail Risk) Chart
Last week SPX SKEW (Tail Risk) sank to zero sigma at 130. (normal = 120-125, range 100-150).
All is quiet again on the Eastern & Mid-Western Fronts....

3-month VIX Futures Spread(VX) Chart
Our 3-month VIX Futures Spread (LONG FEB & SHORT MAY) did not change much last week and closed at -3.72 on Friday. NO SIGNAL HERE, YET.
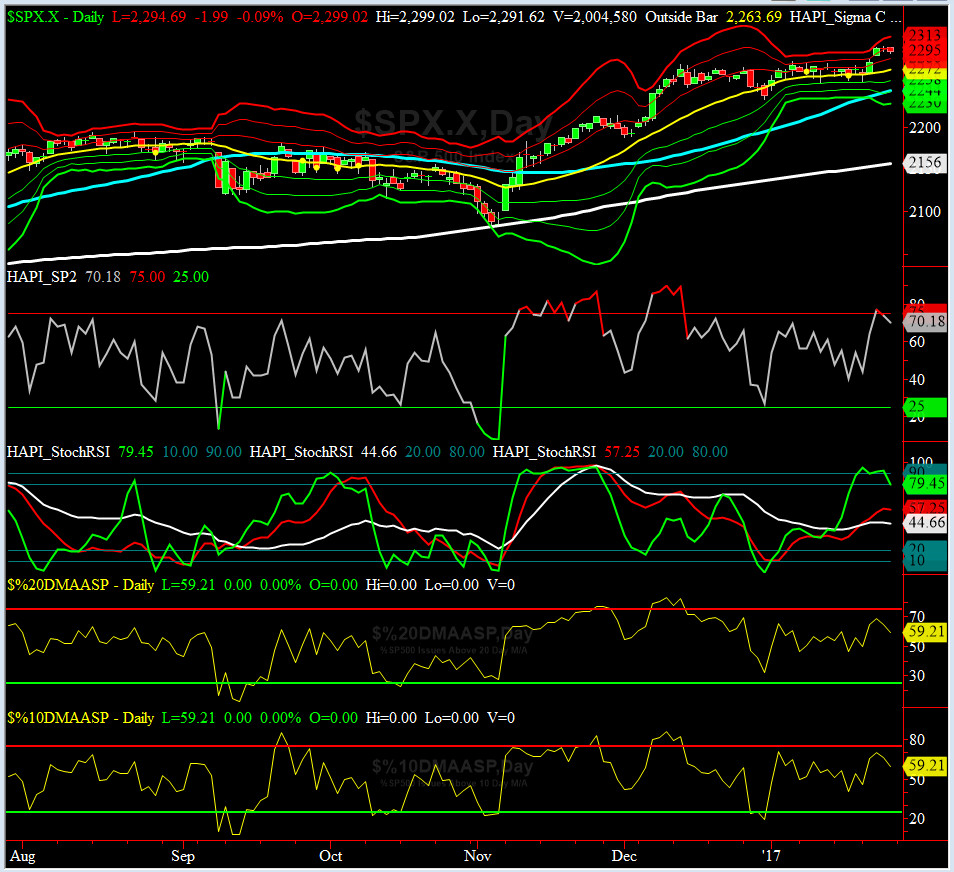
HA_SP2 Chart
HA_SP2 = 70 (Buy signal <= 25, Sell Signal >= 75)
SP2 rallied to +77.4 and then sank to 70.1, showing a sign of possible exhaustion.
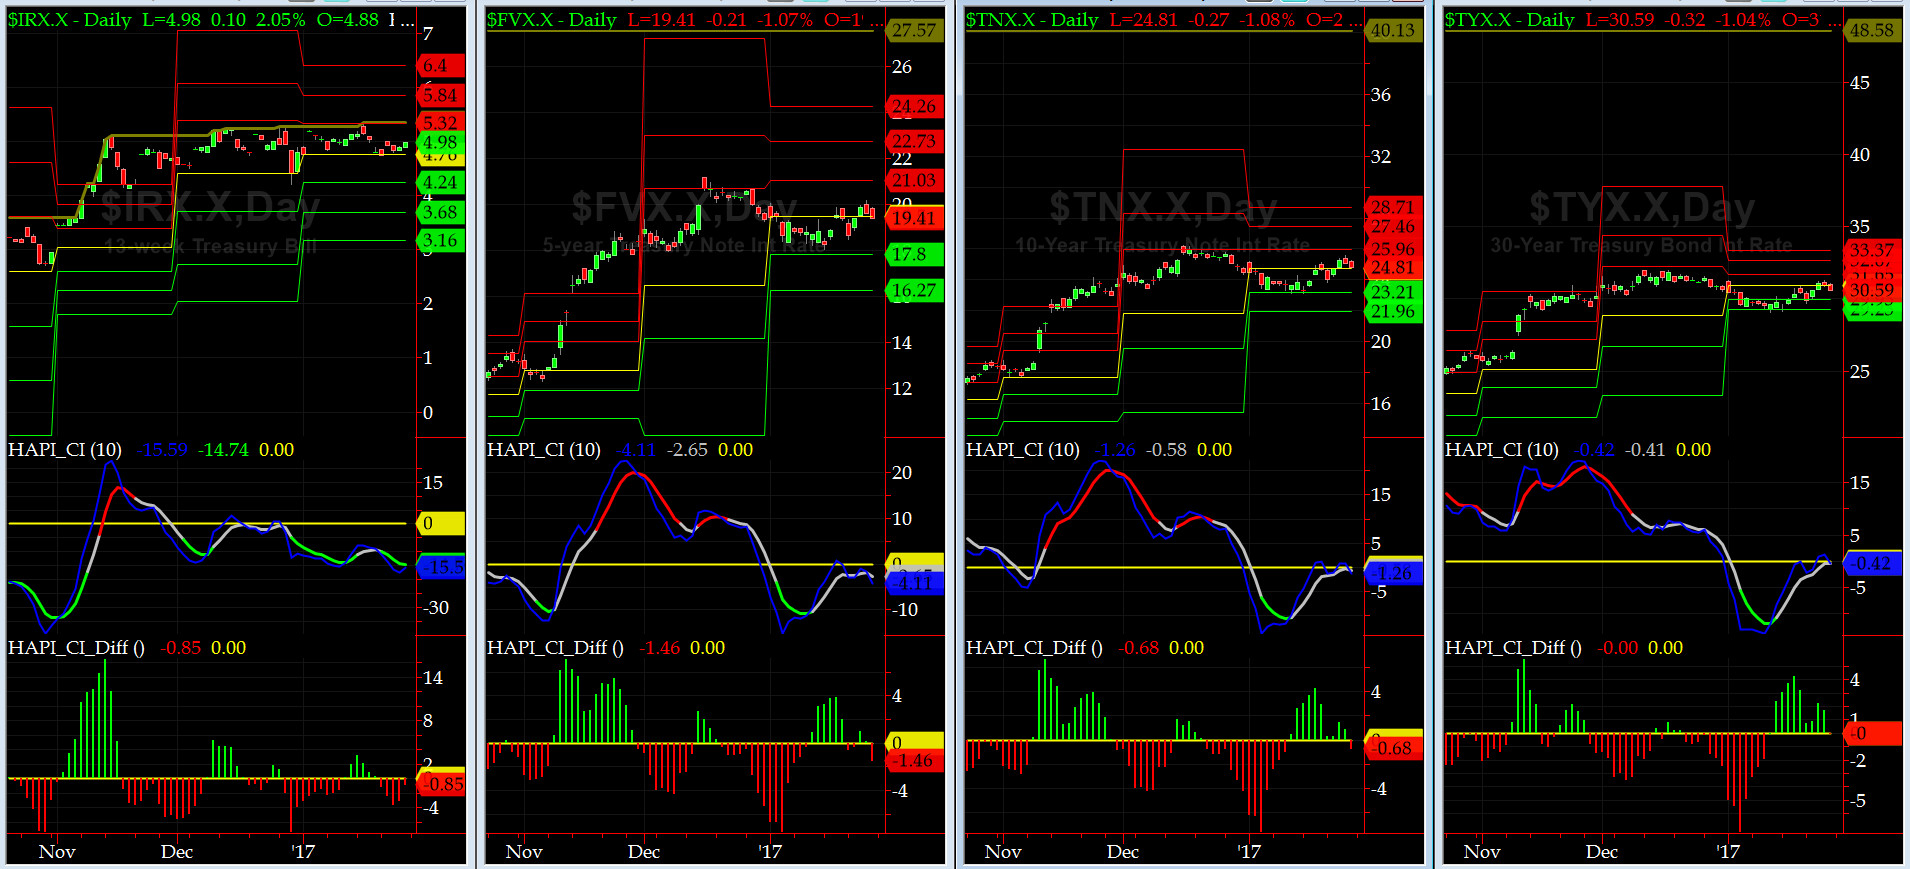
US Treasury T-Notes & T-Bonds Yields Chart
The YTMs were glued to their monthly pivots. Sausage Ops in the Bond Market? This must be new. Aren't ROMANs on some sort of visa restrictions re visiting Treasury Complex? LOL
Fari Hamzei
|


 Proactive Market Timing