|
Saturday, February 18, 2017, 1315ET
Market Timing Charts, Analysis & Commentary for Issue #181
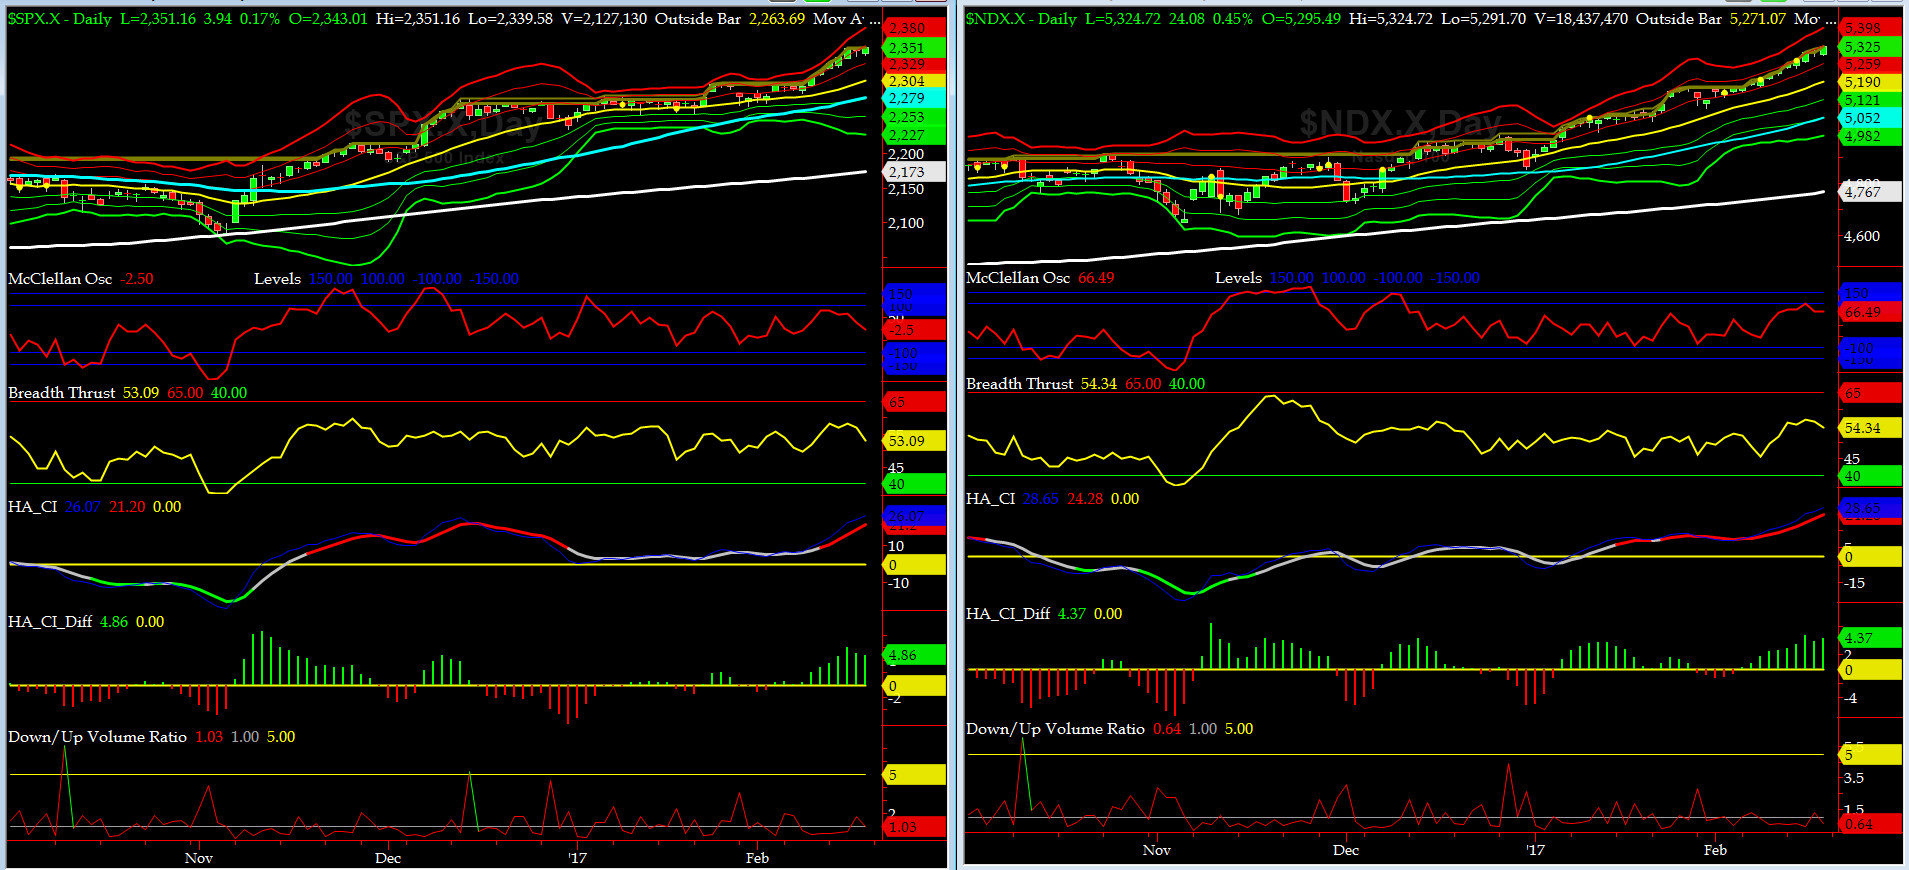
Timer Charts of S&P-500 Cash Index (SPX) + NASDAQ-100 Cash Index (NDX)
Most recent S&P-500 Cash Index (SPX): 2351.16 up +35.06 (up +1.51%) for the week ending Friday, February 17th, 2017, which closed near its +2 sigma.
SPX ALL TIME INTRADAY HIGH = 2351.31 (reached on Thursday, February 16, 2017)
SPX ALL TIME CLOSING HIGH = 2351.16 (reached on Friday, February 17, 2017)
Current DAILY +2 Sigma SPX = 2354 with WEEKLY +2 Sigma = 2368
Current DAILY 0 Sigma (20 day MA) SPX = 2304 with WEEKLY 0 Sigma = 2225
Current DAILY -2 Sigma SPX = 2253 with WEEKLY -2 Sigma = 2082
NYSE McClellan Oscillator = -2 (-150 is start of the O/S area; around -275 to -300 area or lower, we go into the �launch-pad� mode, over +150, we are in O/B area)
NYSE Breadth Thrust = 53 (40 is considered as oversold and 65 as overbought)
Grumpie is full of hot gas and markets can't figure him out so they just stayed long till couple of major booboos at NSC showed a reality tv star may not be the best fit to govern the greatest nation on this earth. This is NOT FAKE NEWS, lol.
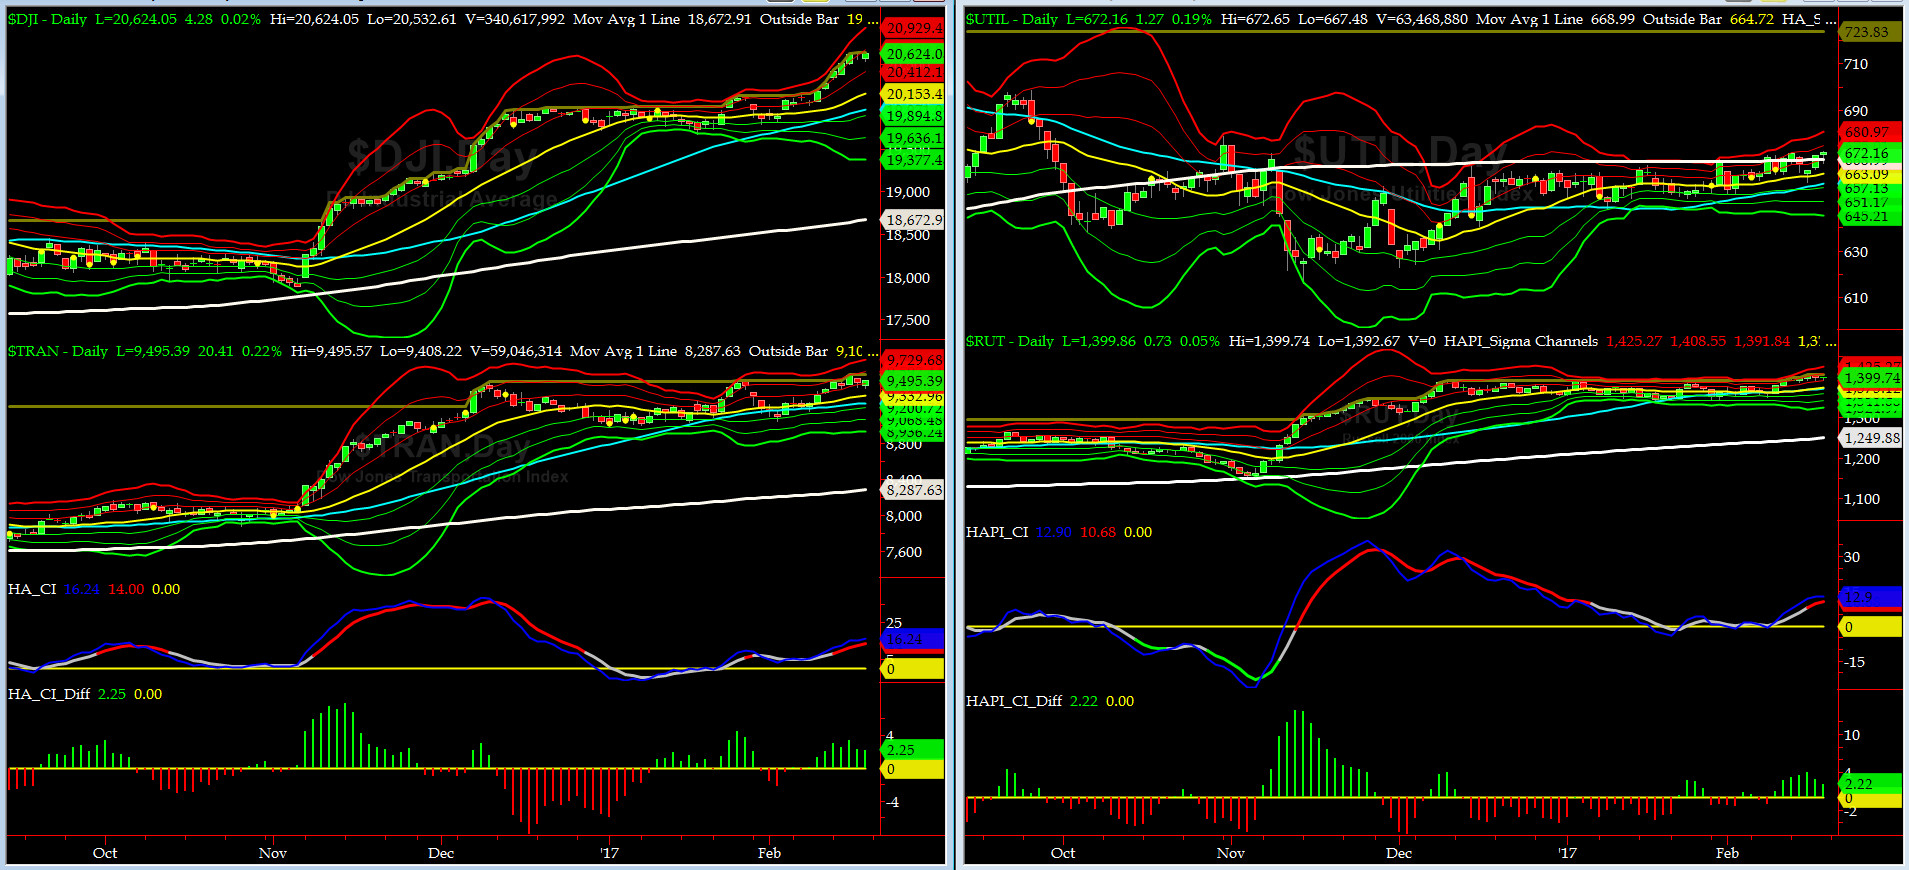
Canaries [in the Coal Mine] Chart for DJ TRAN & RUT Indices
200-Day MA DJ TRAN = 8287 or 14.6% below DJ TRAN (max observed in last 5 yrs = 20.2%, min = -20.3%)
200-Day MA RUT = 1249 or 12.0% below RUT (max observed in last 5 yrs = 21.3%, min = -22.6%)
DJ Transports (proxy for economic conditions 6 to 9 months hence) made a new ATH this past week then sold off on Thursday.
Russell 2000 small caps (proxy for Risk ON/OFF) rallied this past week and made new ATH almost every trading session. RISK remains HOT RED.
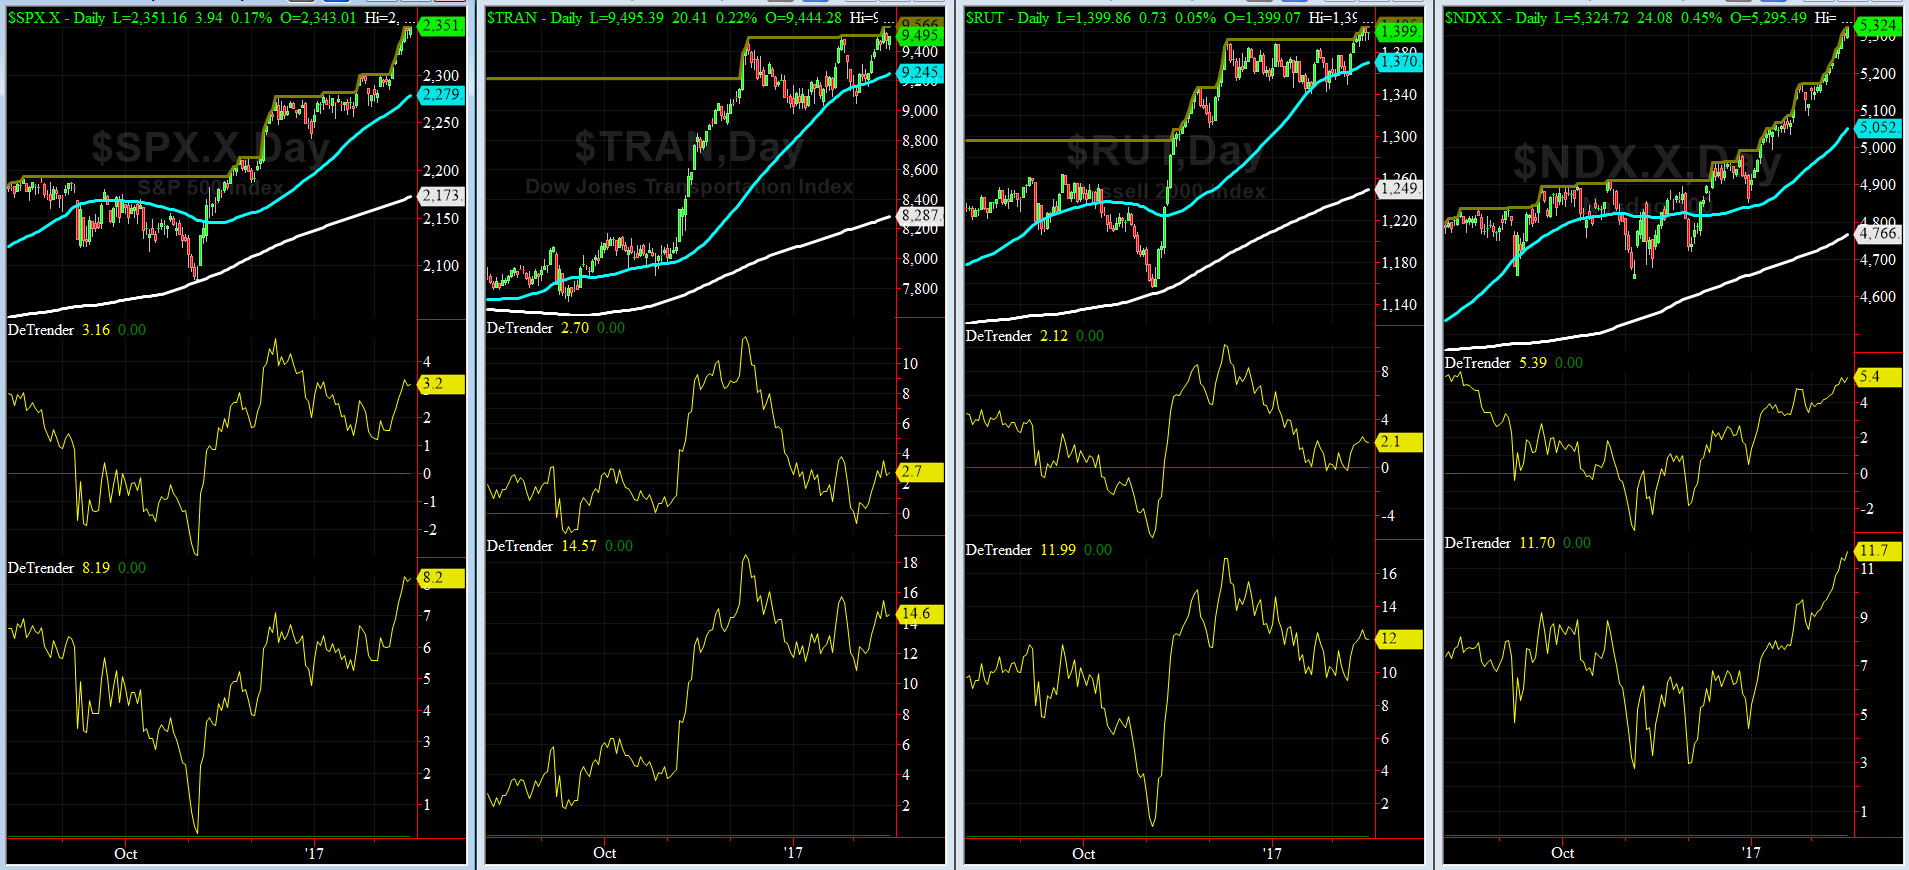
DeTrenders Charts for SPX, NDX, TRAN & RUT Indices
50-Day MA SPX = 2279 or 3.2% below SPX closed on Friday (max observed in last 5 yrs = +8.6%, min = -9.3%)
200-Day MA SPX = 2173 or 8.2% below SPX (max observed in last 5 yrs = 15.2%, min = -14%)
All of our eight De Trenders remain positive again. The De Trenders for DJ Tran & RUT will continue to be harbingers of future price behavior in broad indices.

HA_SP1_Momo Chart
WEEKLY Timing Model = on a BUY Signal since Friday 12/16/16 CLOSE at 2258
DAILY Timing Model = on a BUY Signal since Wednesday 2/8/17 CLOSE at 2295
Max SPX 52wk-highs reading last week = 77 (over 120-140, the local maxima is in)
Max SPX 52wk-Lows reading last week = 2 (over 40-60, the local minima is in)
HA_SP1 at just below its +2 sigma channels
HA_Momo = +4.2 (reversals most likely occur above +10 or below -10)
Vol of the Vols Chart
VIX is currently at its zero sigma level at 11.49 (remember it�s the VIX�s vol pattern (its sigma channels) that matters, and not the level of VIX itself (this is per Dr. Robert Whaley, a great mentor and the inventor of original VIX, now called VXO). VIX usually peaks around a test of its +4 sigma).
Net net the VOL Complex again moved LOWER this past week with minor exception of VIX while SPX put a new high

5-day TRIN & TRINQ Charts
Both NYSE 5-day TRINs is on SELL but NASDAQ 5-day TRIN is about to give a SELL signal. Stay tuned sailors....
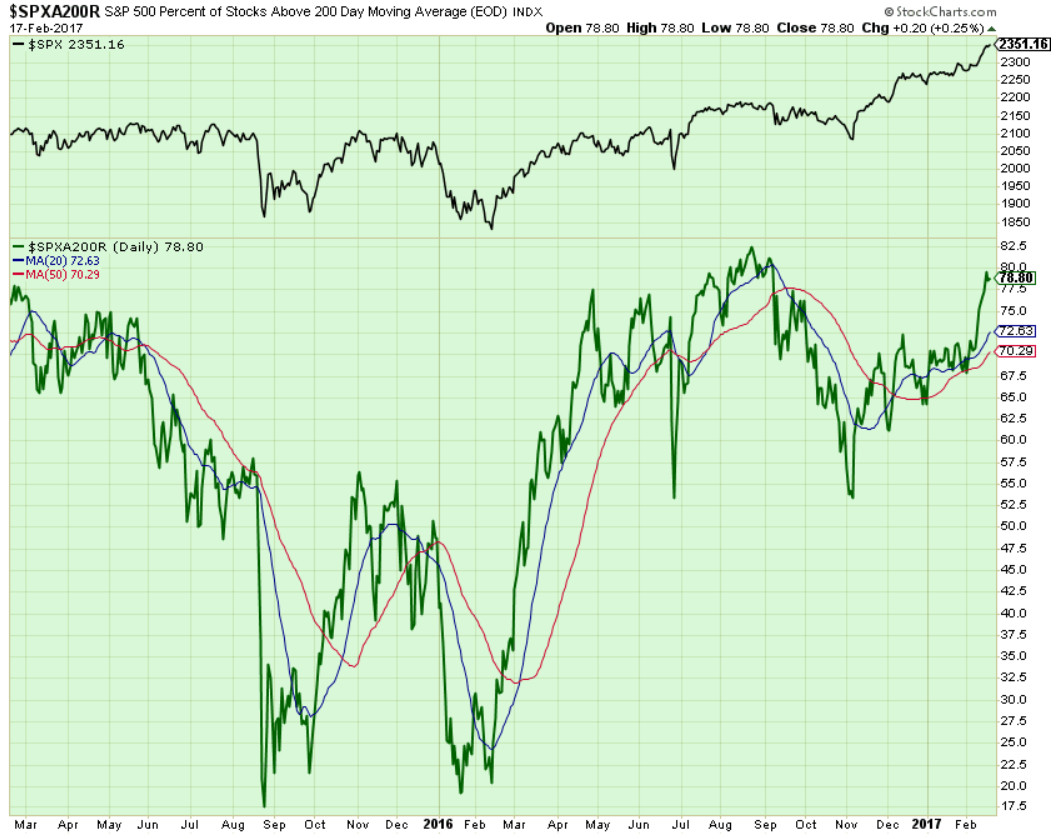
Components of SPX above their respective 200day MA Chart
This week this scoring indicator rose to ~80% before pulling back to close just a tad below 79%.... waiting to see a divergence with SPX soon.
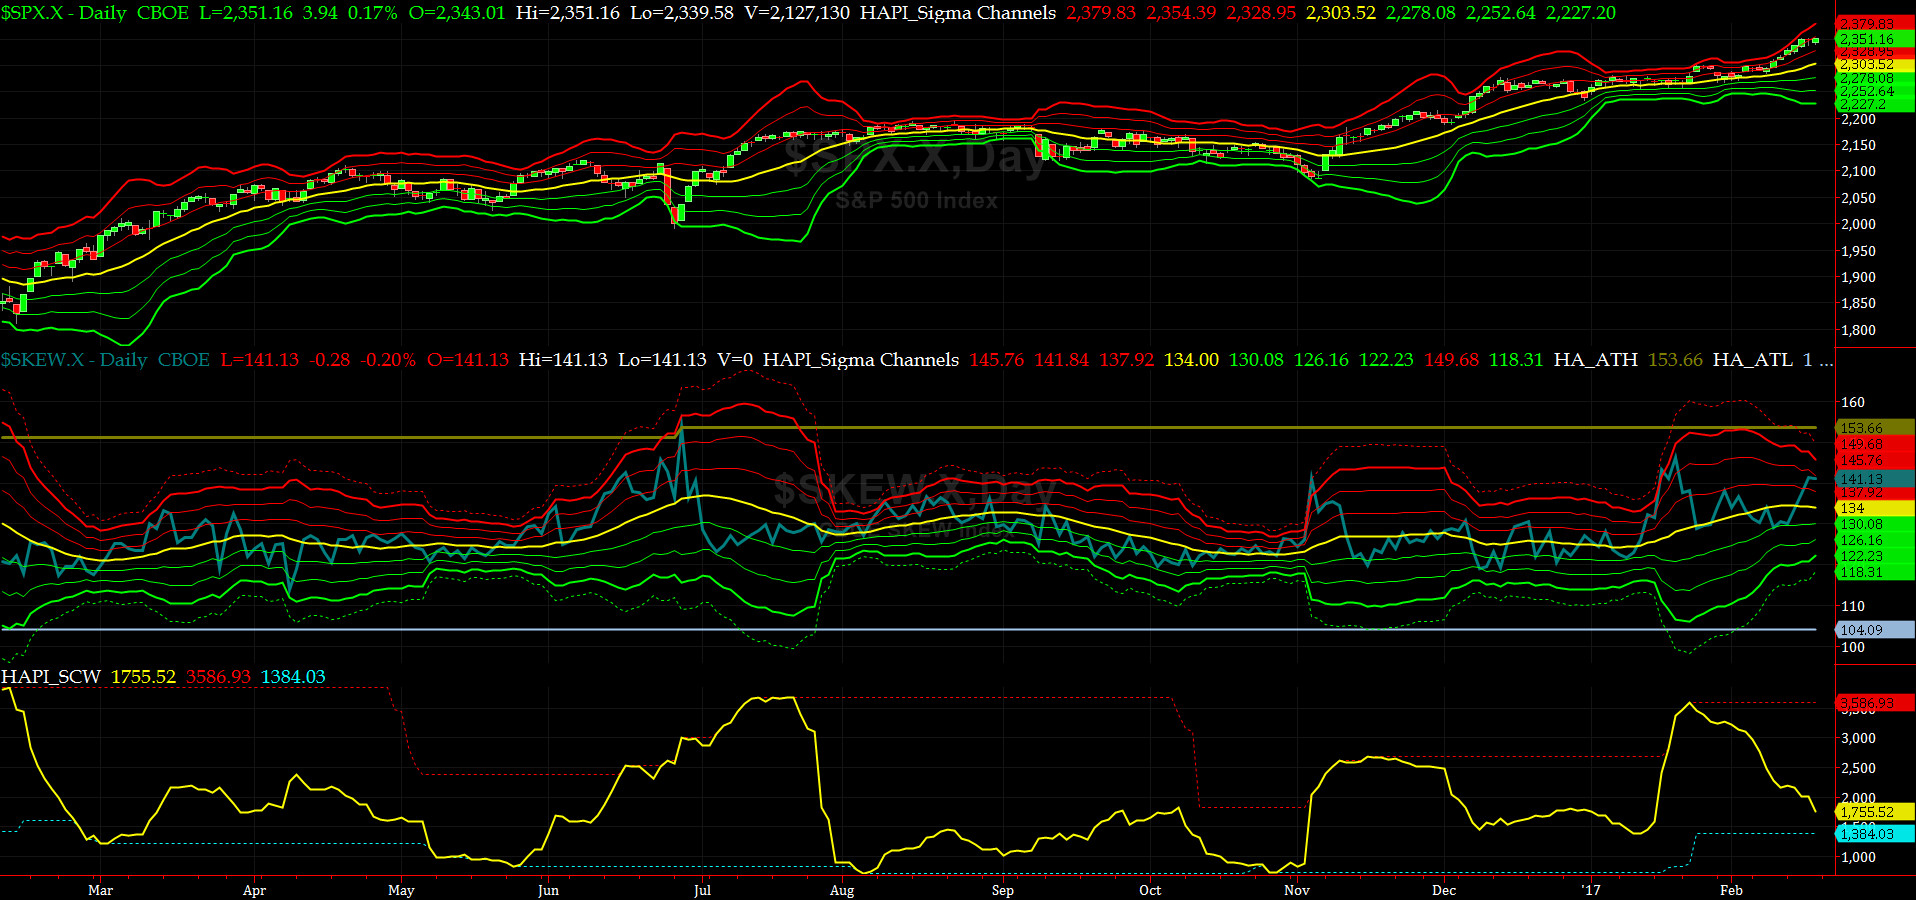
SPX SKEW (Tail Risk) Chart
Last week SPX SKEW (Tail Risk) shot up and ended just about its +2 sigma at 141. (normal = 120-125, range 100-150).
All is NOT quiet on the Eastern & Mid-Western Fronts....Big Players are priced a tail risk here. We also see the same in VIX Call purchases. We know what they are thinking but would LOVE to KNOW what they KNOW.
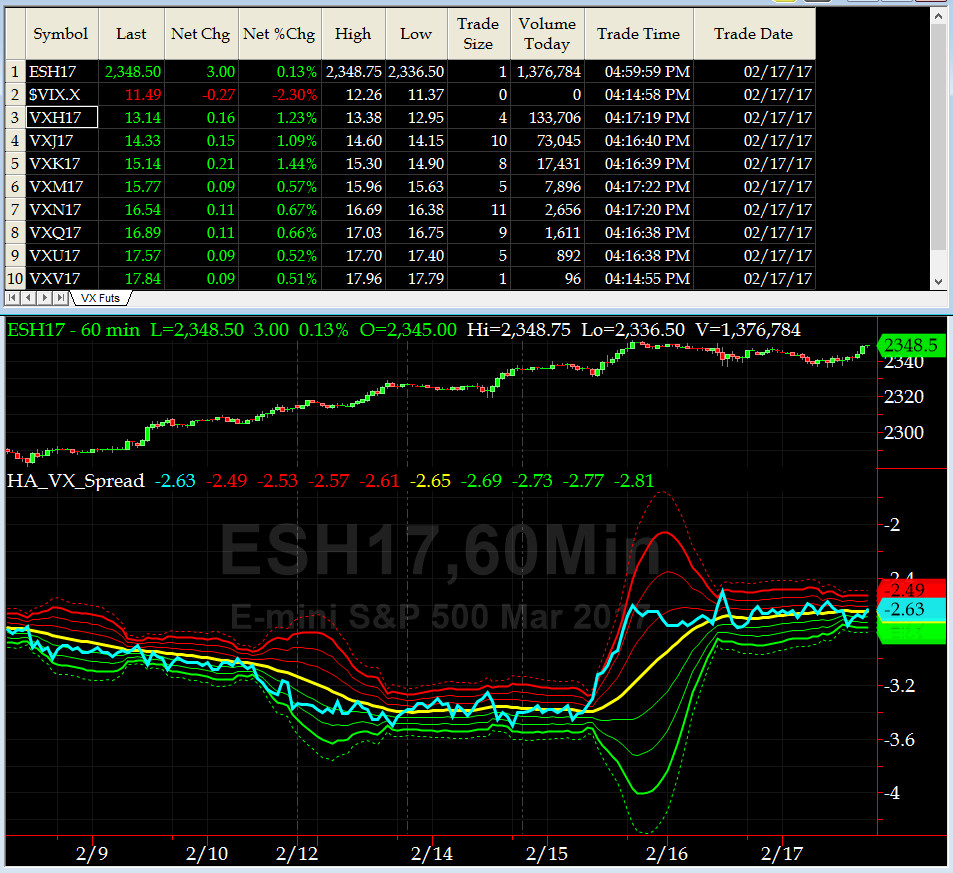
3-month VIX Futures Spread(VX) Chart
Please do not ask us to explain what happened on Feb 15, it does not make sense, yet, as SPX went up and our VX Spread (LONG MAR SHORT JUN) went up sharply. On Friday, the spread closed at 2.63 near its zero sigma.

HA_SP2 Chart
HA_SP2 = 90+ (Buy signal <= 25, Sell Signal >= 75)
SP2 is now in UBER OVERBOUGHT zone, thanks to Grumpie & Co. (which is not registered with FINRA or NFA, lol).
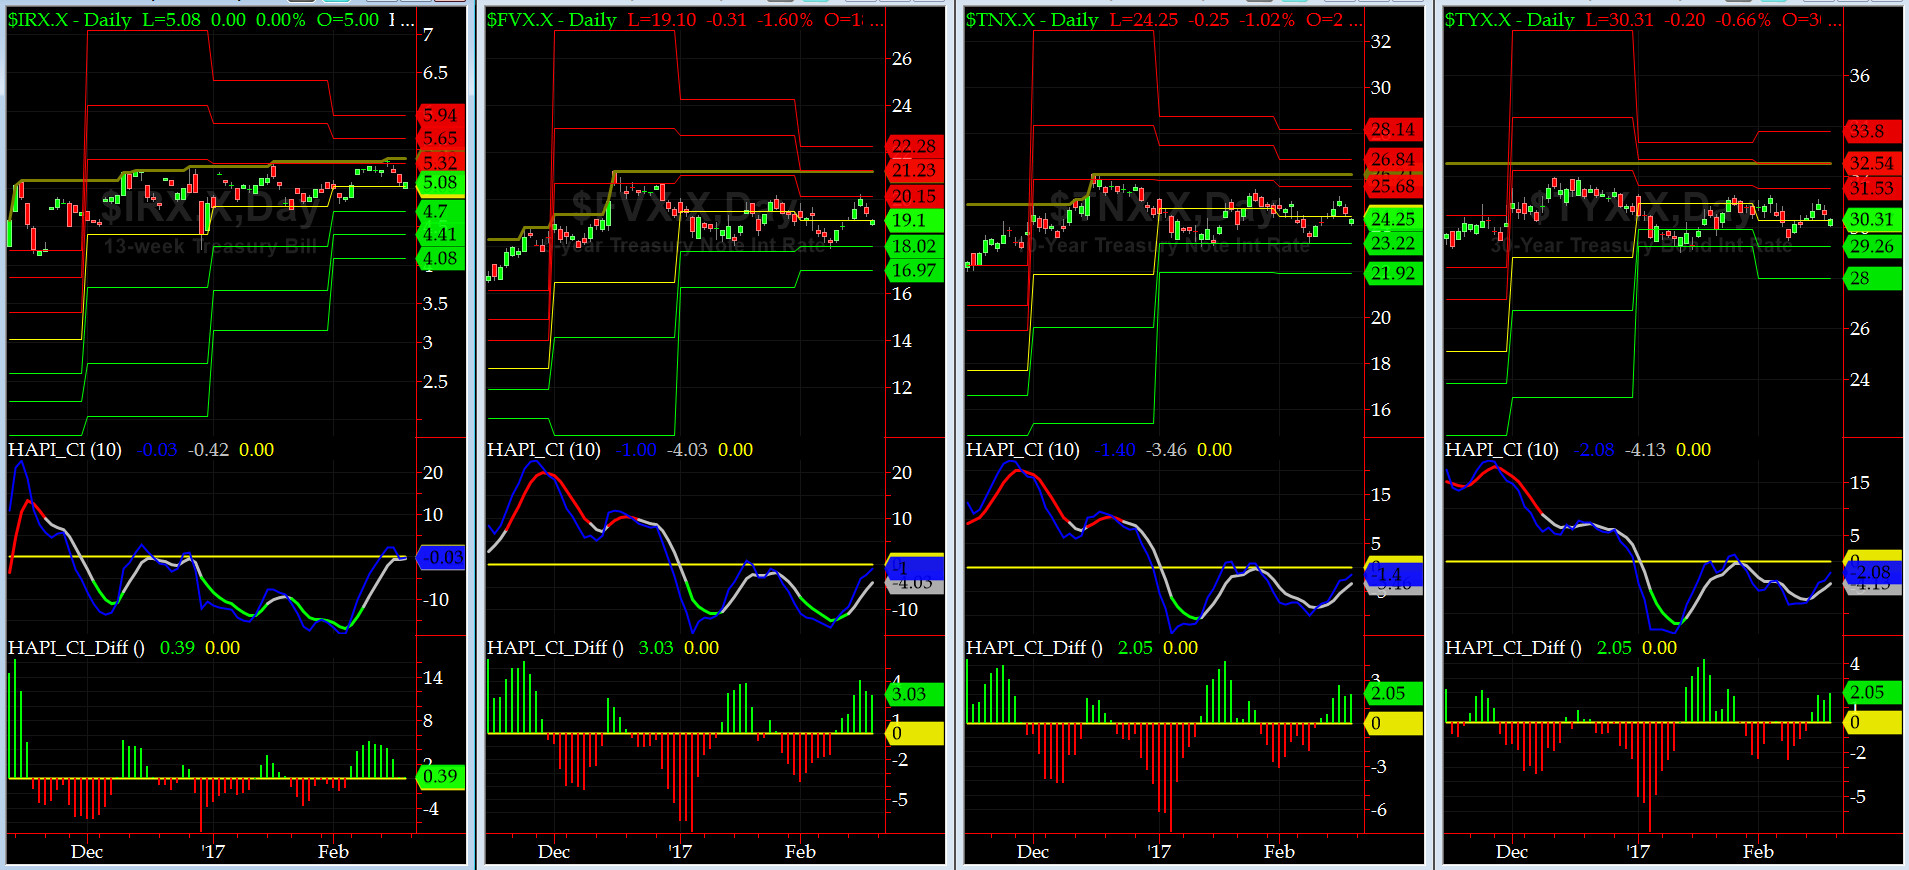
US Treasury T-Notes & T-Bonds Yields Chart
The Treasury Complex YTMs gave back about on Resistance Level and ended on Friday at their respective pivots.
Fari Hamzei
|


 Proactive Market Timing


