|
Sunday, February 26, 2017, 1600ET
Market Timing Charts, Analysis & Commentary for Issue #182
Timer Charts of S&P-500 Cash Index (SPX) + NASDAQ-100 Cash Index (NDX)
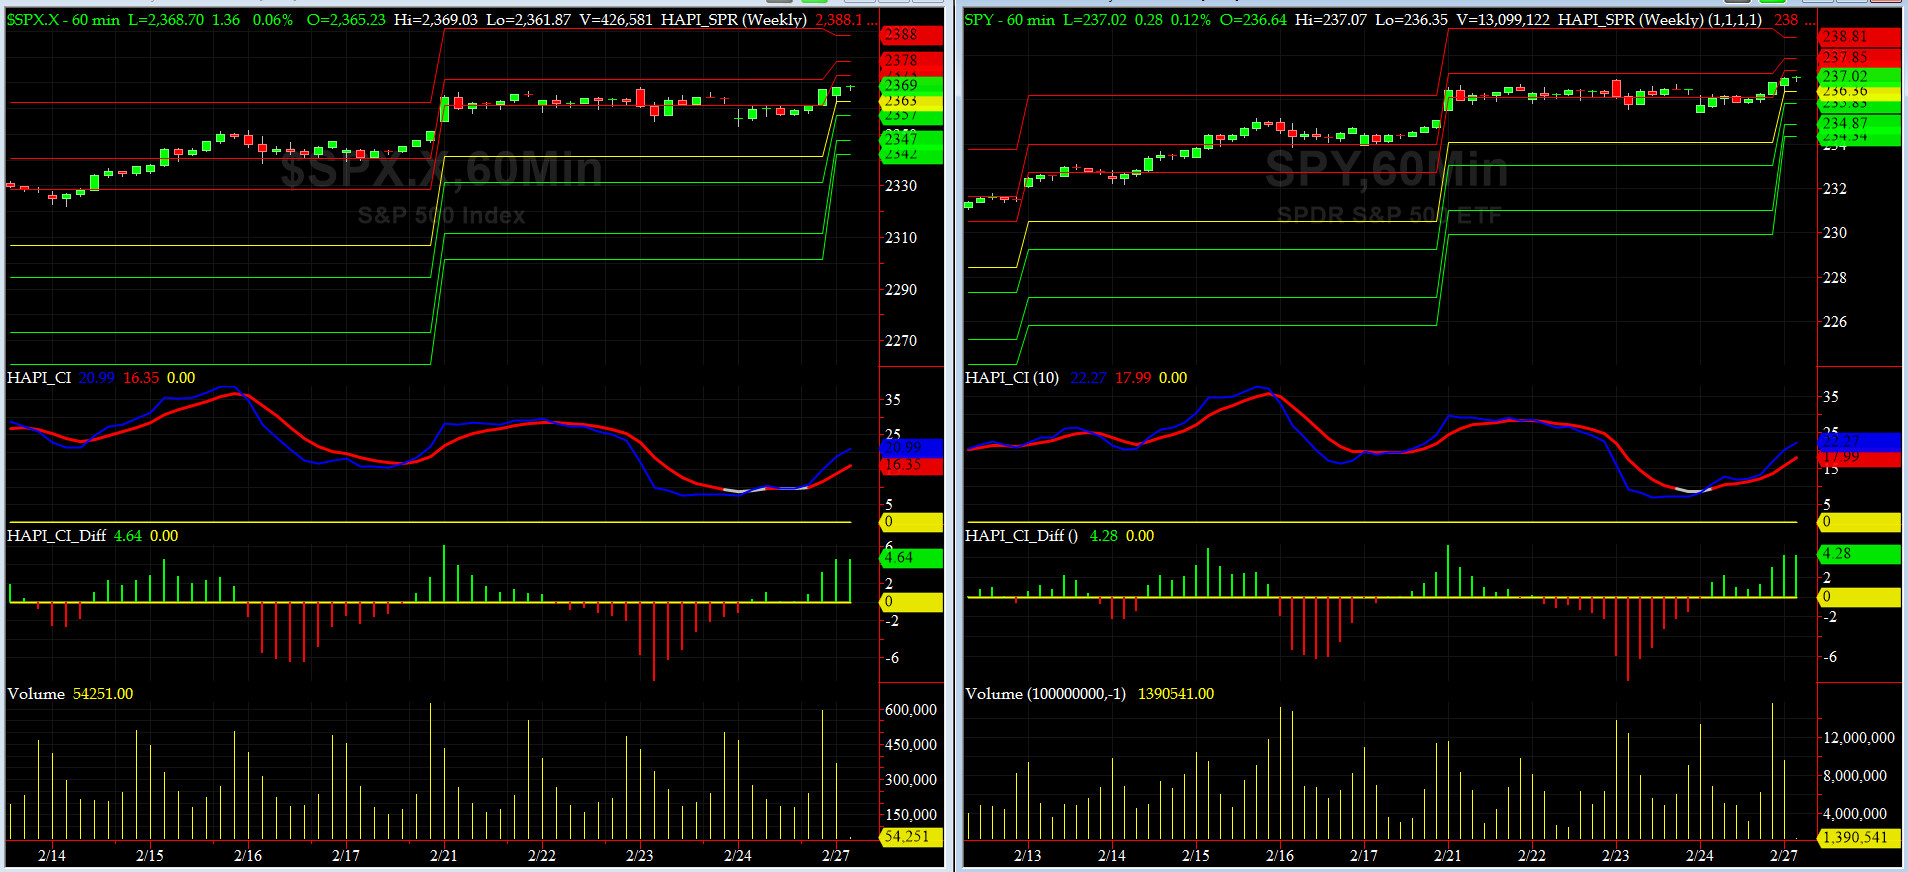
Most recent S&P-500 Cash Index (SPX): 2367.34 up +16.18 (up +0.69%) for the week ending Friday, February 24th, 2017, which closed near its +1.5 sigma.
SPX ALL TIME INTRADAY HIGH = 2368.26 (reached on Thursday, February 23, 2017)
SPX ALL TIME CLOSING HIGH = 2367.34 (reached on Friday, February 24, 2017)
Current DAILY +2 Sigma SPX = 2384 with WEEKLY +2 Sigma = 2387
Current DAILY 0 Sigma (20 day MA) SPX = 2319 with WEEKLY 0 Sigma = 2235
Current DAILY -2 Sigma SPX = 2255 with WEEKLY -2 Sigma = 2084
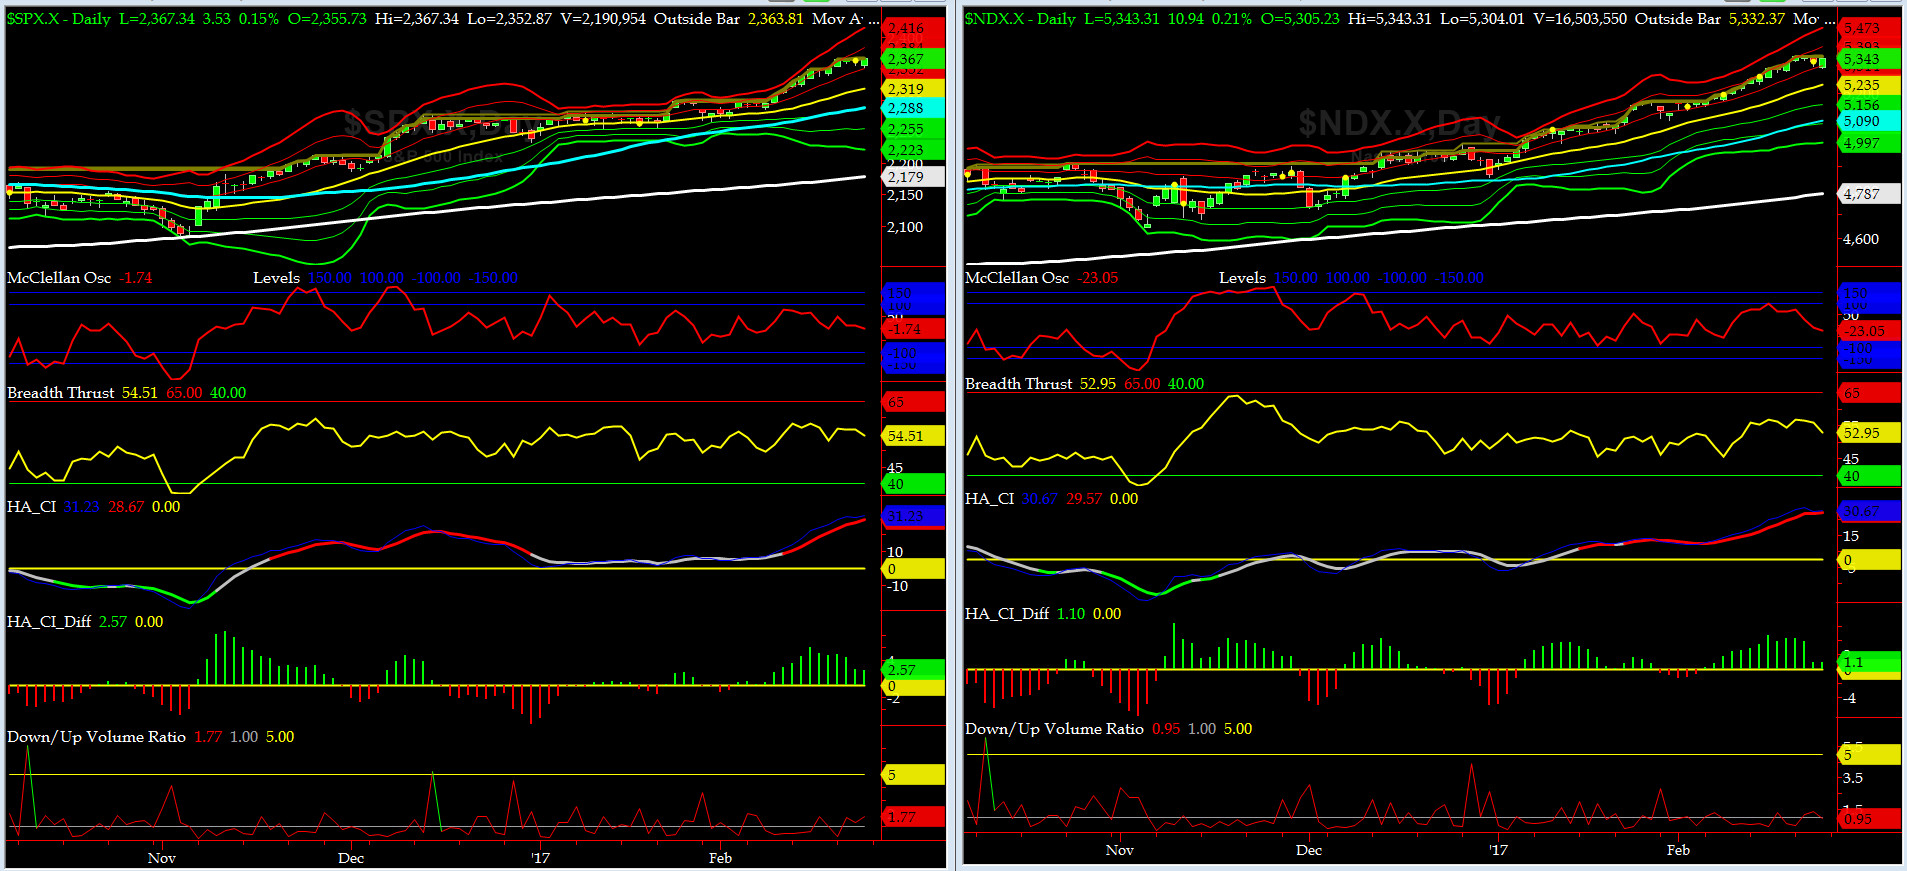
NYSE McClellan Oscillator = -2 (-150 is start of the O/S area; around -275 to -300 area or lower, we go into the �launch-pad� mode, over +150, we are in O/B area)
NYSE Breadth Thrust = 54.5 (40 is considered as oversold and 65 as overbought)
Grumpie is still full of hot gas and markets still can't figure him out so they just stayed long. Still seeing no catalyst in sight for a major pullback while we remain uber overbought. Locate the Eject Handle... DO NOT PULL YET, sailor.
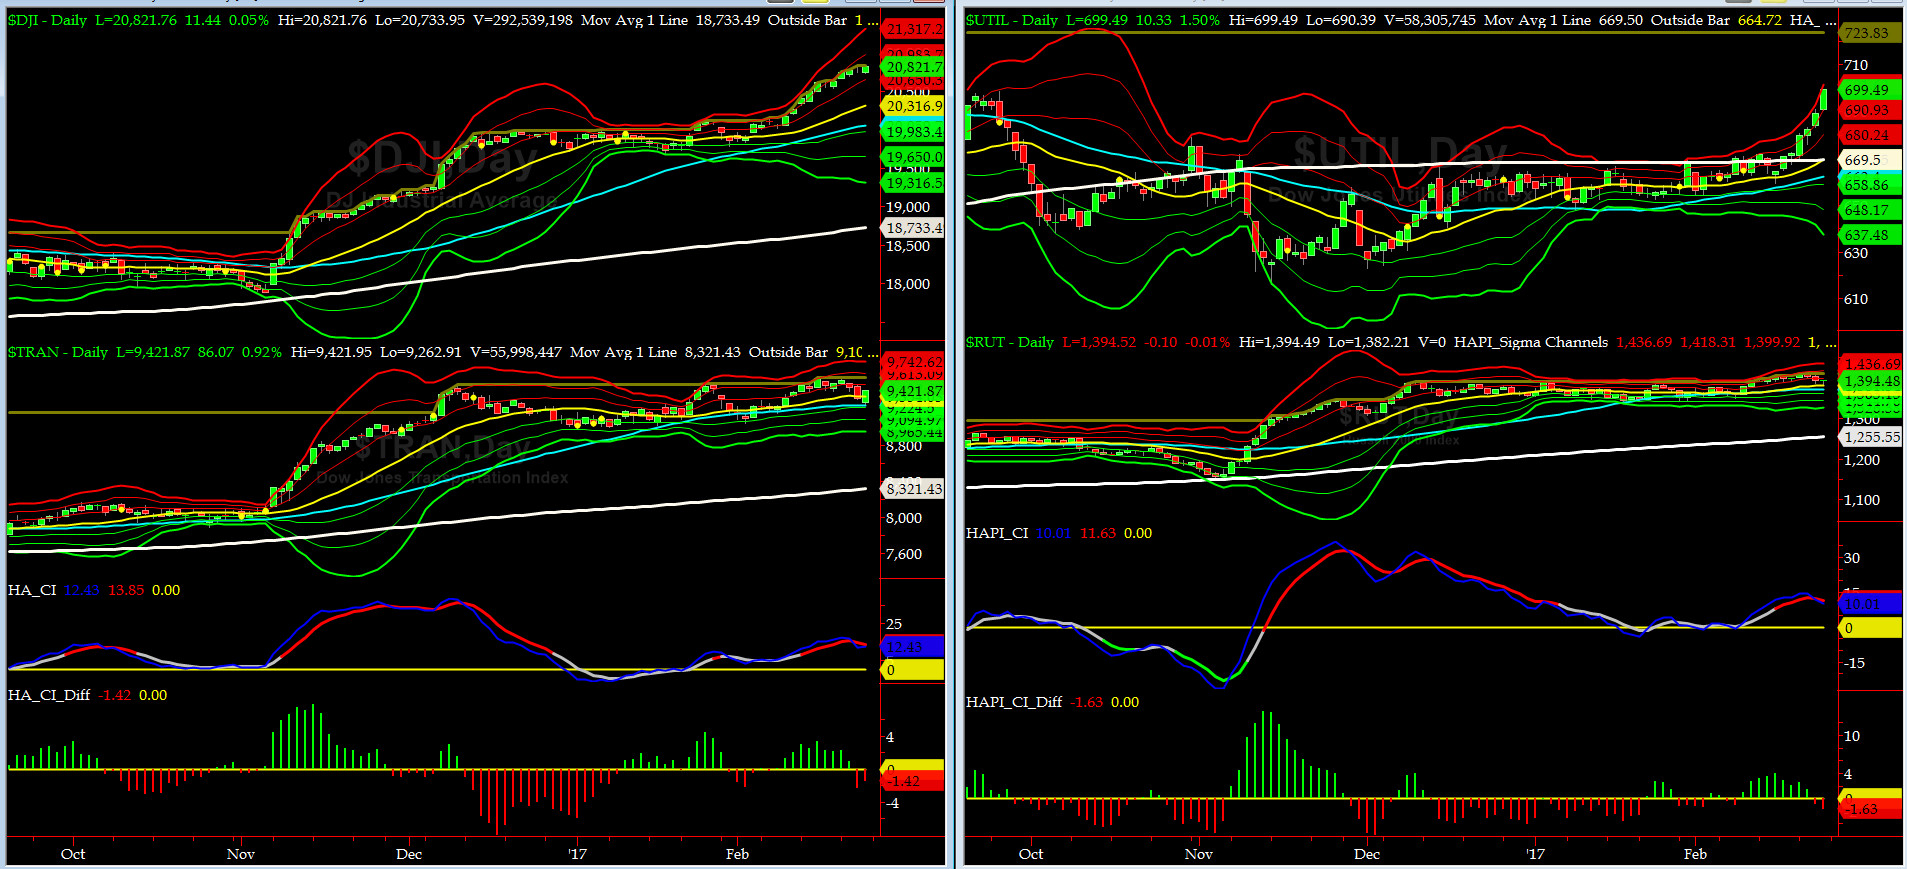
Canaries [in the Coal Mine] Chart for DJ TRAN & RUT Indices
200-Day MA DJ TRAN = 8321 or 13.2% below DJ TRAN (max observed in last 5 yrs = 20.2%, min = -20.3%)
200-Day MA RUT = 1255 or 11.1% below RUT (max observed in last 5 yrs = 21.3%, min = -22.6%)
DJ Transports (proxy for economic conditions 6 to 9 months hence) bounce one more time off of its 50day MA after making another ATH seven trading days ago.
Russell 2000 small caps (proxy for Risk ON/OFF) sold off hard and then rallied on Friday. RISK remains HOT RED.
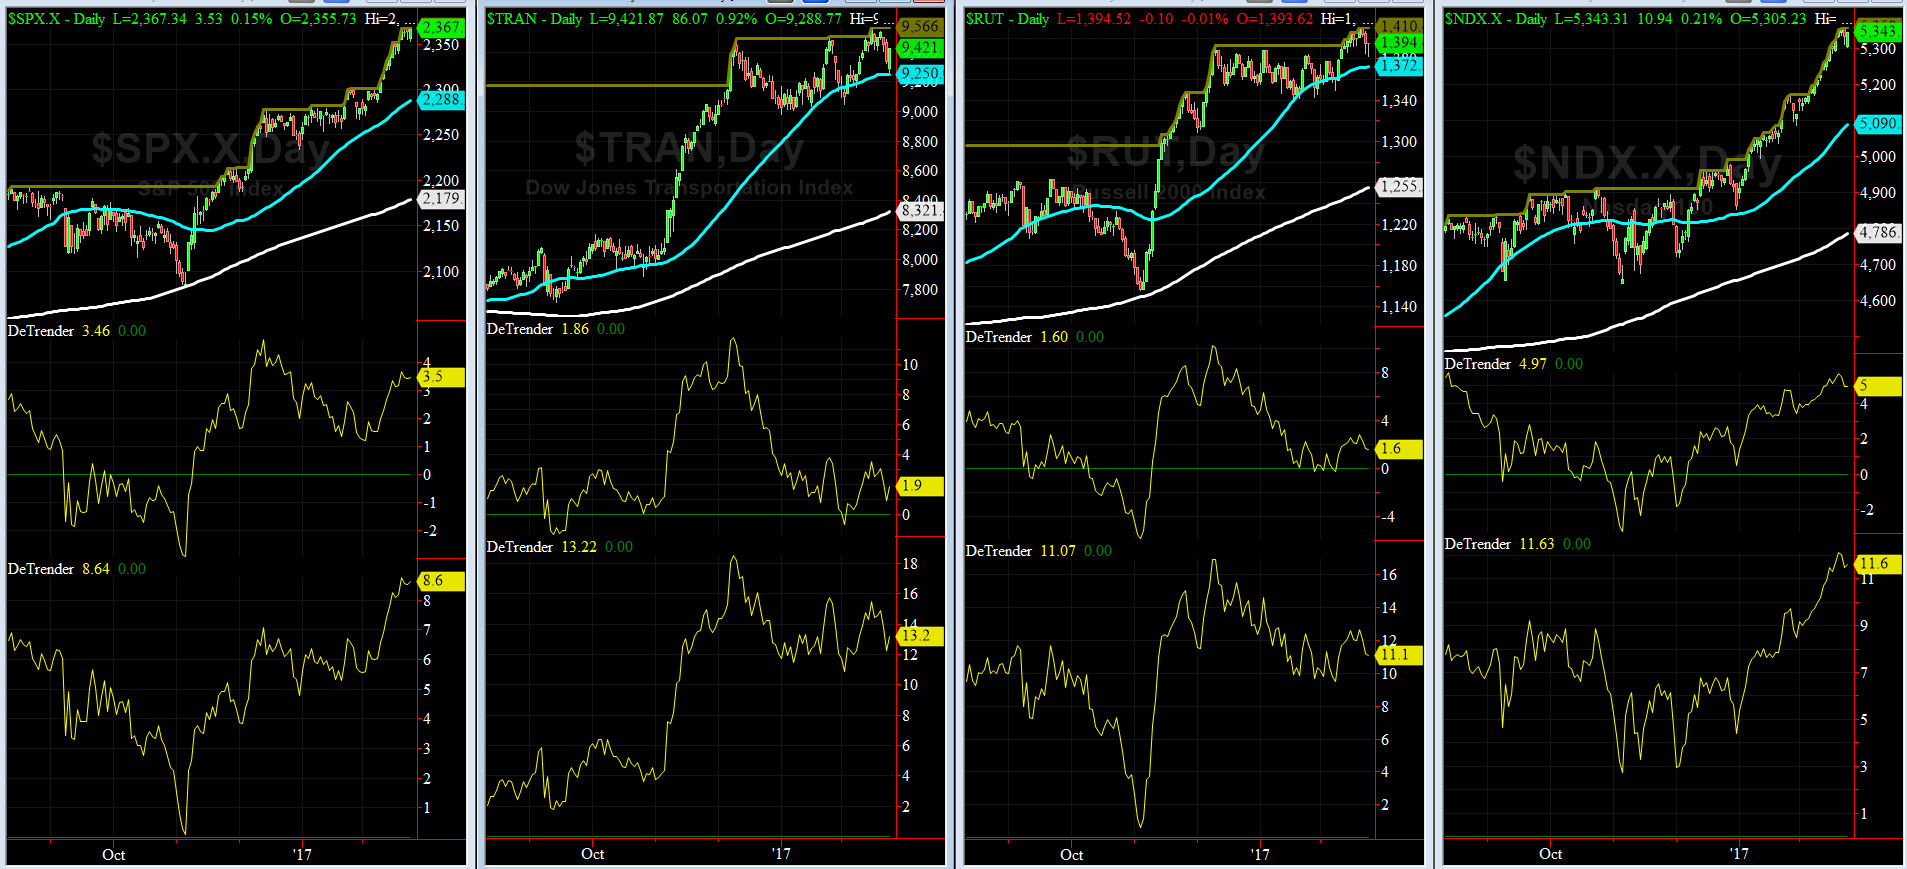
DeTrenders Charts for SPX, NDX, TRAN & RUT Indices
50-Day MA SPX = 2288 or 3.5% below SPX closed on Friday (max observed in last 5 yrs = +8.6%, min = -9.3%)
200-Day MA SPX = 2179 or 8.6% below SPX (max observed in last 5 yrs = 15.2%, min = -14%)
Still all eight of our De Trenders remain positive again. The De Trenders for DJ Tran & RUT will continue to be harbingers of future price behavior in broad indices.
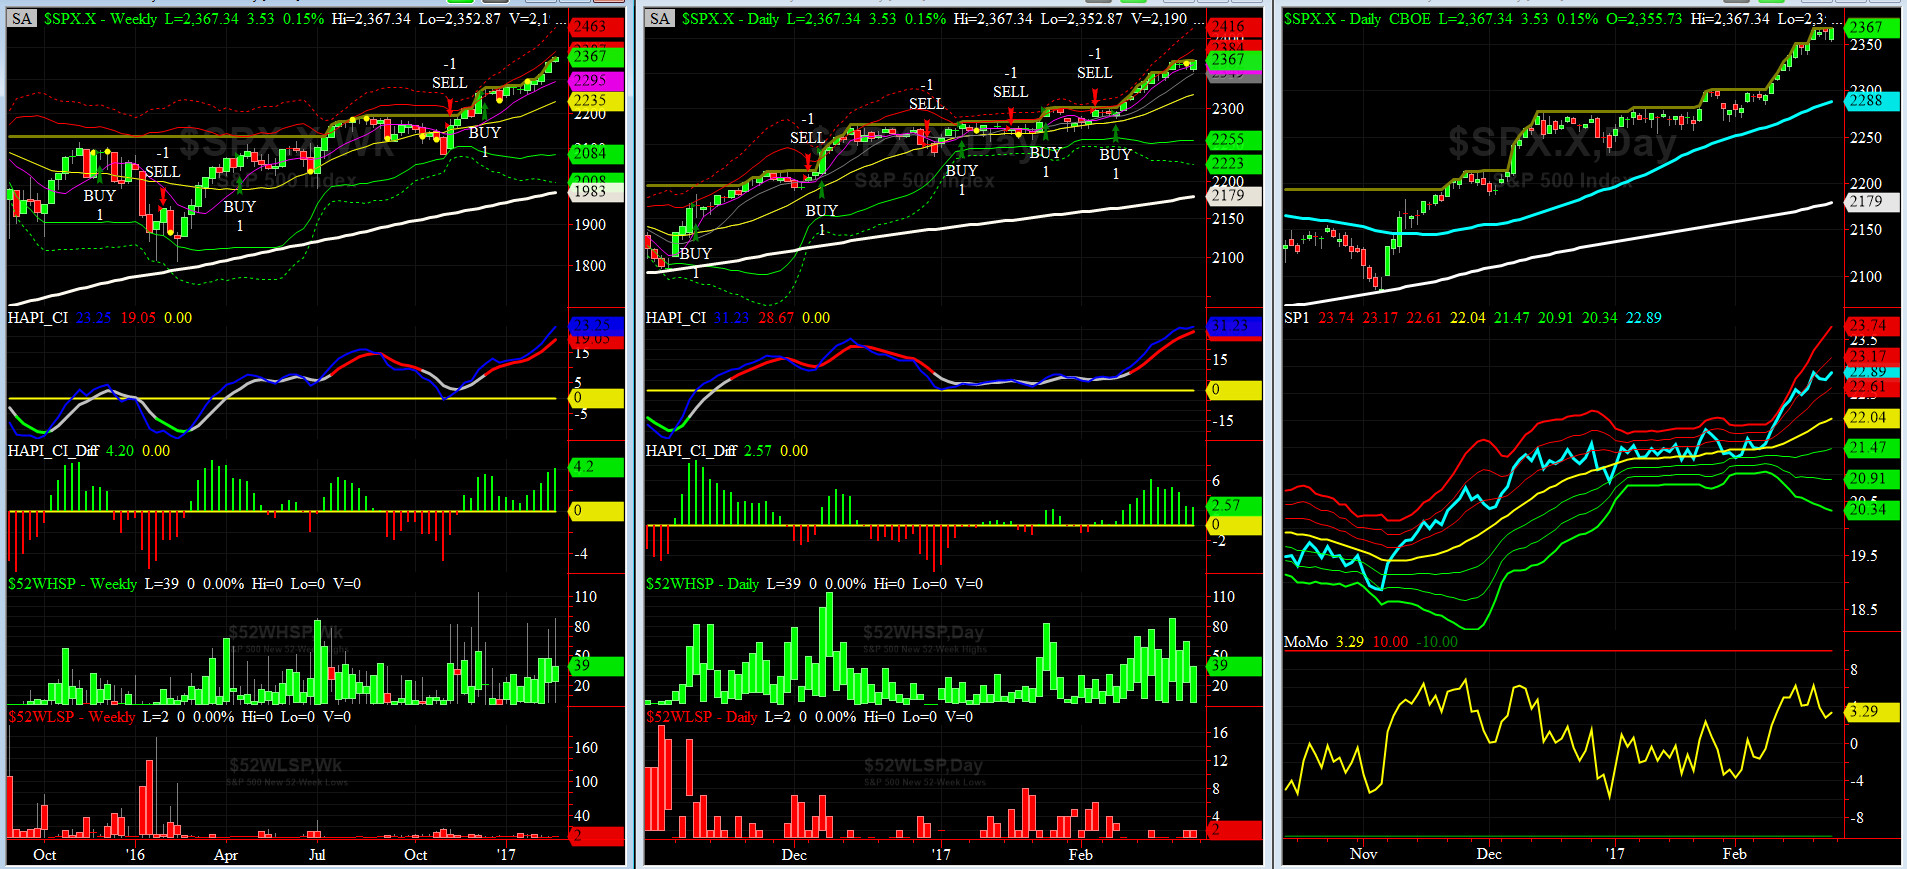
HA_SP1_Momo Chart
WEEKLY Timing Model = on a BUY Signal since Friday 12/16/16 CLOSE at 2258
DAILY Timing Model = on a BUY Signal since Wednesday 2/8/17 CLOSE at 2295
Max SPX 52wk-highs reading last week = 88 (over 120-140, the local maxima is in)
Max SPX 52wk-Lows reading last week = 2 (over 40-60, the local minima is in)
HA_SP1 at just about its +1.5 sigma channels
HA_Momo = +3.3 (reversals most likely occur above +10 or below -10)
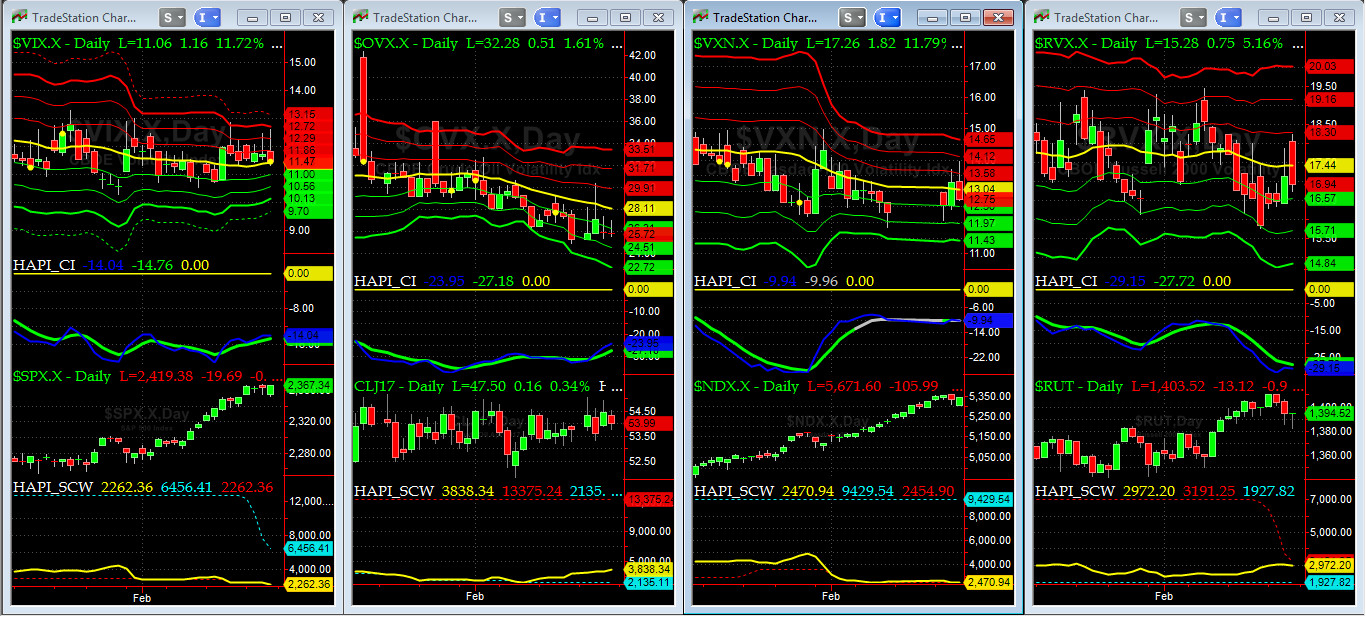
Vol of the Vols Chart
VIX is currently at its zero sigma level at 11.47 (remember it�s the VIX�s vol pattern (its sigma channels) that matters, and not the level of VIX itself (this is per Dr. Robert Whaley, a great mentor and the inventor of original VIX, now called VXO). VIX usually peaks around a test of its +4 sigma).
Net net the VOL Complex was sleep last week, much our beloved ROMAN friends. LOL.
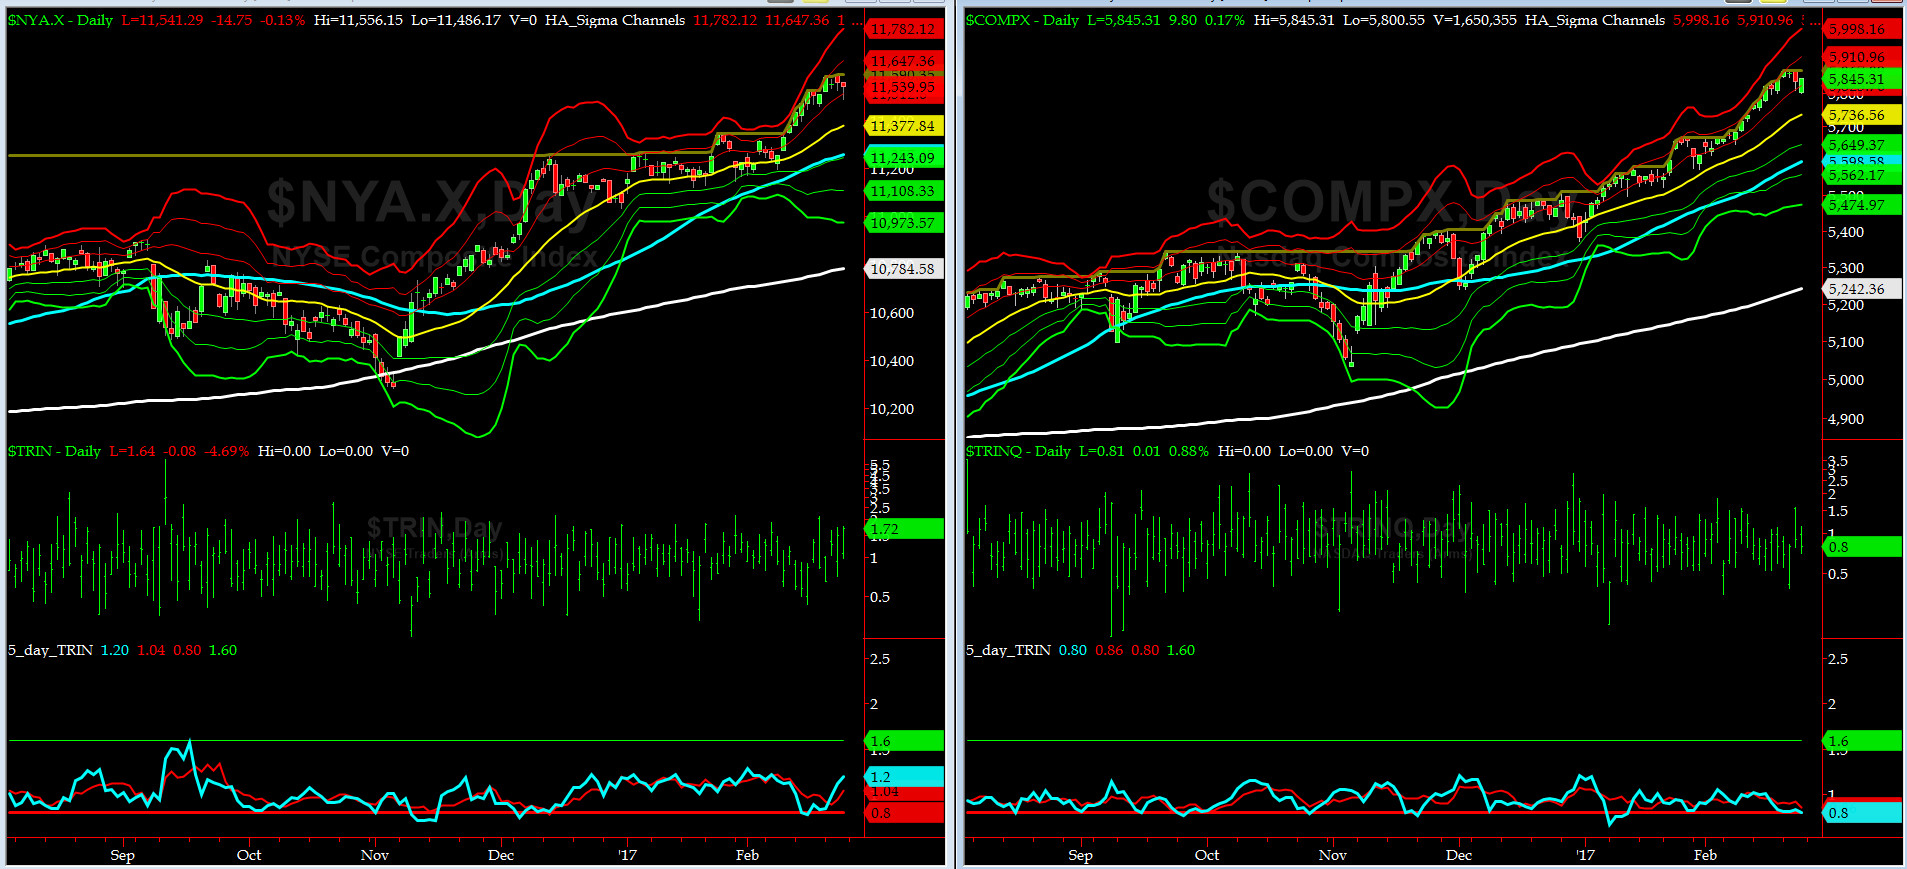
5-day TRIN & TRINQ Charts
NYSE 5-day TRIN is on NEUTRAL but NASDAQ 5-day TRIN is on a SELL signal. Stay tuned sailors....

Components of SPX above their respective 200day MA Chart
This week this scoring indicator rose to over 82% twice... now comes the waiting game of seeing it diverge with SPX soon. Stock up on iced tea, my XO, Capt Tiko says. He knows too well. One time it took us 6 divergences before everything fell apart. OUCH.

SPX SKEW (Tail Risk) Chart
Last week SPX SKEW (Tail Risk) shot up and ended just about its +2 sigma at 138. (normal = 120-125, range 100-150).
All is NOT semi-quiet on the Eastern & Mid-Western Fronts....Big Players backed off from pricing a big tail risk here.
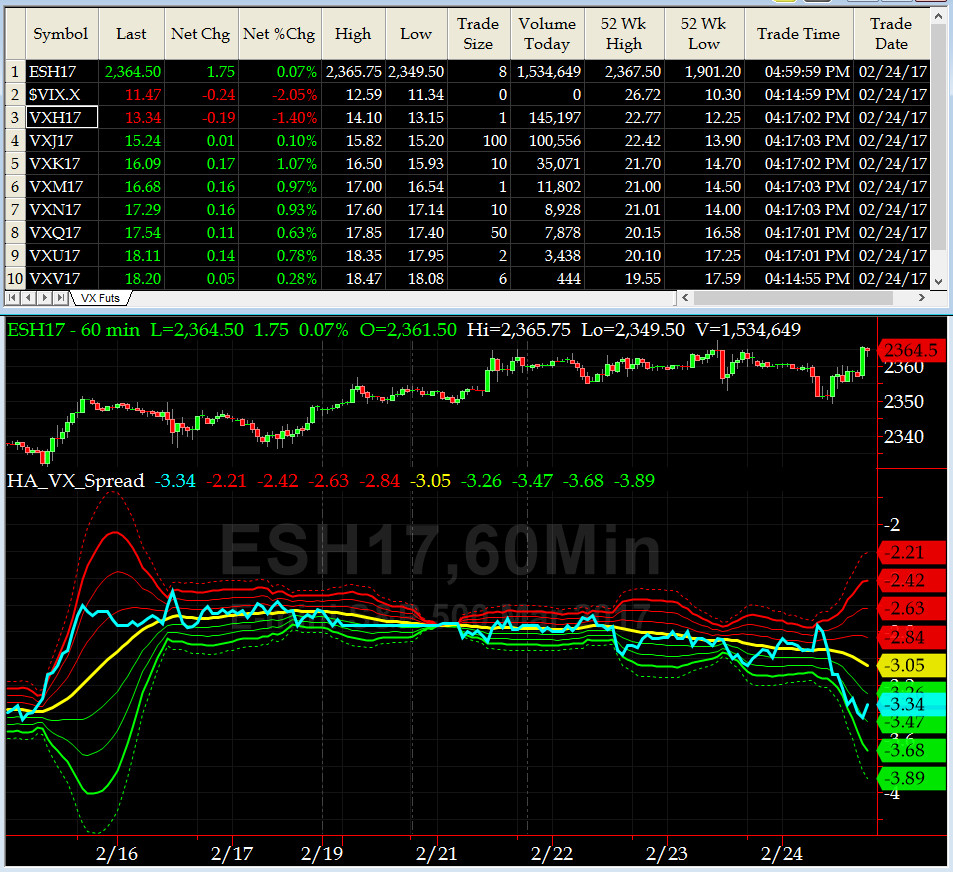
3-month VIX Futures Spread(VX) Chart
Our VX Spread (LONG MAR SHORT JUN) is back to behaving normally as shown on the chart. On Friday, the spread closed at -3.34 near its -1.5 sigma.

HA_SP2 Chart
HA_SP2 = 88.88 (Buy signal <= 25, Sell Signal >= 75)
SP2 is still in UBER OVERBOUGHT zone, thanks to Grumpie & Co. (which is **still** not registered with FINRA or NFA, lol). We are keeping an eye on our StochRSI (subgraph under SP2) as its three timeframes are finally merging in overbought zone.
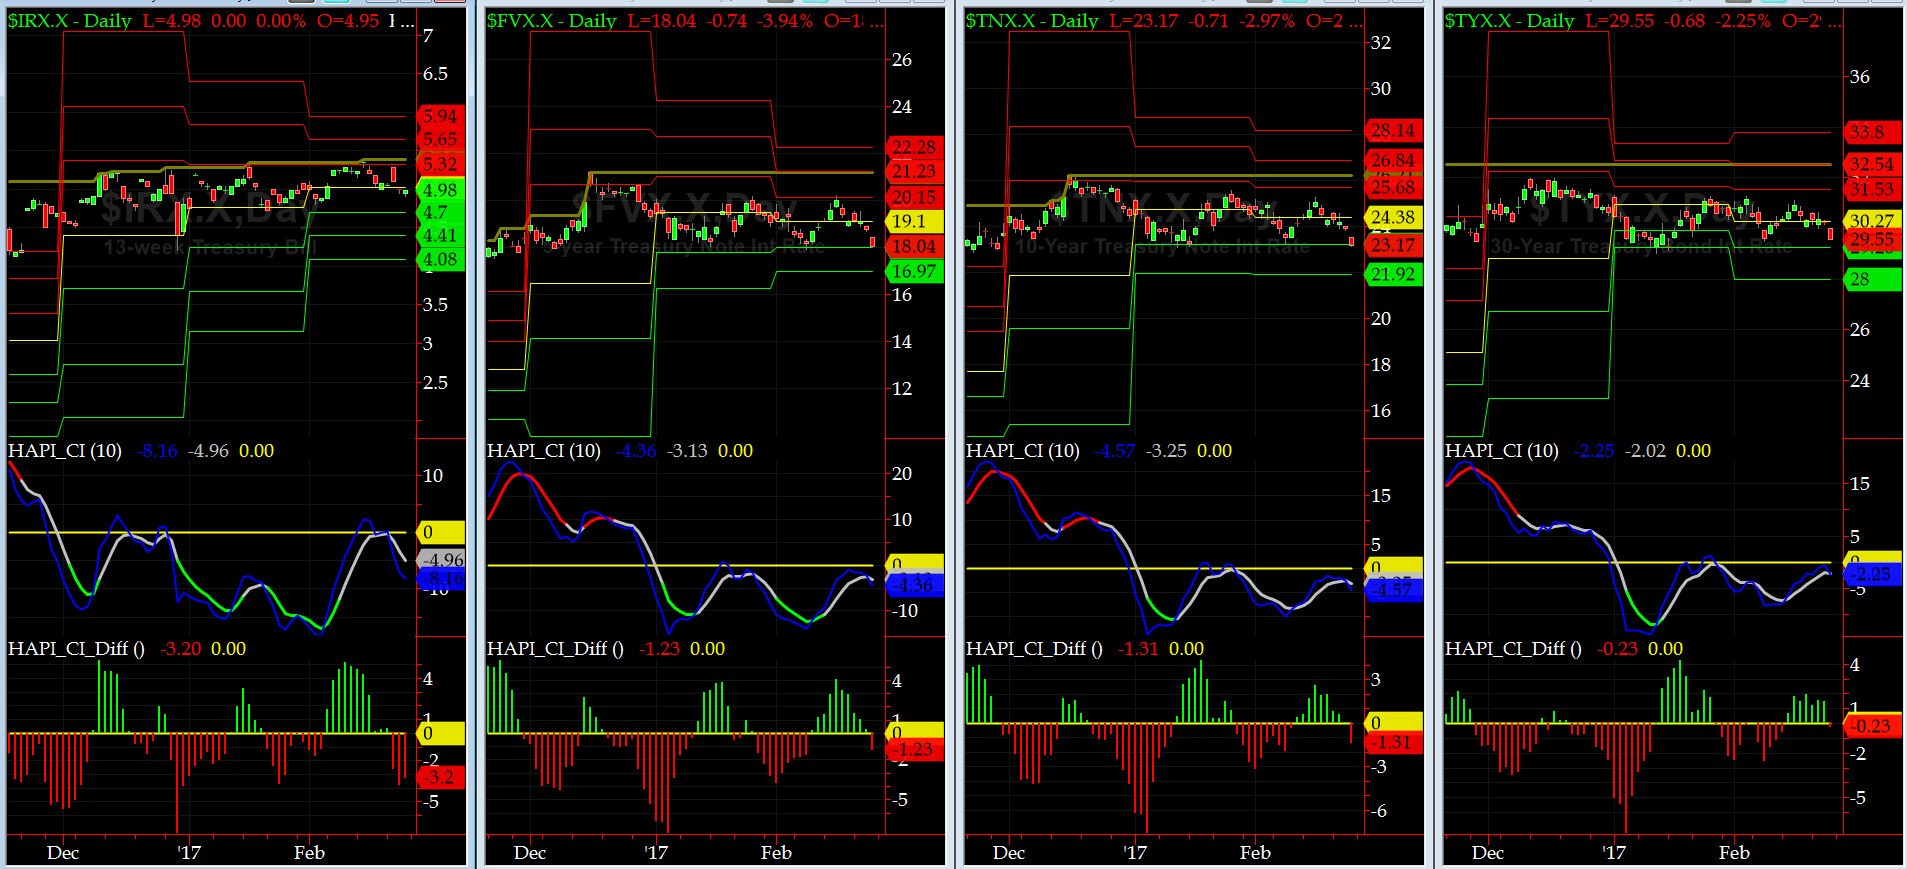
US Treasury T-Notes & T-Bonds Yields Chart
The mid to long end of the Treasury Complex YTMs gave back another monthly level and on Friday ended near their respective Monthly Support One Levels as the long end rallied. We love the OTF Treasury Streamer.
Fari Hamzei
|


 Proactive Market Timing