|
Sunday, April 30, 2017, 1430ET
Market Timing Charts, Analysis & Commentary for Issue #190
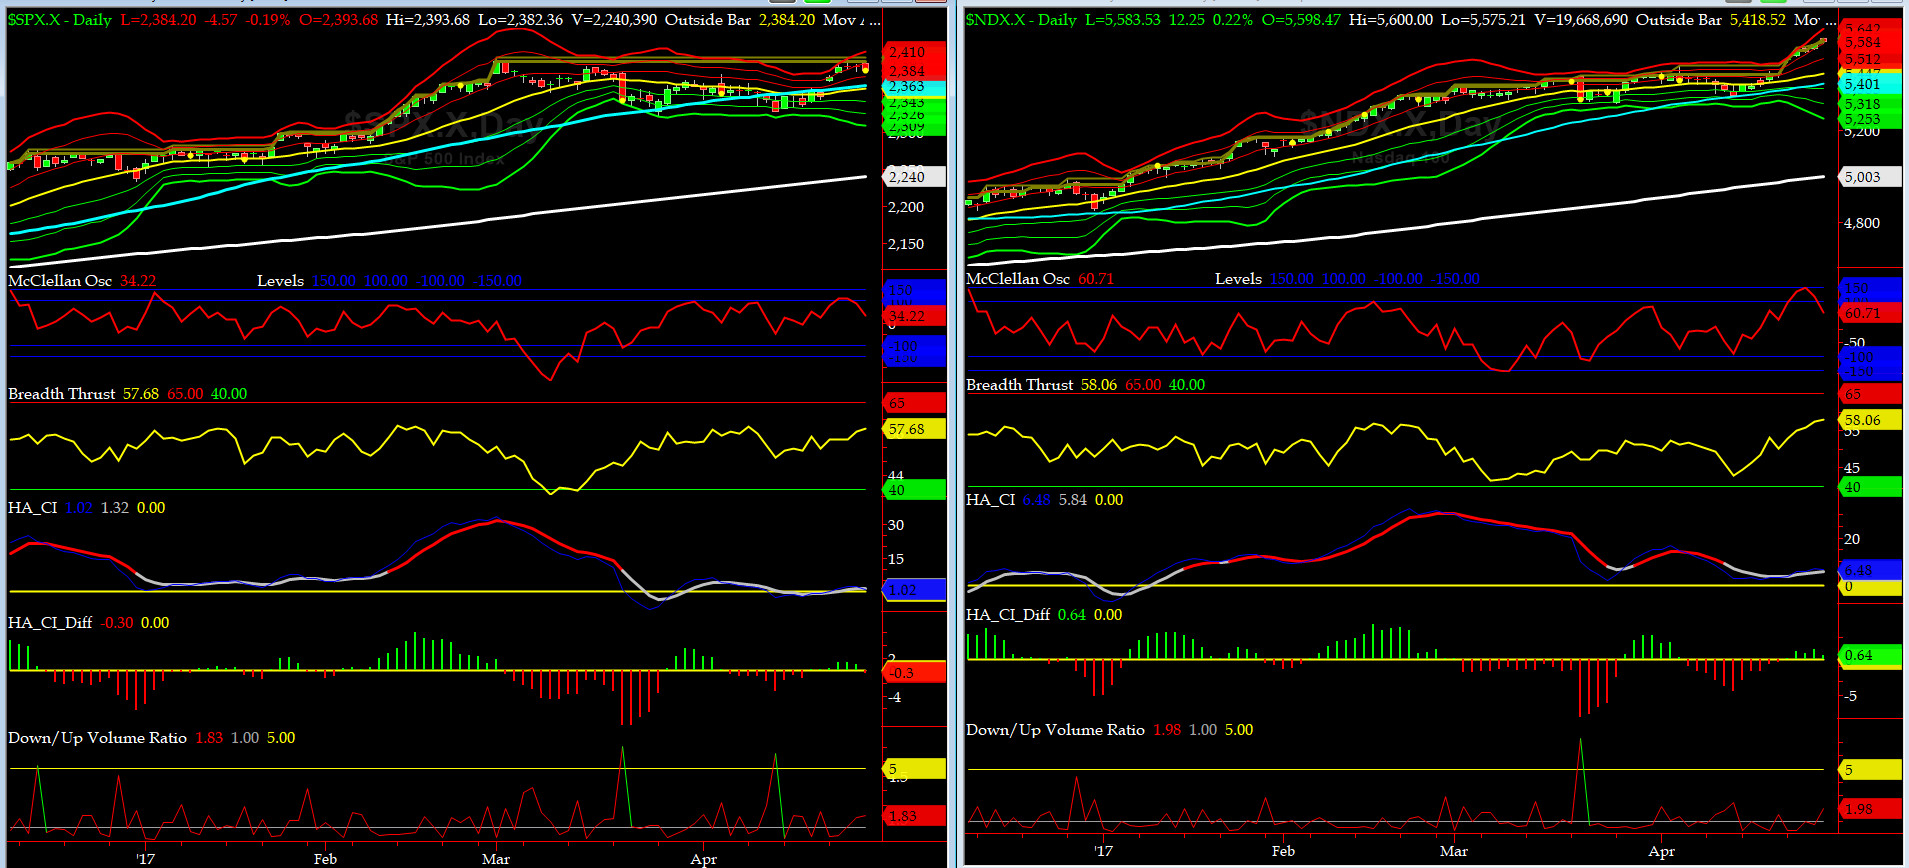
Timer Charts of S&P-500 Cash Index (SPX) + NASDAQ-100 Cash Index (NDX)
Most recent S&P-500 Cash Index (SPX): 2384.20 up +35.51 (up +1.5%) for the week ending Friday, April 28, 2017, which closed just above its at +1 sigma.
SPX ALL TIME INTRADAY HIGH = 2400.98 (reached on Wednesday, March 1, 2017)
SPX ALL TIME CLOSING HIGH = 2395.96 (reached on Wednesday, March 1, 2017)
Current DAILY +2 Sigma SPX = 2393 with WEEKLY +2 Sigma = 2416
Current DAILY 0 Sigma (20 day MA) SPX = 2359 with WEEKLY 0 Sigma = 2323
Current DAILY -2 Sigma SPX = 2326 with WEEKLY -2 Sigma = 2231
NYSE McClellan Oscillator = +34 (-150 is start of the O/S area; around -275 to -300 area or lower, we go into the �launch-pad� mode, over +150, we are in O/B area)
NYSE Breadth Thrust = 57.7 (40 is considered as oversold and 65 as overbought)
Marine Le Pen coming in second in the first round of French presidential elections gave the market a relief rally. It will be short lived, ioho. But first we need to go thru AAPL, FB & TSLA earnings on Tuesday & Wednesday and then April NFP this coming Friday.
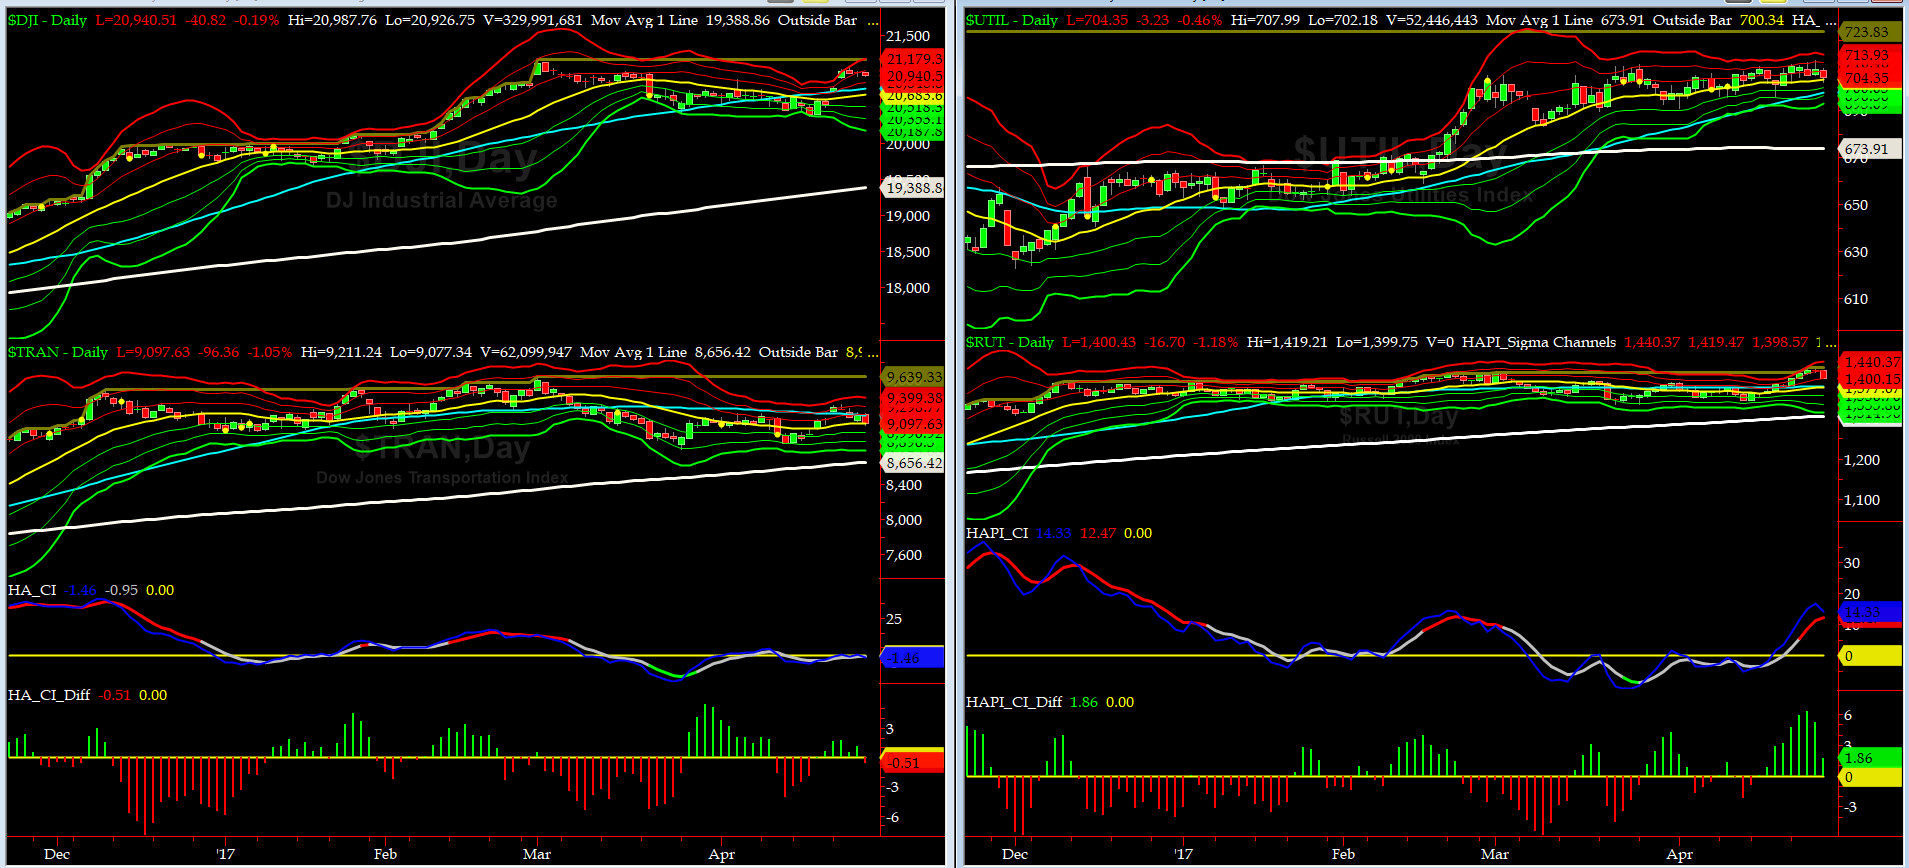
Canaries [in the Coal Mine] Chart for DJ TRAN & RUT Indices
200-Day MA DJ TRAN = 8656 or 5.1% below DJ TRAN (max observed in last 5 yrs = 20.2%, min = -20.3%)
200-Day MA RUT = 1306 or 7.2% below RUT (max observed in last 5 yrs = 21.3%, min = -22.6%)
DJ Transportation Index (proxy for economic conditions 6 to 9 months hence) gapped up & rallied on Monday and then gave it all back and then some (last weekend gap filled).
In like fashion, Russell 2000 Small Caps Index (proxy for Risk ON/OFF) also rallied albeit to a new ATH on Thursday and then gave back about 55% of the last week rally on Thursday & Friday. All told, for now, RISK is ON.
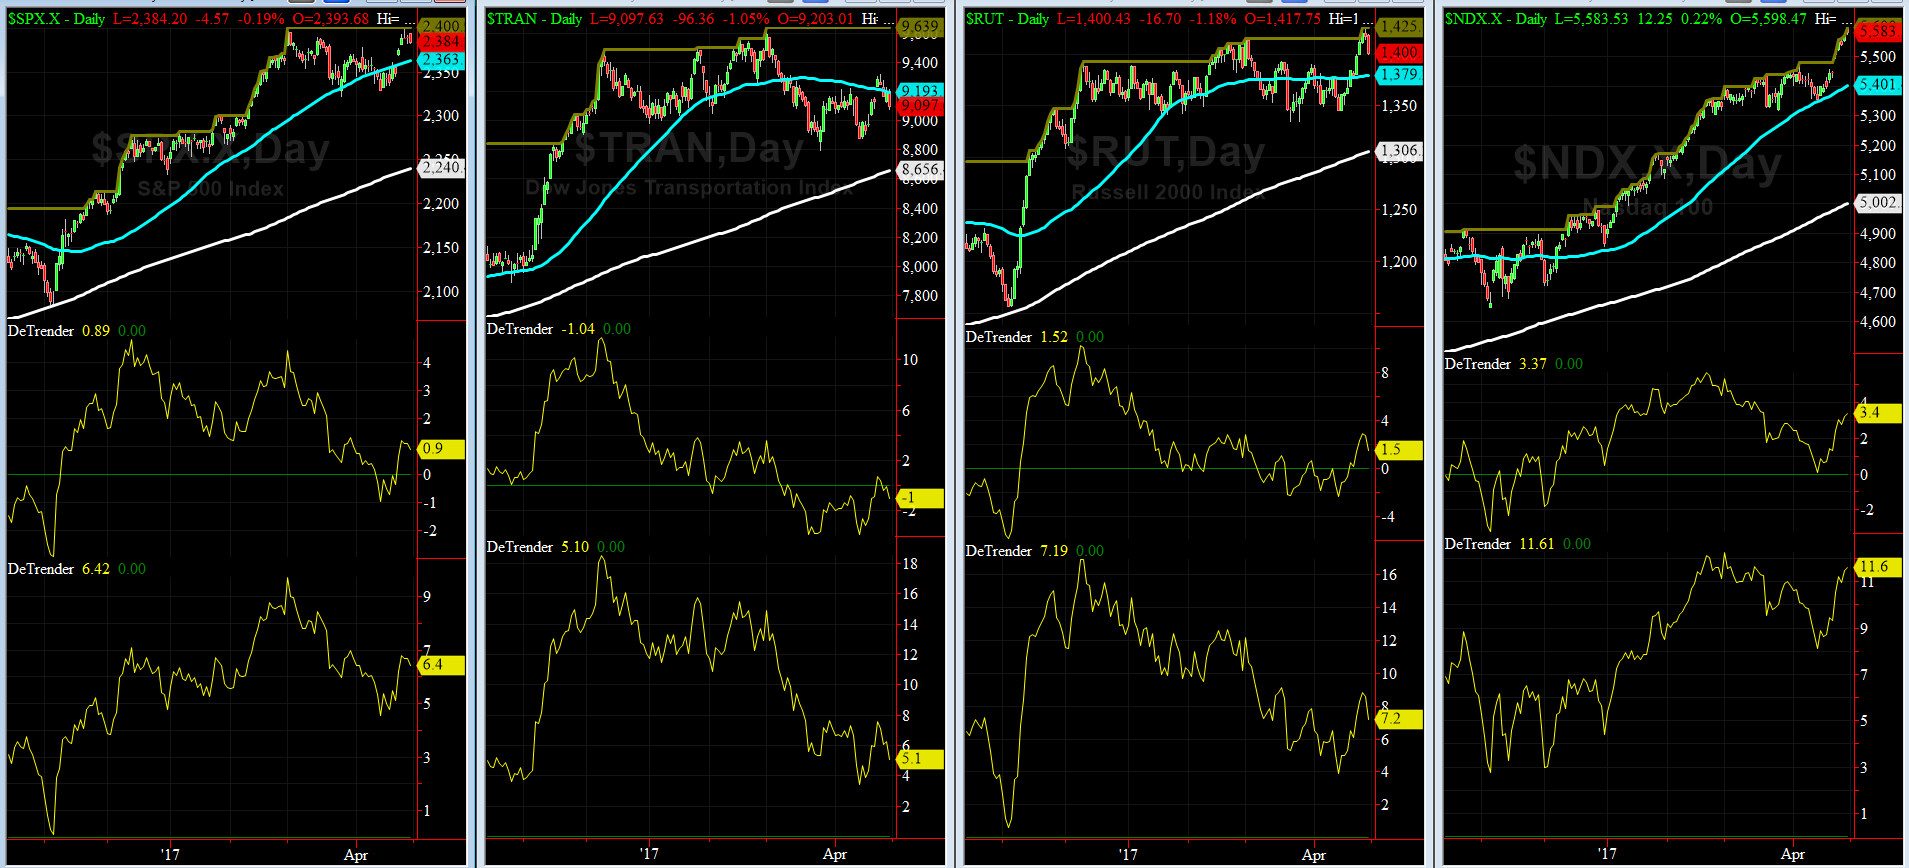
DeTrenders Charts for SPX, NDX, TRAN & RUT Indices
50-Day MA SPX = 2363 or 0.9% below SPX (max observed in last 5 yrs = +8.6%, min = -9.3%)
200-Day MA SPX = 2240 or 6.4% below SPX (max observed in last 5 yrs = 15.2%, min = -14%)
Only ONE of our EIGHT DeTrenders are now negative. The DeTrenders for DJ Tran & RUT will continue to be harbingers of future price behavior in broad indices.
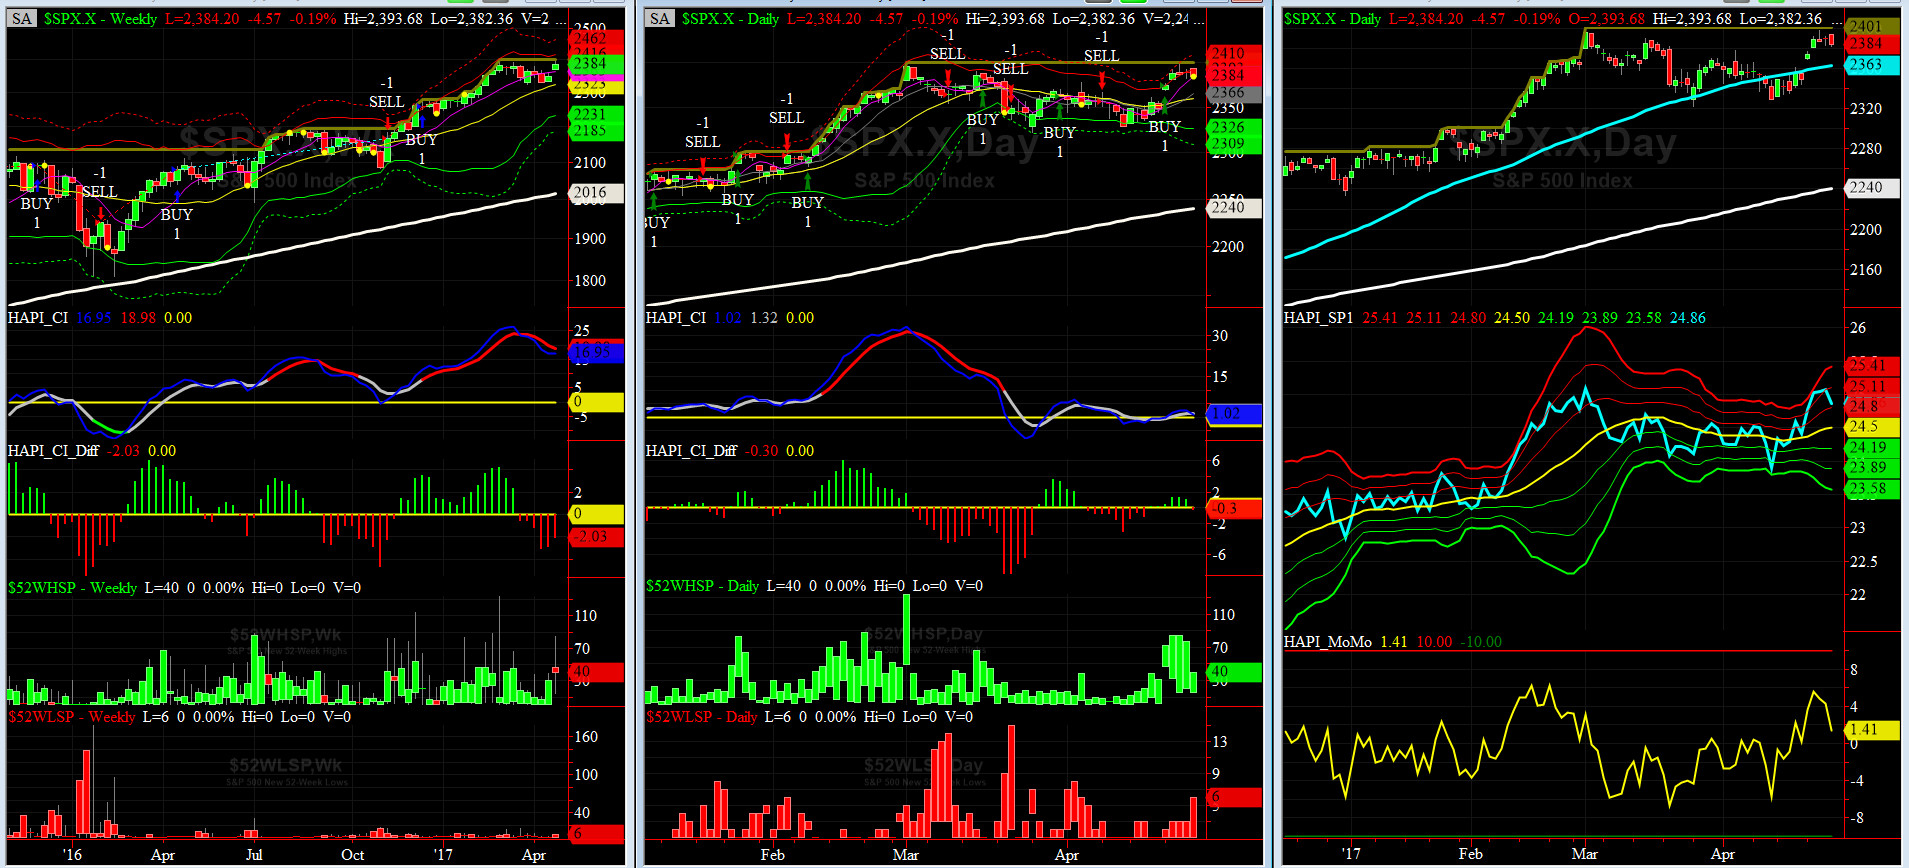
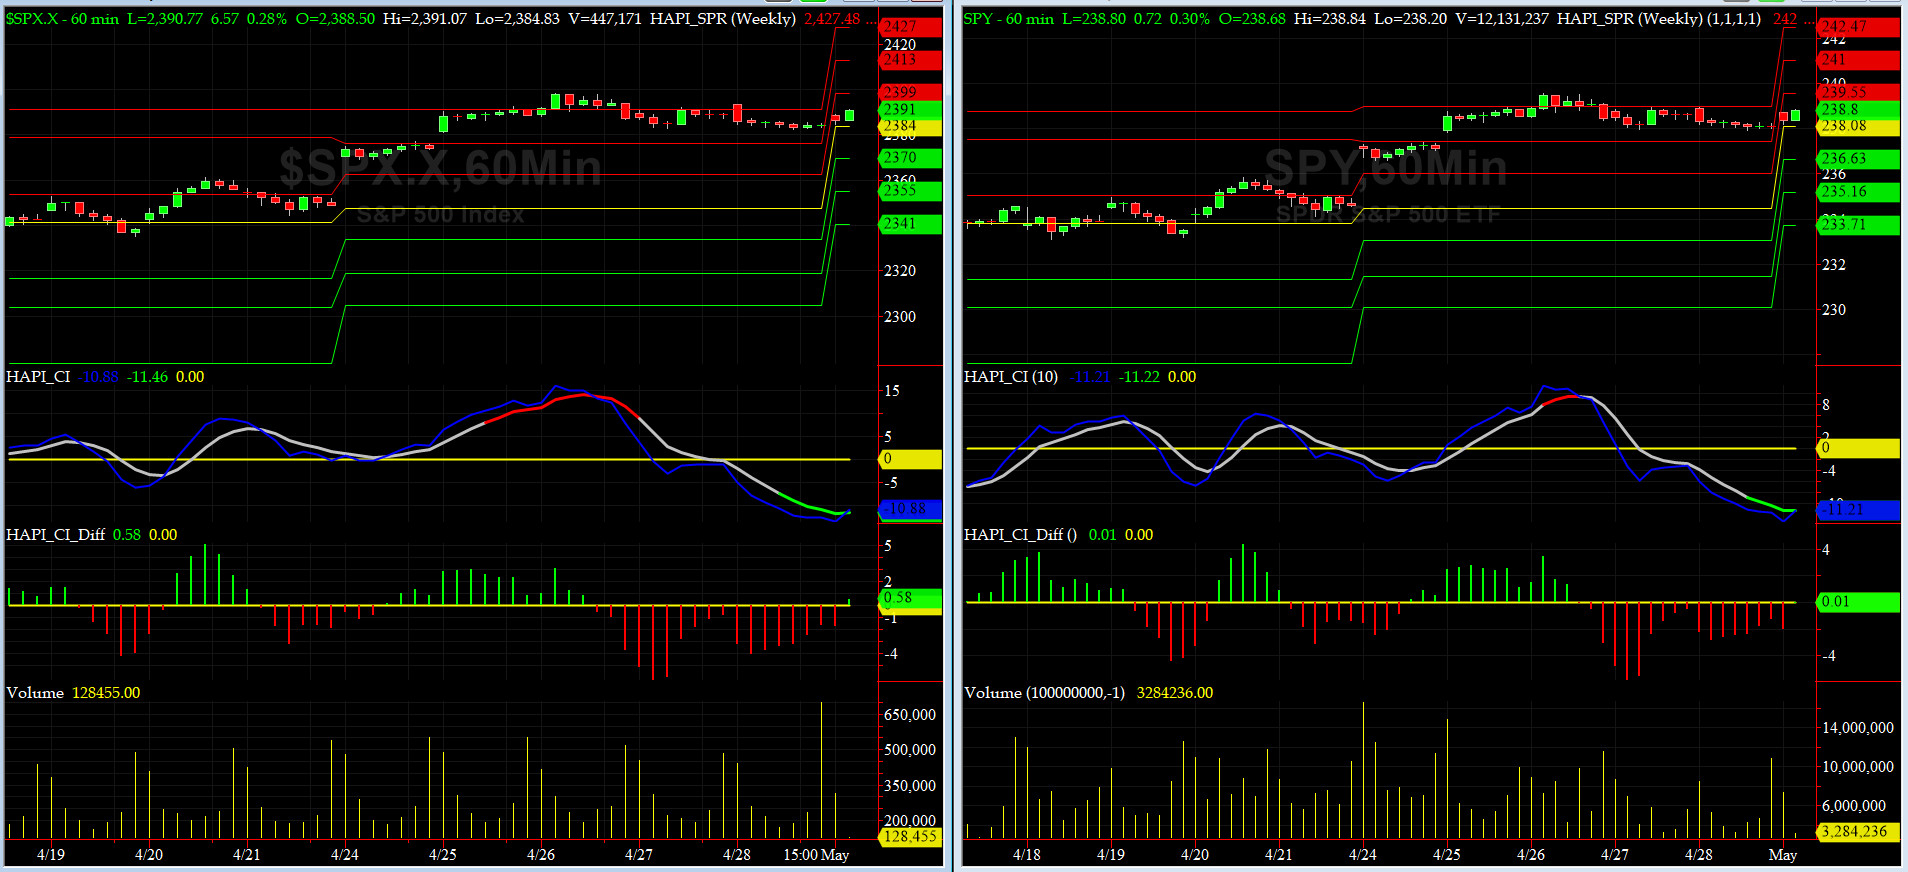
HA_SP1_Momo Chart
WEEKLY Timing Model = on a BUY Signal since Friday 12/16/16 CLOSE at 2258
DAILY Timing Model = on a BUY Signal since Monday 4/24/17 CLOSE at 2374
Max SPX 52wk-highs reading last week = 85 (over 120-140, the local maxima is in)
Max SPX 52wk-Lows reading last week = 6 (over 40-60, the local minima is in)
HA_SP1 at just above its +1 sigma channels
HA_Momo = +1.4 (reversals most likely occur above +10 or below -10)
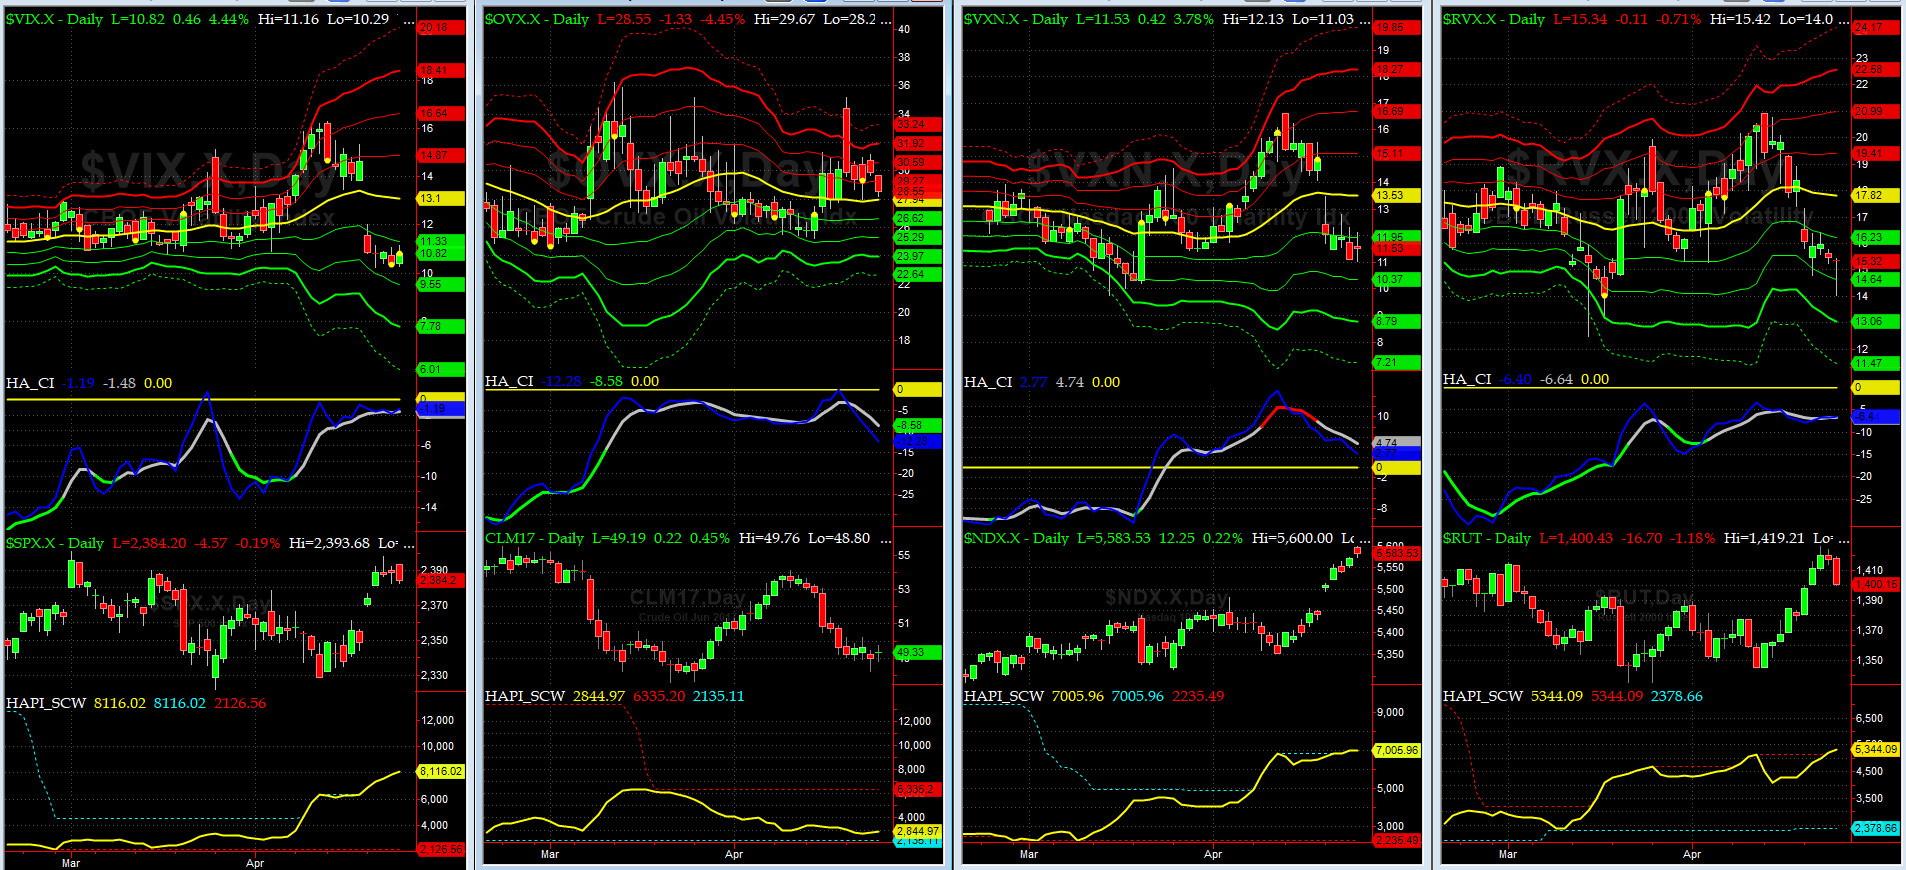
Vol of the Vols Chart
VIX is currently stands at 10.82, or just a tad below its -1 sigma (remember it�s the VIX�s volatility pattern (its sigma channels) that matters, and not the level of VIX itself (this is per Dr. Robert Whaley, a great mentor and the inventor of original VIX, now called VXO). VIX usually peaks around a test of its +4 sigma).
Last week, we were wrong again on VIX. This just says that the next drop, if and when it shows up, will be fast and furious. Our beloved Capt Tiko is ready, with fresh stockpiles of Iced Persian Tea and Albacore Tuna.

5-day TRIN & TRINQ Charts
Both of our 5-day TRINs are in NEUTRAL zone here. No Signal as of now.
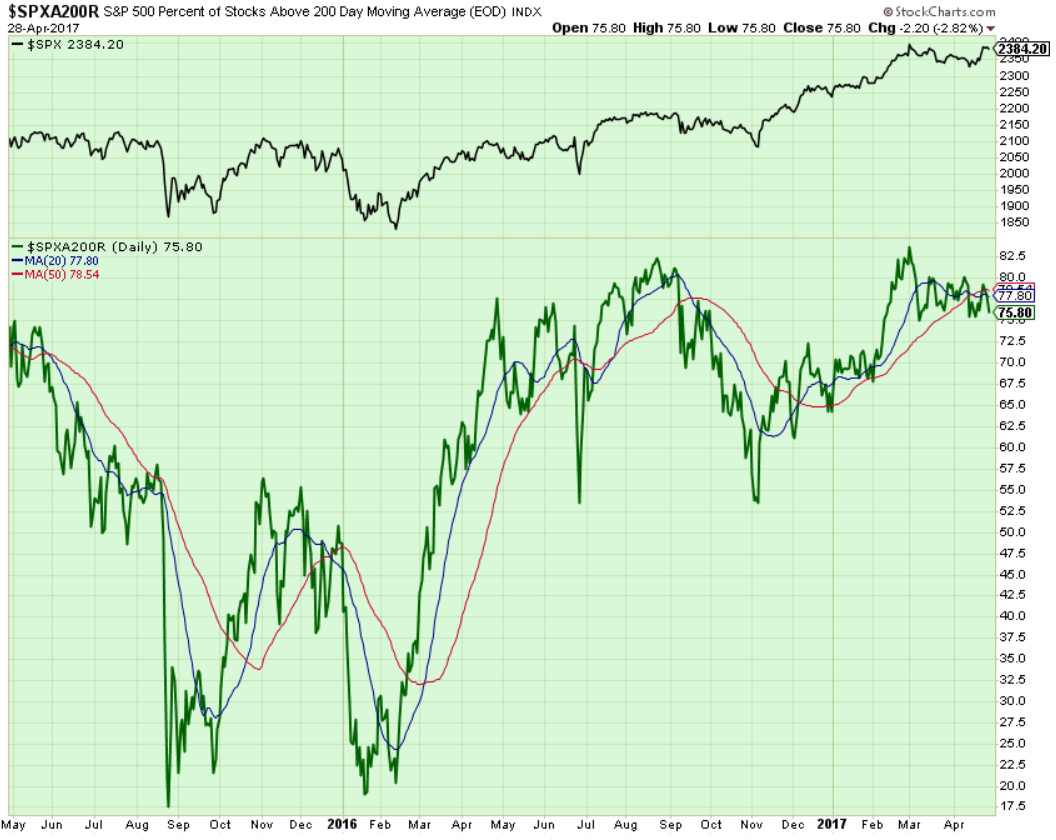
Components of SPX above their respective 200day MA Chart
This scoring indicator diverged, VERY MODESTLY, with SPX this past week and closed near 76%.
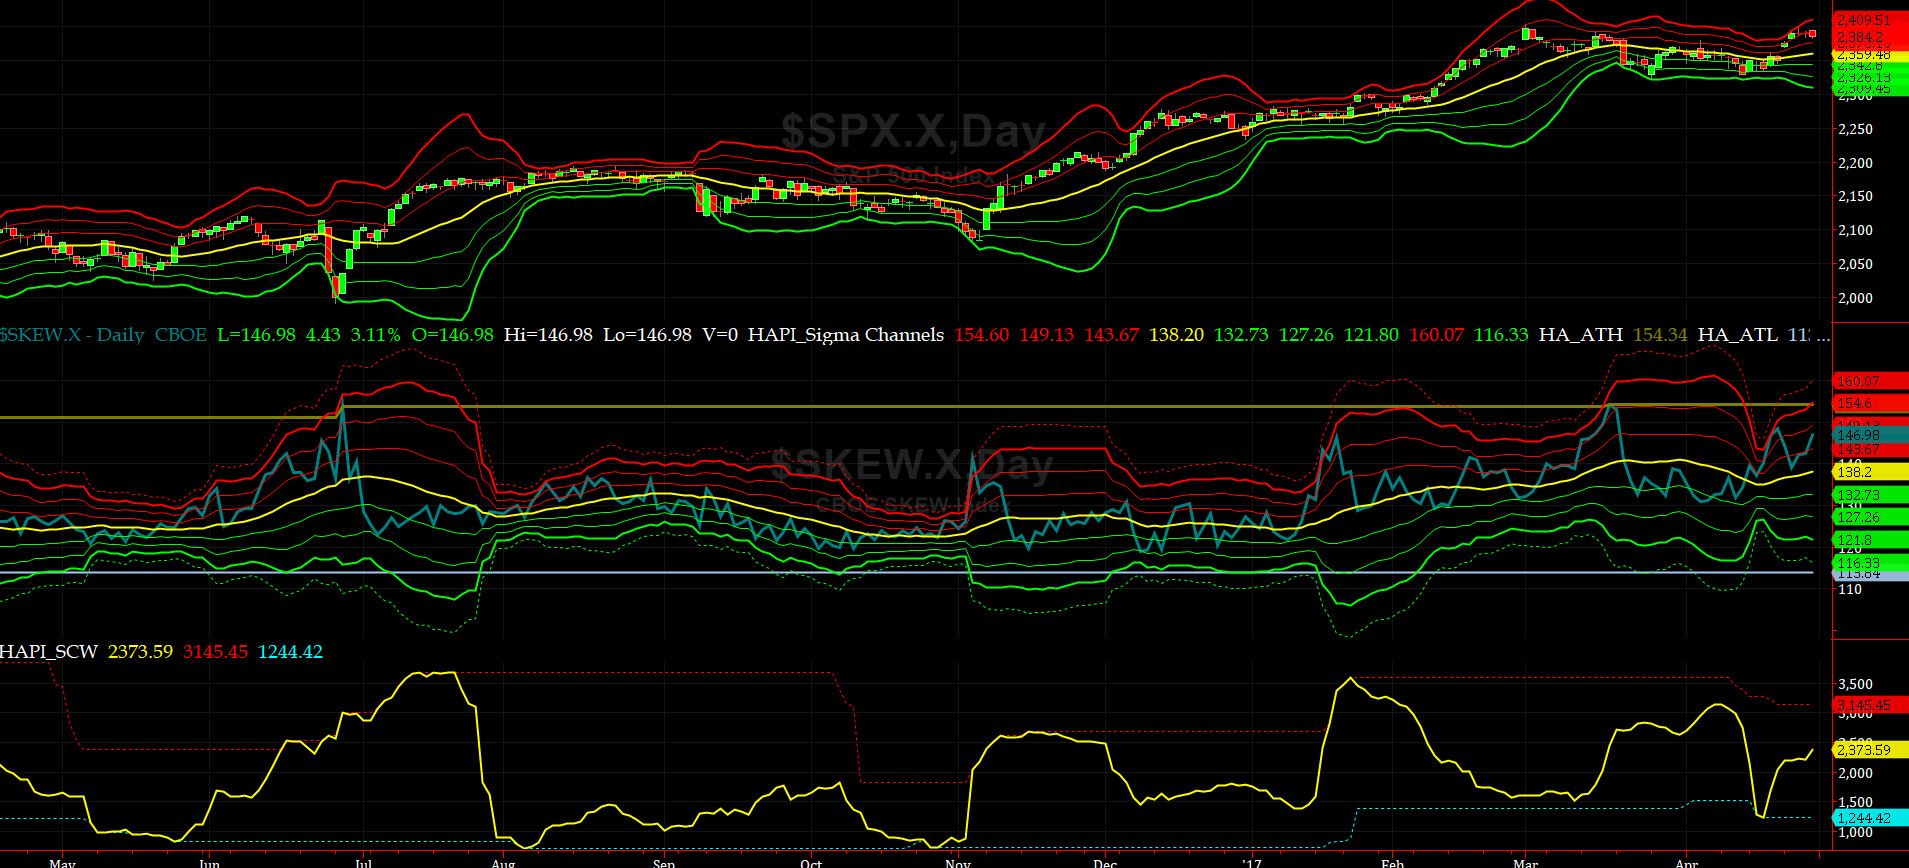
SPX SKEW (Tail Risk) Chart
Last week SPX SKEW (Tail Risk) gave back and then rallied to near its +2 sigma at 147 (normal = 120-125, range 100-150).
Is all quiet on the Eastern & Mid-Western Fronts? We think NOT but not seeing any catalysts for now either. Market texture could change a lot by next Friday. Stay tuned.....

3-month VIX Futures Spread(VX) Chart
Our VX Spread (LONG MAY SHORT AUG) got crushed last Sunday night & early Monday morning and then flat-lined around -2 and finally ended up at -2.2. This is a very NEUTRAL signal, for now.
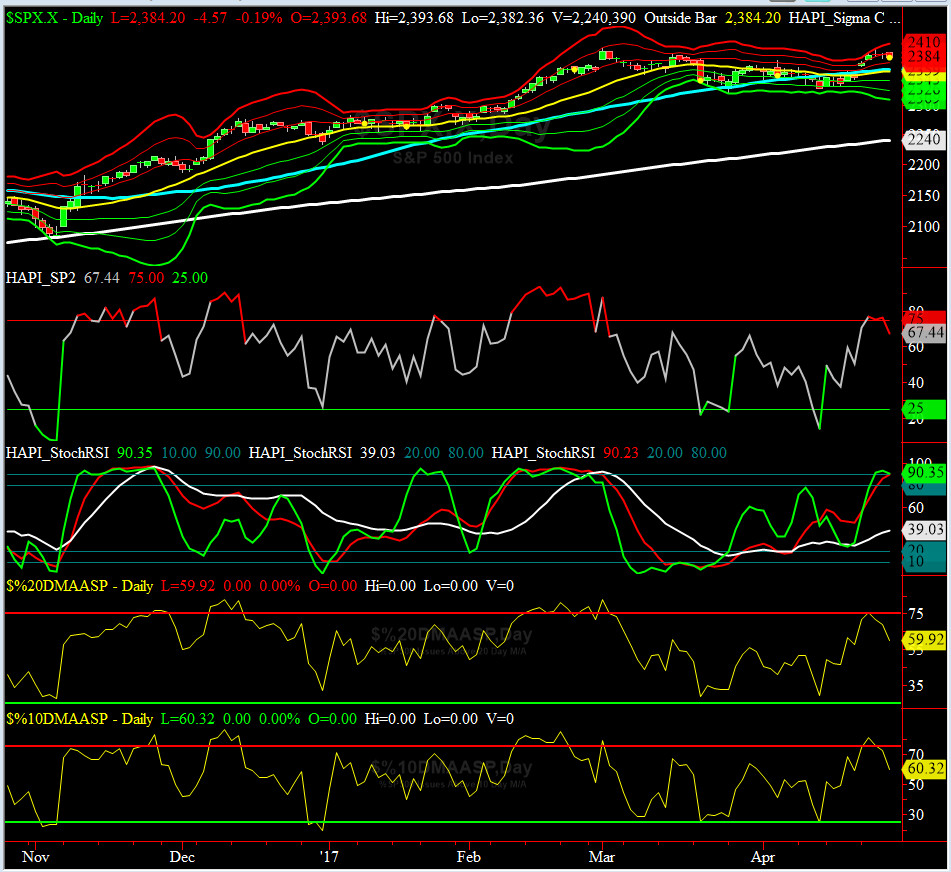
HA_SP2 Chart
HA_SP2 = 50.8 (Buy signal <= 25, Sell Signal >= 75)
We are in the NEUTRAL zone for now.
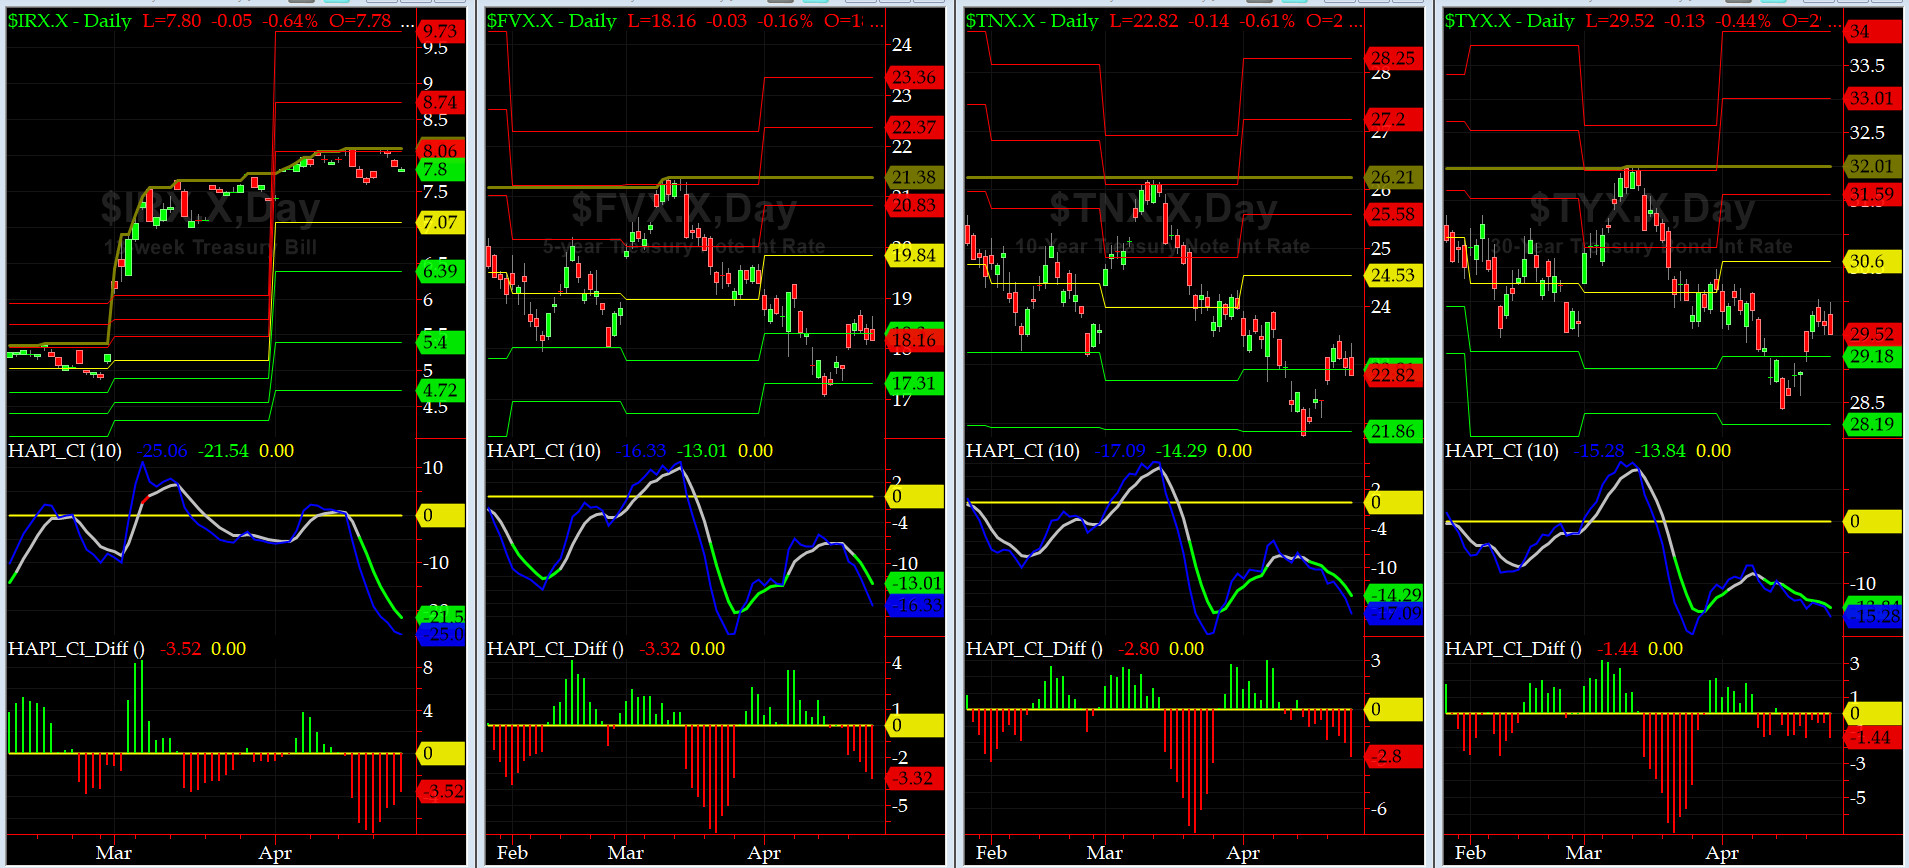
US Treasury T-Notes & T-Bonds Yields Chart
This past week, the US Bond Market sold off and pushed up the YTMs modestly for the long end of Yield Curve. Again no signal here either.
Fari Hamzei
|


 Proactive Market Timing