|
Saturday, May 13, 2017, 2030ET
Market Timing Charts, Analysis & Commentary for Issue #192

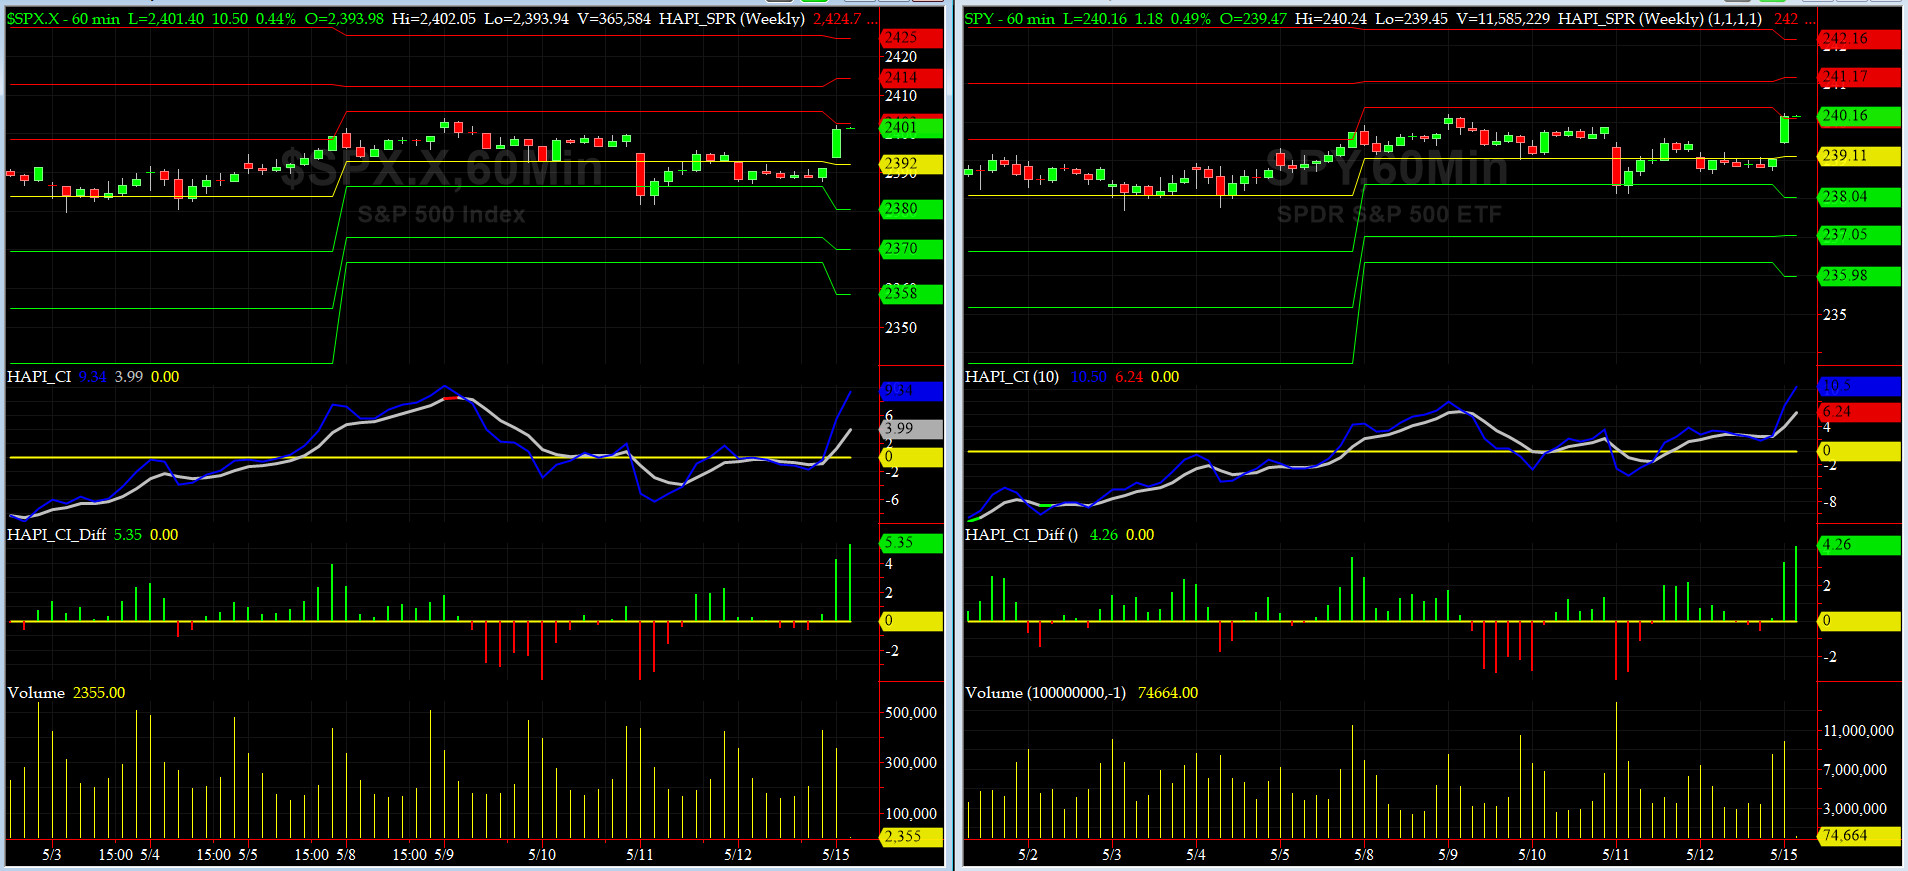
Timer Charts of S&P-500 Cash Index (SPX) + NASDAQ-100 Cash Index (NDX)
Most recent S&P-500 Cash Index (SPX): 2390.90 down -8.39 (down -0.35%) for the week ending Friday, May 12, 2017, which closed just below its +1 sigma.
SPX ALL TIME INTRADAY HIGH = 2403.87 (reached on Tuesday, May 9, 2017)
SPX ALL TIME CLOSING HIGH = 2399.63 (reached on Wednesday, May 10, 2017)
Current DAILY +2 Sigma SPX = 2420 with WEEKLY +2 Sigma = 2428
Current DAILY 0 Sigma (20 day MA) SPX = 2380 with WEEKLY 0 Sigma = 2337
Current DAILY -2 Sigma SPX = 2340 with WEEKLY -2 Sigma = 2245
NYSE McClellan Oscillator = -72 (-150 is start of the O/S area; around -275 to -300 area or lower, we go into the �launch-pad� mode, over +150, we are in O/B area)
NYSE Breadth Thrust = 47.8 (40 is considered as oversold and 65 as overbought)
This week was another week from hell for that SWG ("Smart" Wharton Grad). He & his staff can't even tell the same story for yet another fumble. But our markets are uber vaccinated against any and all political issues/challanges. And if you believe that, my Executive Officer @Capt_Tiko, has a bridge to sell to you in AZ.
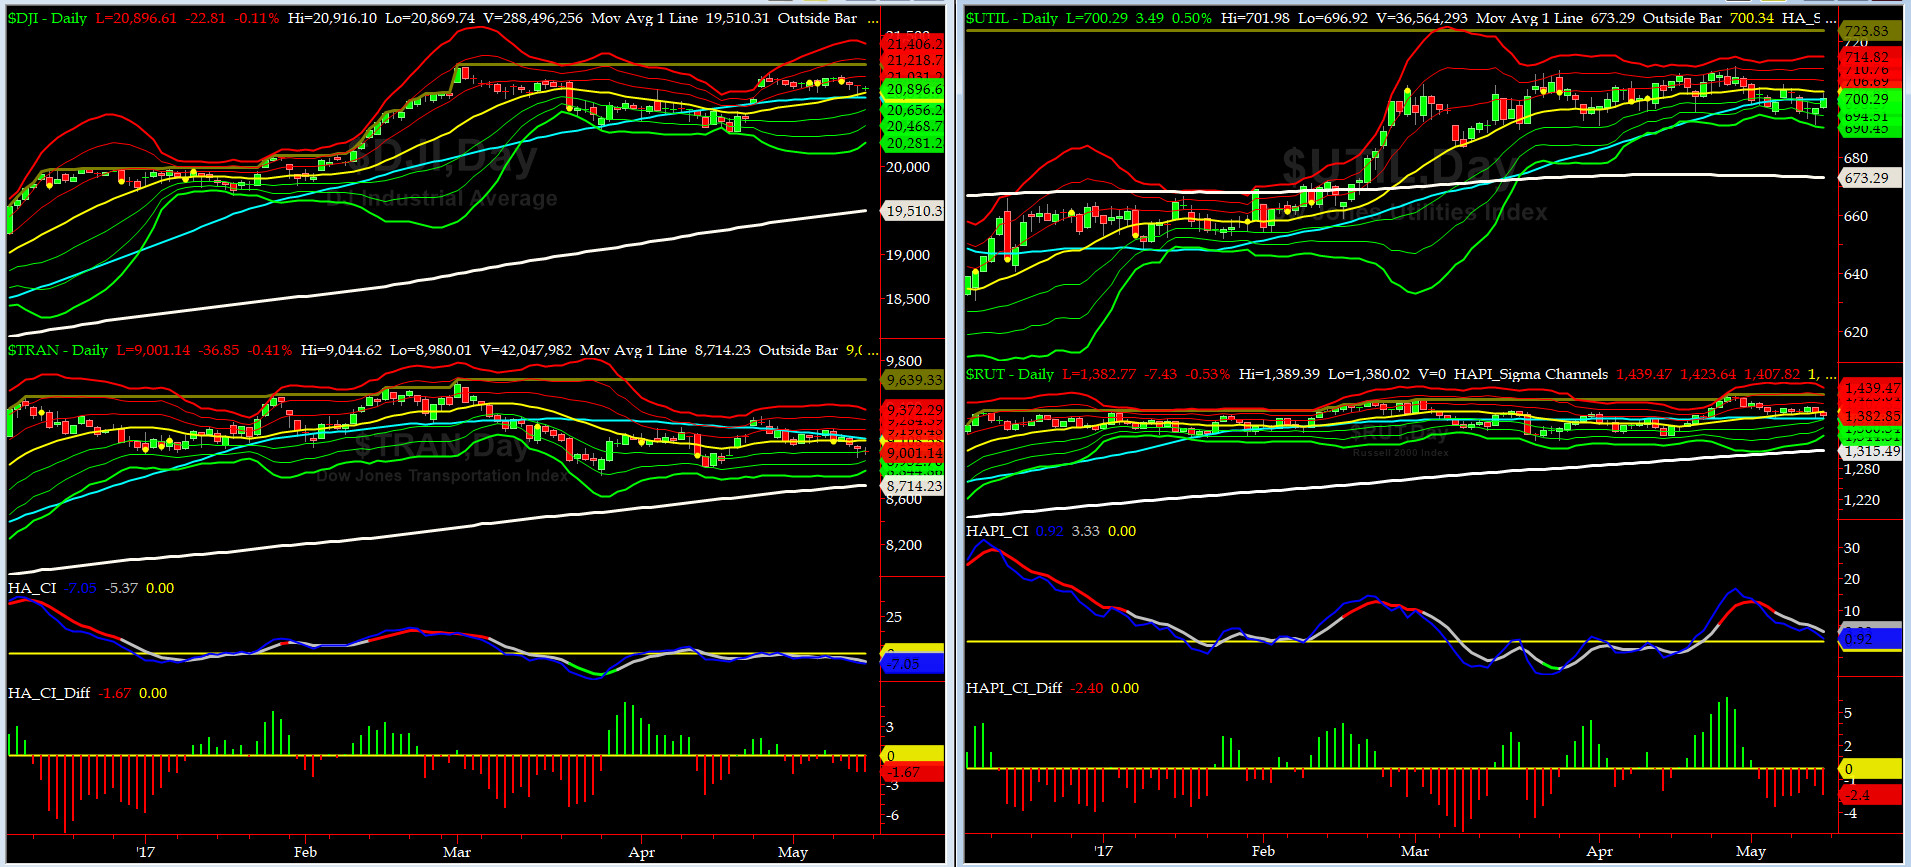
Canaries [in the Coal Mine] Chart for DJ TRAN & RUT Indices
200-Day MA DJ TRAN = 8714 or 3.3% below DJ TRAN (max observed in last 5 yrs = 20.2%, min = -20.3%)
200-Day MA RUT = 1315 or 5.1% below RUT (max observed in last 5 yrs = 21.3%, min = -22.6%)
DJ Transportation Index (proxy for economic conditions 6 to 9 months hence) sold off for most of the week.
Russell 2000 Small Caps Index (proxy for Risk ON/OFF) could not rise much of the last week and then kept retesting its 50-day MA. RISK Capital is still "dazed & confused" .....
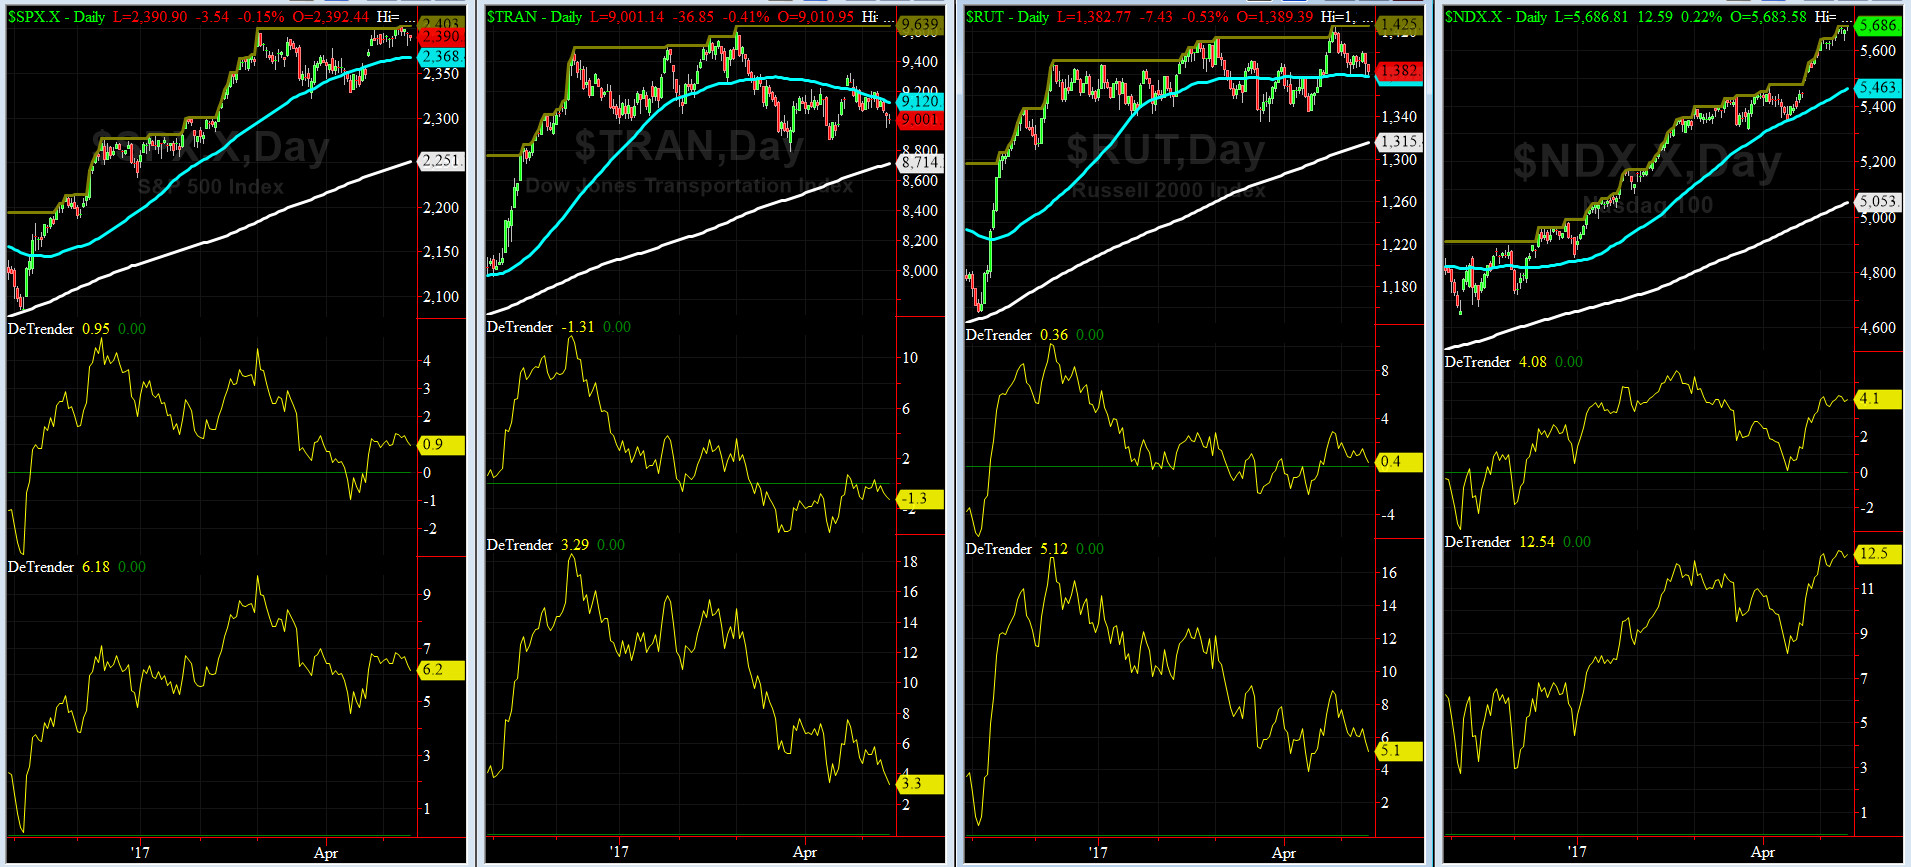
DeTrenders Charts for SPX, NDX, TRAN & RUT Indices
50-Day MA SPX = 2368 or 0.9% below SPX closed on Friday (max observed in last 5 yrs = +8.6%, min = -9.3%)
200-Day MA SPX = 2251 or 6.2% below SPX (max observed in last 5 yrs = 15.2%, min = -14%)
Only ONE of our EIGHT DeTrenders is negative. The DeTrenders for DJ Tran & RUT will continue to be harbingers of future price behavior in broad indices.
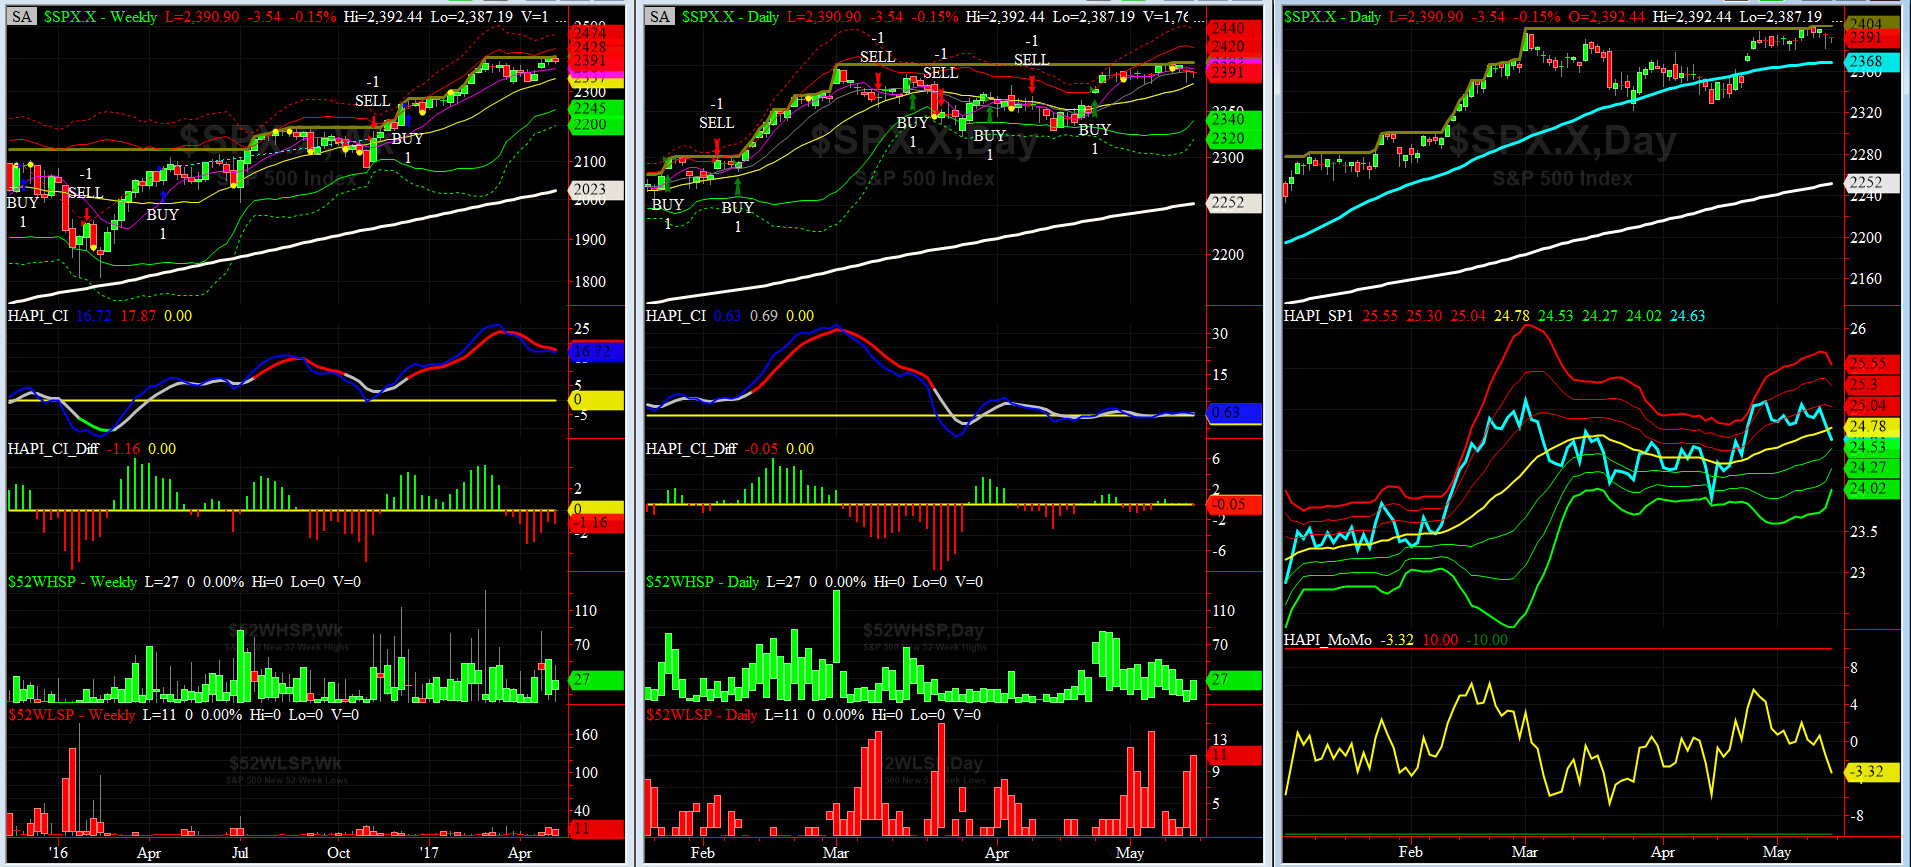
HA_SP1_Momo Chart
WEEKLY Timing Model = on a BUY Signal since Friday 12/16/16 CLOSE at 2258
DAILY Timing Model = on a BUY Signal since Monday 4/24/17 CLOSE at 2374
Max SPX 52wk-highs reading last week = 45 (over 120-140, the local maxima is in)
Max SPX 52wk-Lows reading last week = 11 (over 40-60, the local minima is in)
HA_SP1 at just above its -1 sigma channels
HA_Momo = -3.3 (reversals most likely occur above +10 or below -10)
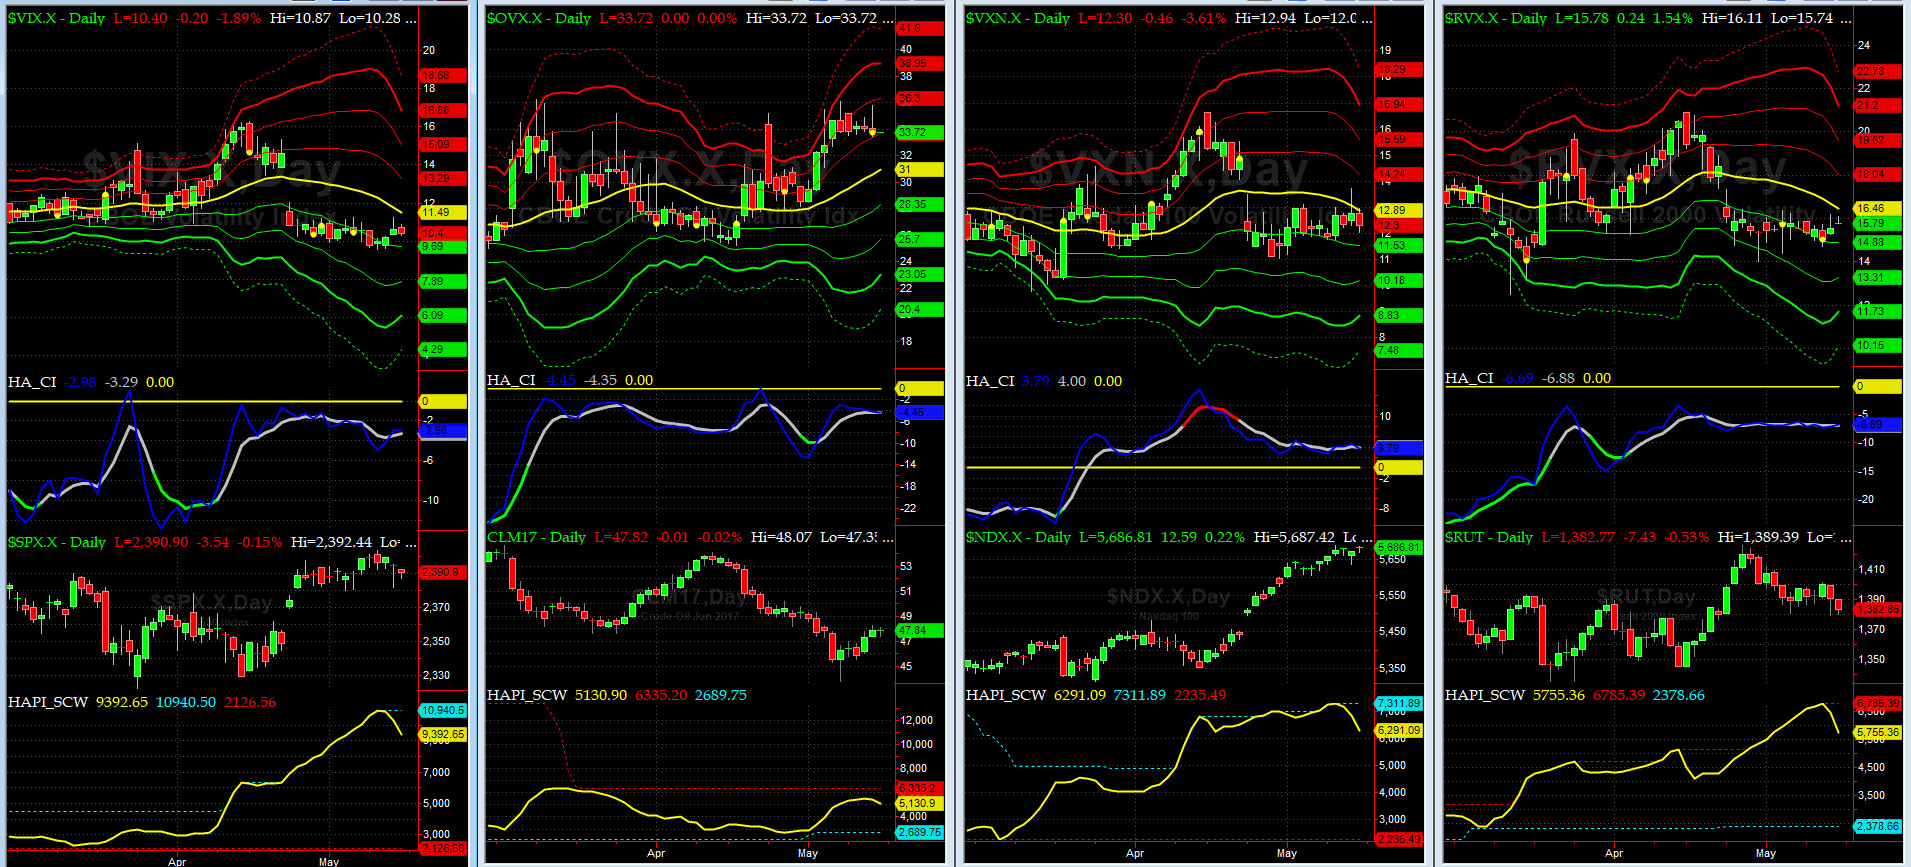
Vol of the Vols Chart
VIX is currently stands at 10.4, or just about its -0.5 sigma (remember it�s the VIX�s volatility pattern (its sigma channels) that matters, and not the level of VIX itself (this is per Dr. Robert Whaley, a great mentor and the inventor of original VIX, now called VXO). VIX usually peaks around a test of its +4 sigma).
Lat Wednesday SPOT VIX traded just above 9.5. We hope vols will return as short-term trading is getting tougher and tougher.
Crude Oil Vol rose in the prior week and then eased off this week. Those of you who follow our fearless crude oil trader, @Capt_Tiko, saw him nail the bottom the prior week and killed on ramp up this past week. He is now back to relaxing by the lake.
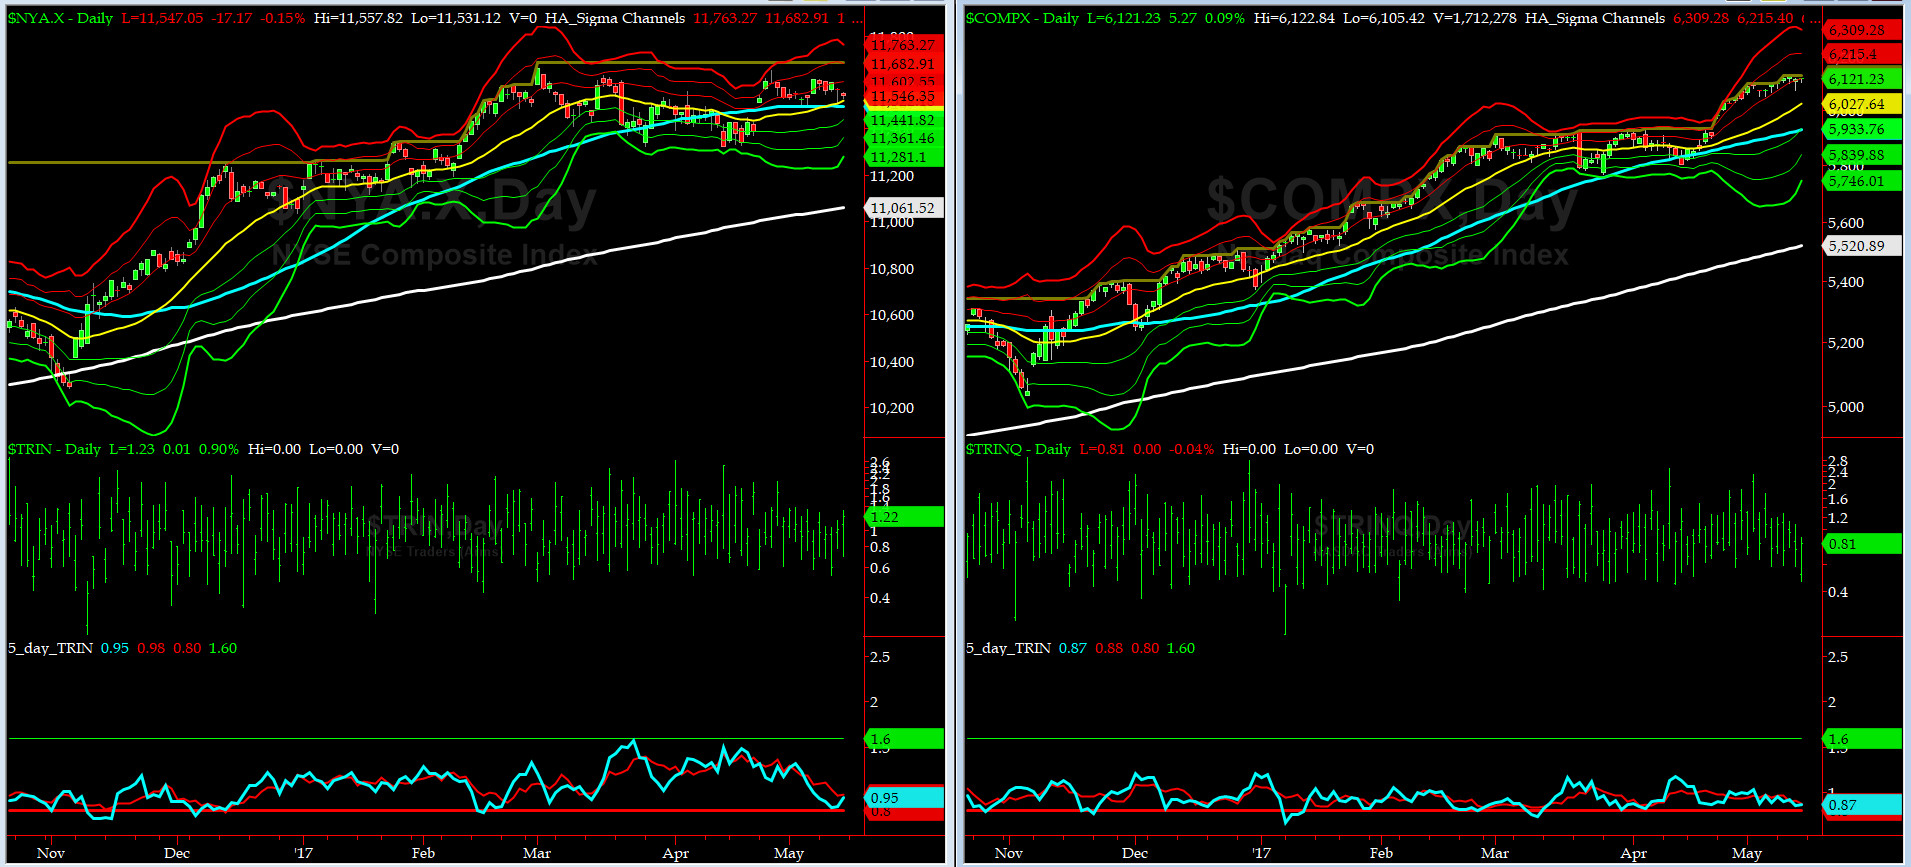
5-day TRIN & TRINQ Charts
Both of our 5-day TRINs touched the SELL zone on Wednesday. Stay tuned.....
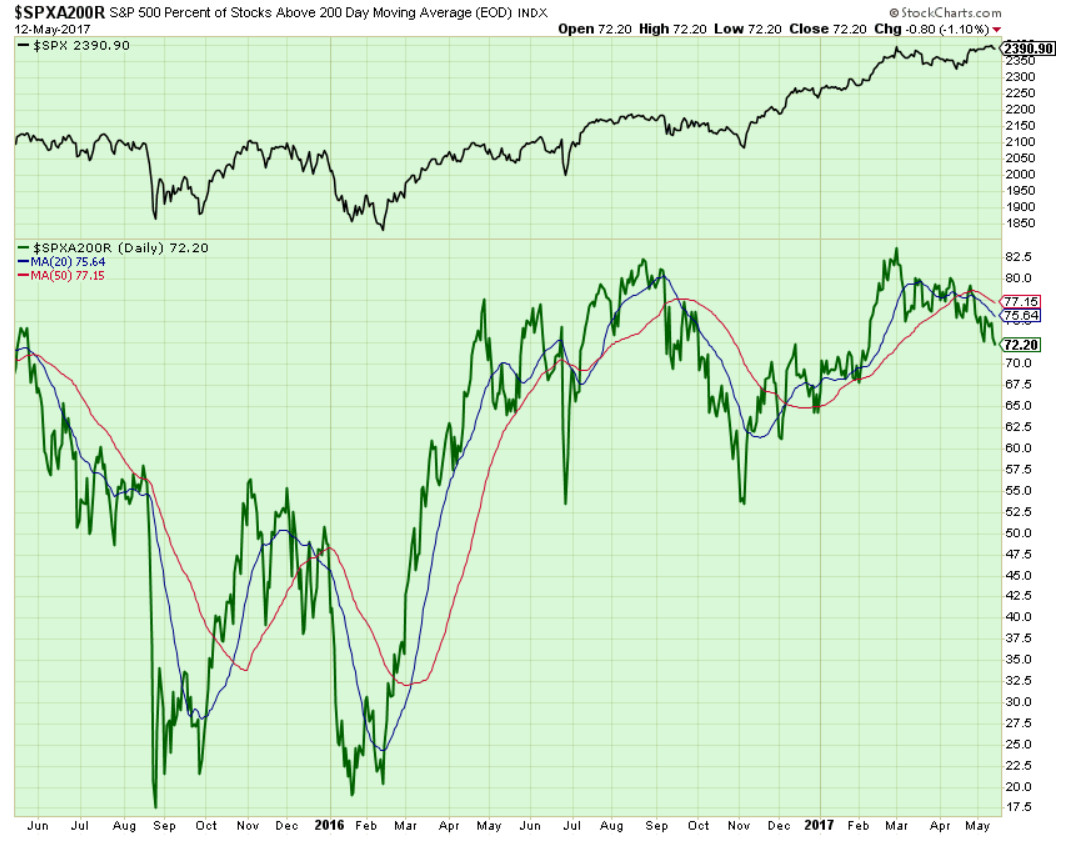
Components of SPX above their respective 200day MA Chart
This scoring indicator is now beginning to show some cracks. Next target to watch is 67.5%.
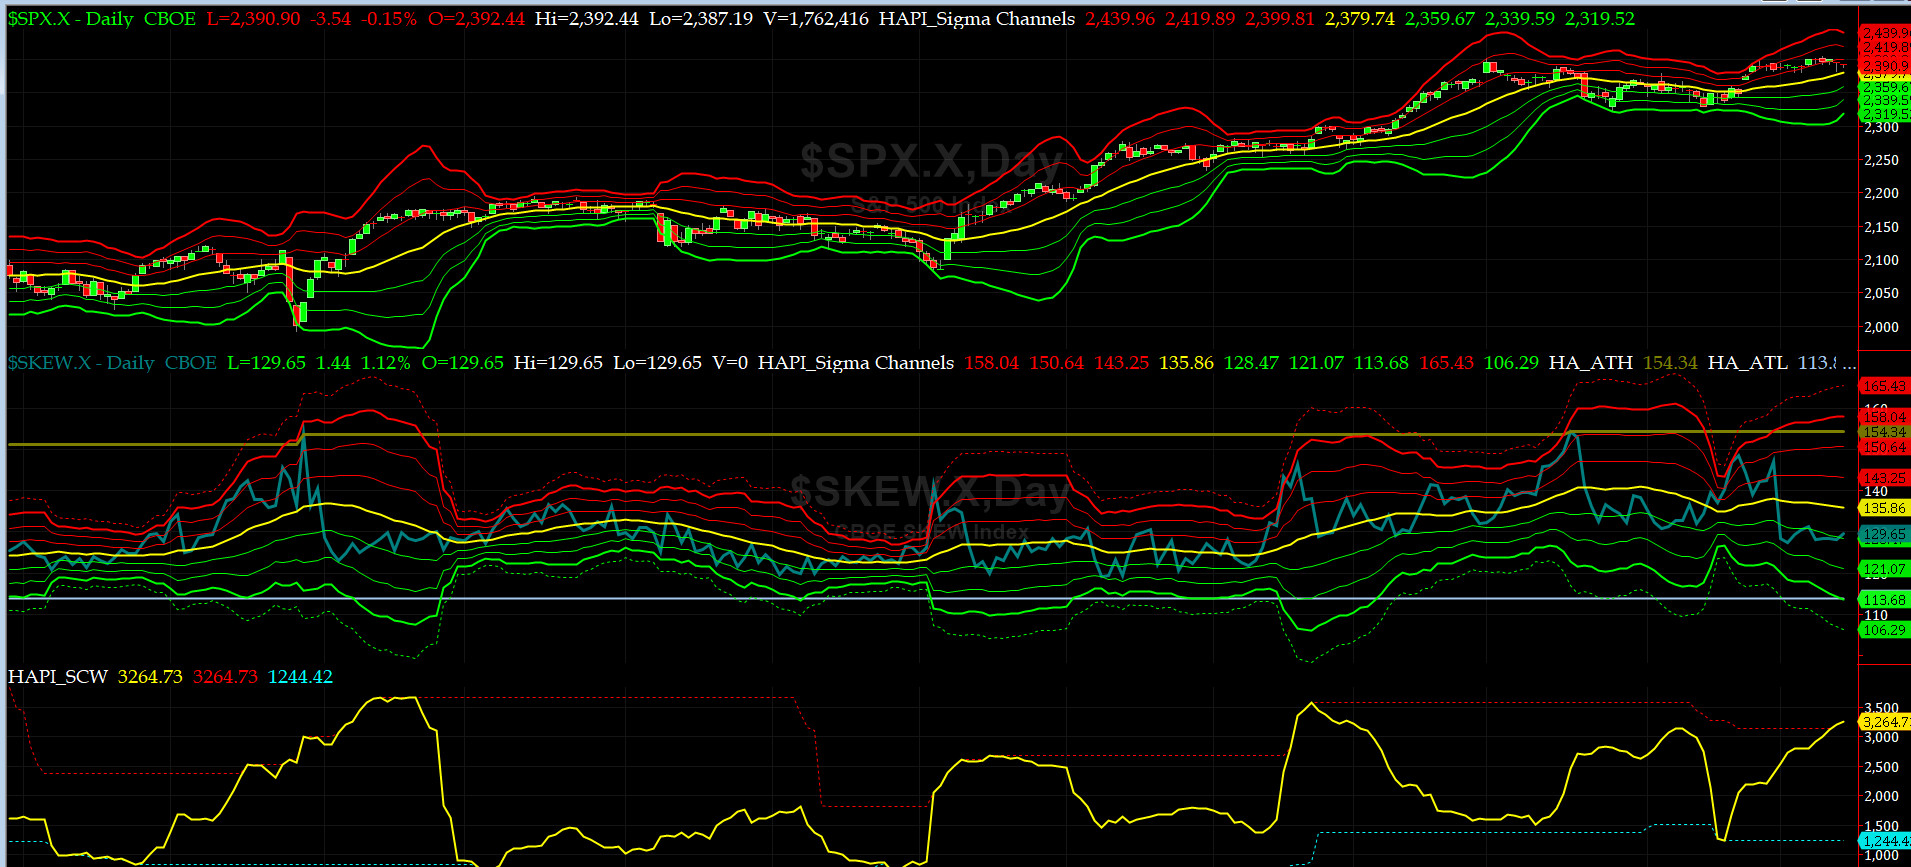
SPX SKEW (Tail Risk) Chart
Last week SPX SKEW (Tail Risk) stabilized at and closed near 129.6 (normal = 120-125, range 100-150).
Is all quiet on the Eastern & Mid-Western Fronts? For now, YES.
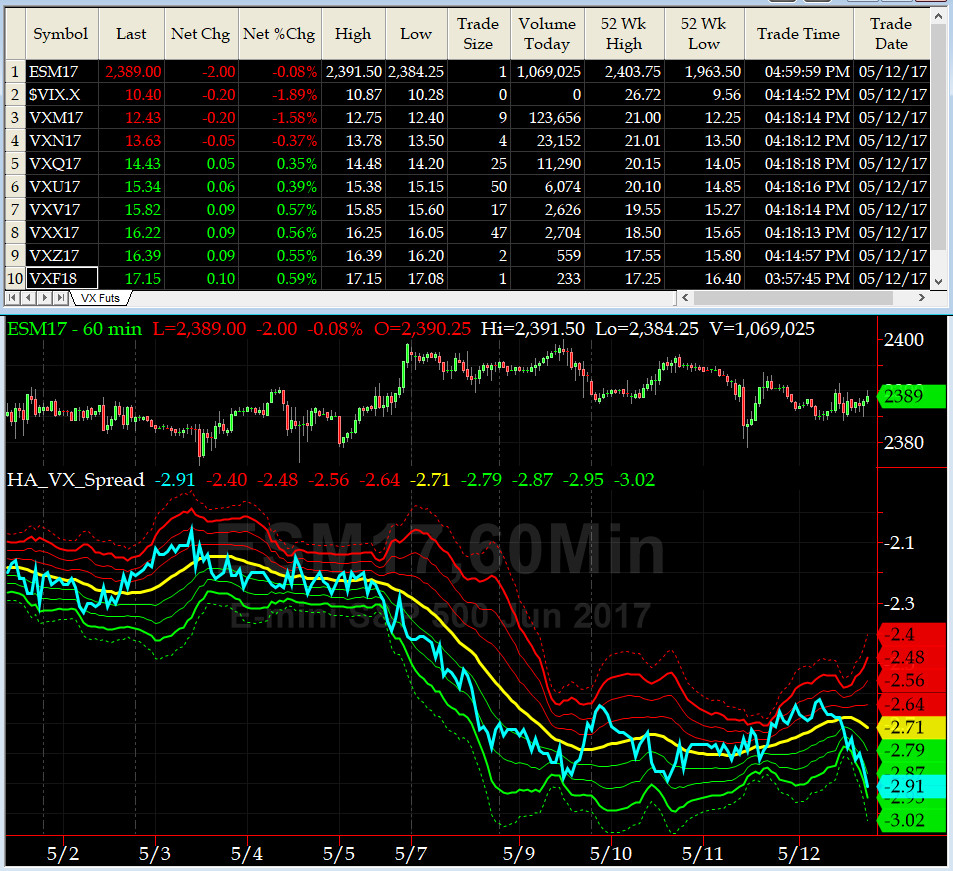
3-month VIX Futures Spread(VX) Chart
Our VX Spread, per our protocol, rolled to LONG JUNE SHORT SEPT, was flat-lined around -2.7 till Friday when it went thru a tail spin and ended at -2.91. We are getting closer to a SELL signal here also.
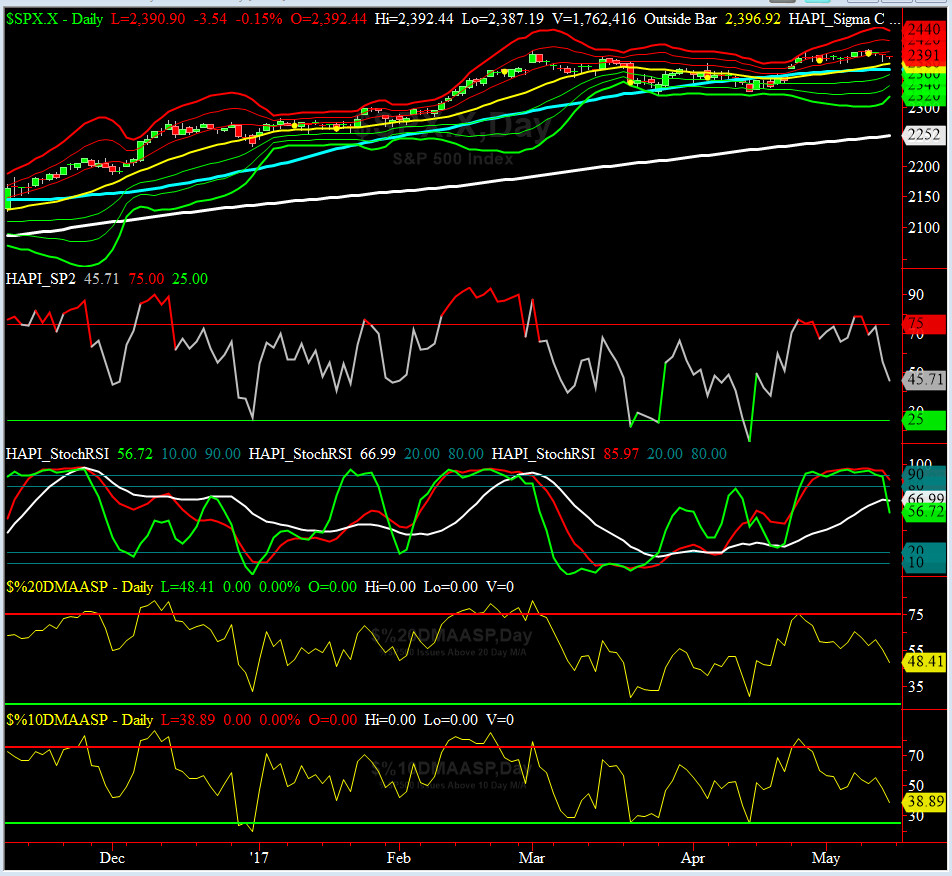
HA_SP2 Chart
HA_SP2 = 45.7 (Buy signal <= 25, Sell Signal >= 75)
We are finally left the overbought zone and heading south. We are looking for sub-25 reading.
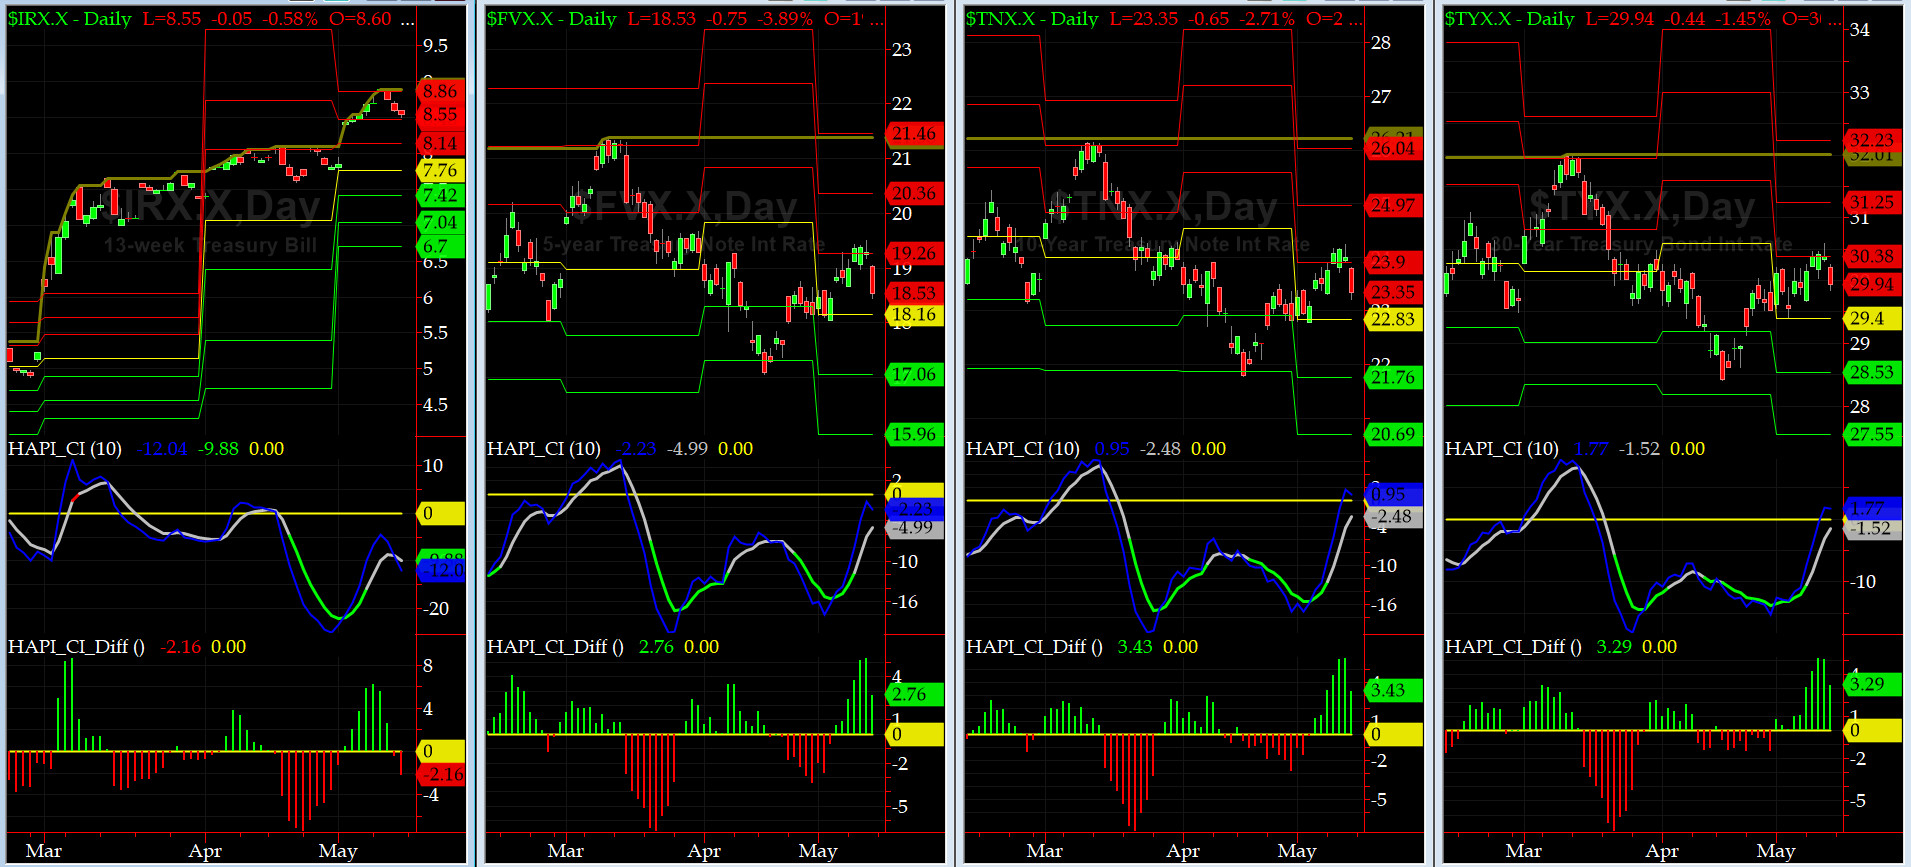
US Treasury T-Notes & T-Bonds Yields Chart
This past week, at the margin, the US Bond Market sold again and pushed up the YTMs a tad and then retreated on Friday.
Fari Hamzei
|


 Proactive Market Timing