|
Saturday, May 20, 2017, 0830ET
Market Timing Charts, Analysis & Commentary for Issue #193
Timer Charts of S&P-500 Cash Index (SPX) + NASDAQ-100 Cash Index (NDX)
Most recent S&P-500 Cash Index (SPX): 2381.73 down -9.17 (down -0.39%) for the week ending Friday, May 19, 2017, which closed just below its zero sigma.
SPX ALL TIME INTRADAY HIGH = 2405.77 (reached on Tuesday, May 16, 2017)
SPX ALL TIME CLOSING HIGH = 2402.32 (reached on Monday, May 15, 2017)
Current DAILY +2 Sigma SPX = 2411 with WEEKLY +2 Sigma = 2425
Current DAILY 0 Sigma (20 day MA) SPX = 2388 with WEEKLY 0 Sigma = 2344
Current DAILY -2 Sigma SPX = 2366 with WEEKLY -2 Sigma = 2263
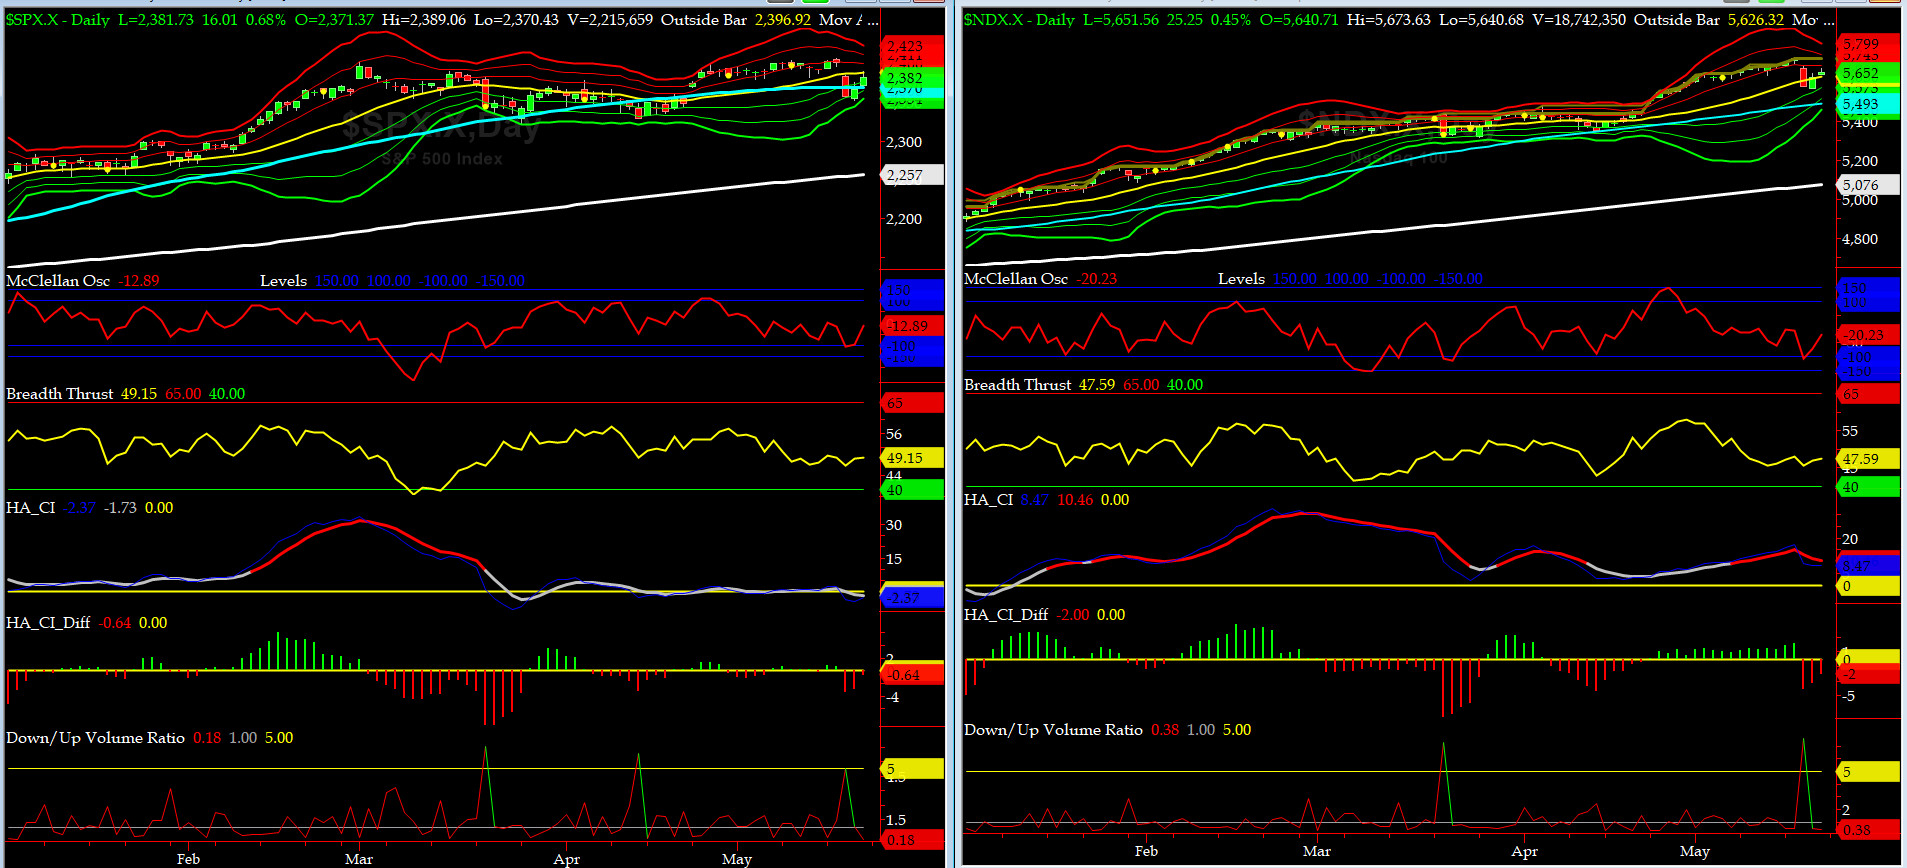
NYSE McClellan Oscillator = -13 (-150 is start of the O/S area; around -275 to -300 area or lower, we go into the �launch-pad� mode, over +150, we are in O/B area)
NYSE Breadth Thrust = 49.1 (40 is considered as oversold and 65 as overbought)
The market suffered its worst week of 2017 so far. It was a week from hell for that SWG (" Smart" Wharton Grad, if there is such a thing). As SPX works through its Bearish Pattern (yes, May OX was somewhat disruptive), we anticipate there will be myriad of bad news in the next couple of months for SWG, aka Grumpie, from beyond reproach Princetonian (Robert Meuller, former Director of FBI and now Special Counsel for DOJ). These events may include looking in depth into DJT's financials & tax returns. As we say in the Navy, fasten your harness sailor, as SPX just formed its first weekly outside bar reversal for 2017.
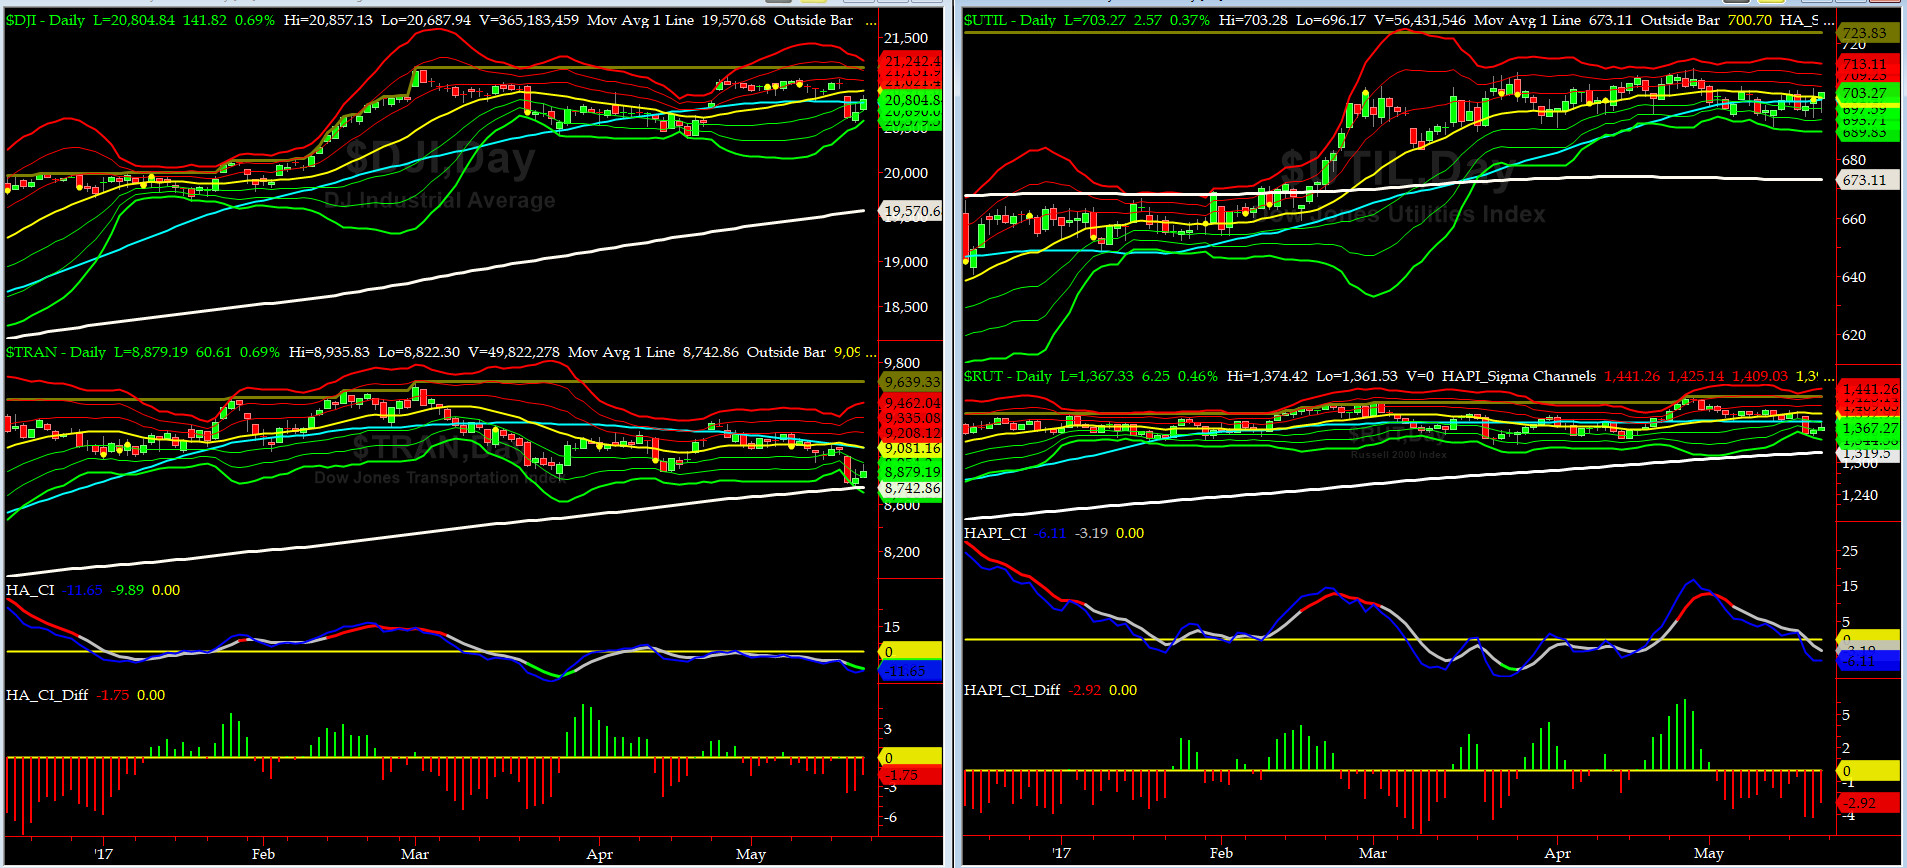
Canaries [in the Coal Mine] Chart for DJ TRAN & RUT Indices
200-Day MA DJ TRAN = 8742 or 1.6% below DJ TRAN (max observed in last 5 yrs = 20.2%, min = -20.3%)
200-Day MA RUT = 1319 or 3.6% below RUT (max observed in last 5 yrs = 21.3%, min = -22.6%)
DT Transportation Index (proxy for economic conditions 6 to 9 months hence) sold off aggressively last Wednesday and tested its 200-day MA on Thursday.
Divergences in Russell 2000 Small Caps Index (proxy for Risk ON/OFF) compared to DT played catch up as the index experienced a high fever on Wednesday. RISK capital could go into RISK OFF mode below its 200 day MA ( currently at 1319)
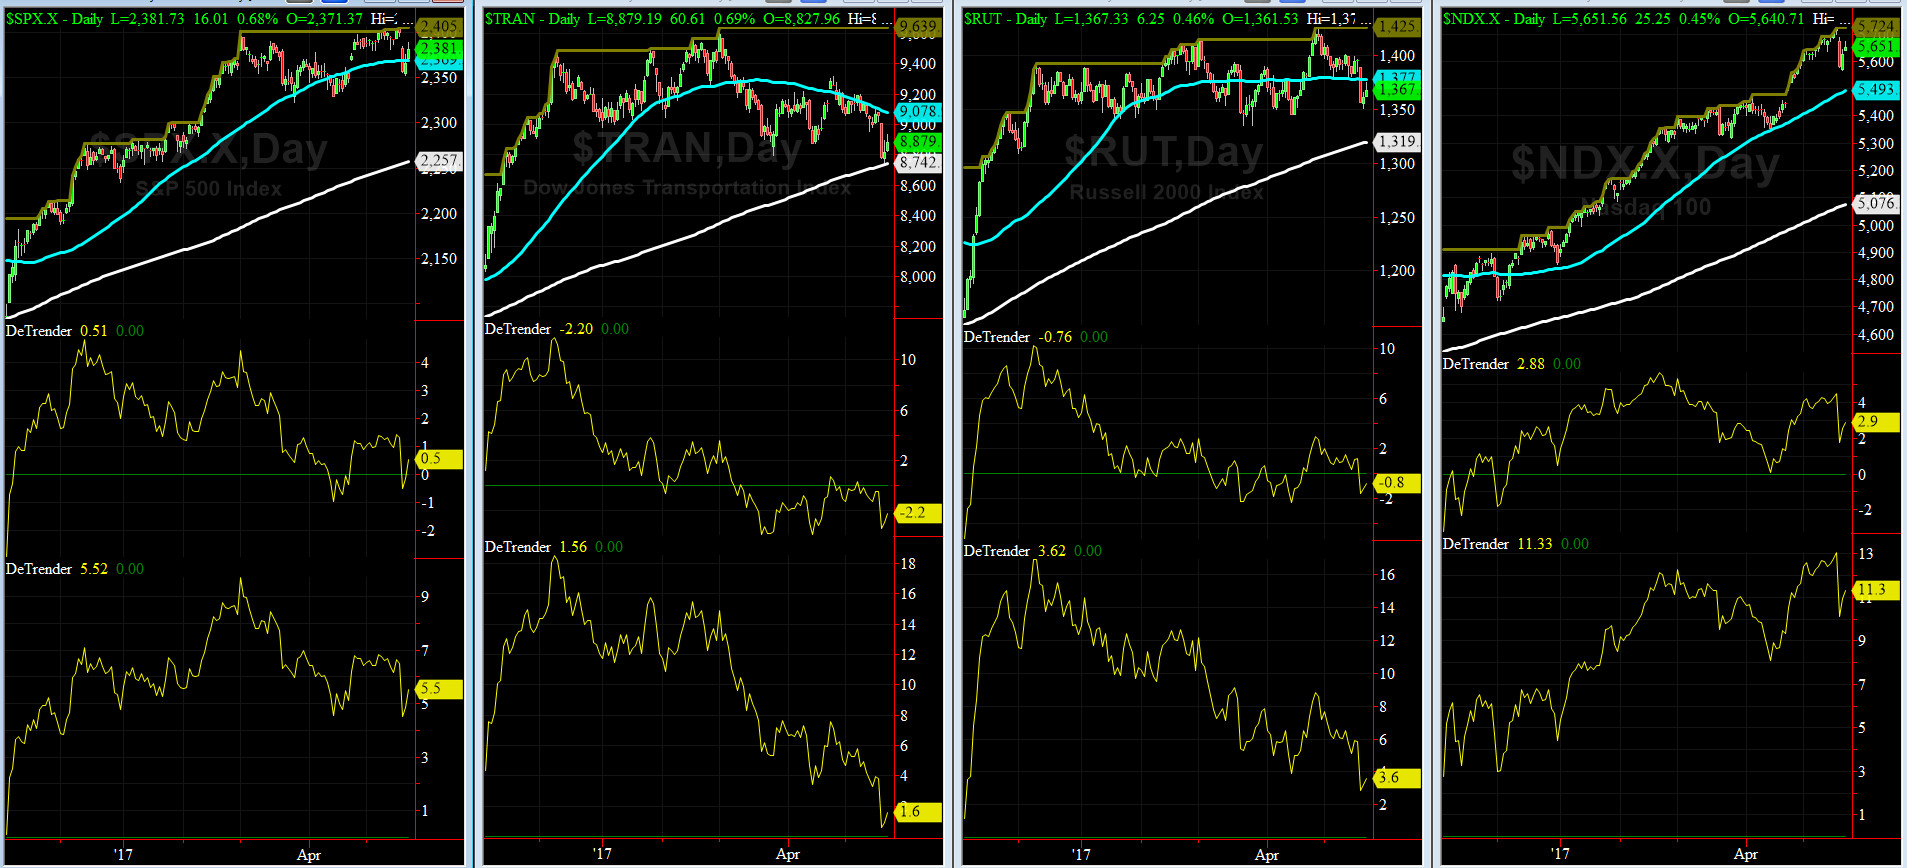
DeTrenders Charts for SPX, NDX, TRAN & RUT Indices
50-Day MA SPX = 2368 or 0.5% below SPX closed on Friday (max observed in last 5 yrs = +8.6%, min = -9.3%)
200-Day MA SPX = 2251 or 5.5% below SPX (max observed in last 5 yrs = 15.2%, min = -14%)
Two of our EIGHT DeTrenders are negative. The DeTrenders for DJ Tran & RUT will continue to be harbingers of future price behavior in broad indices.
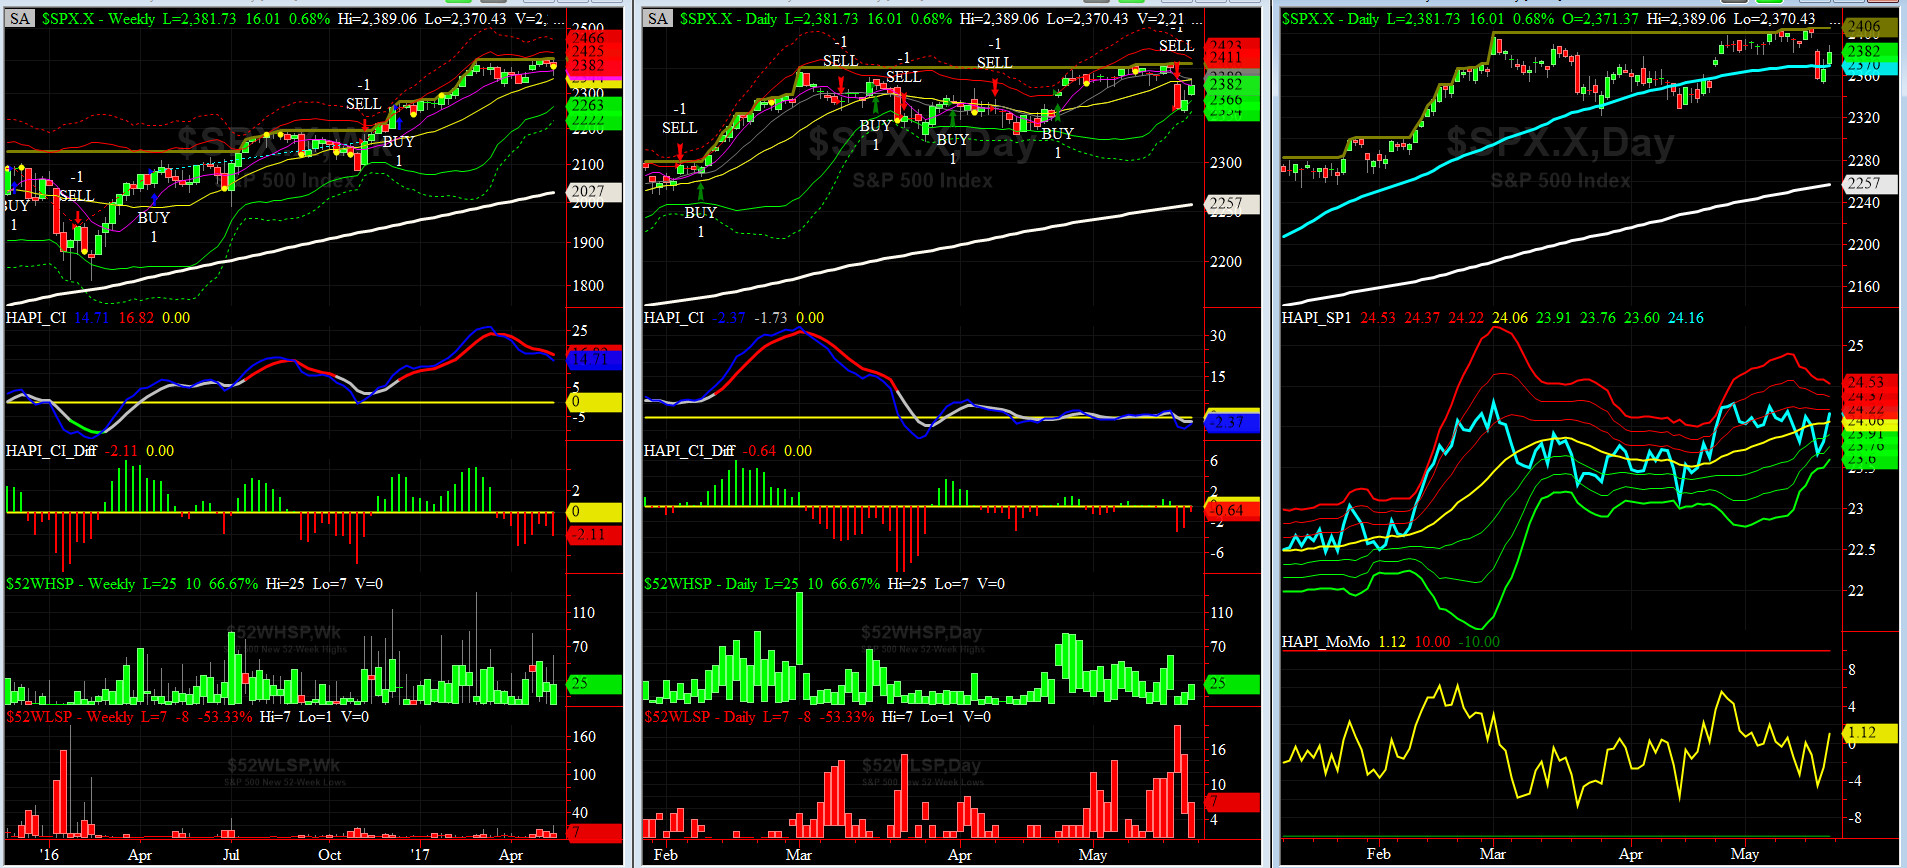
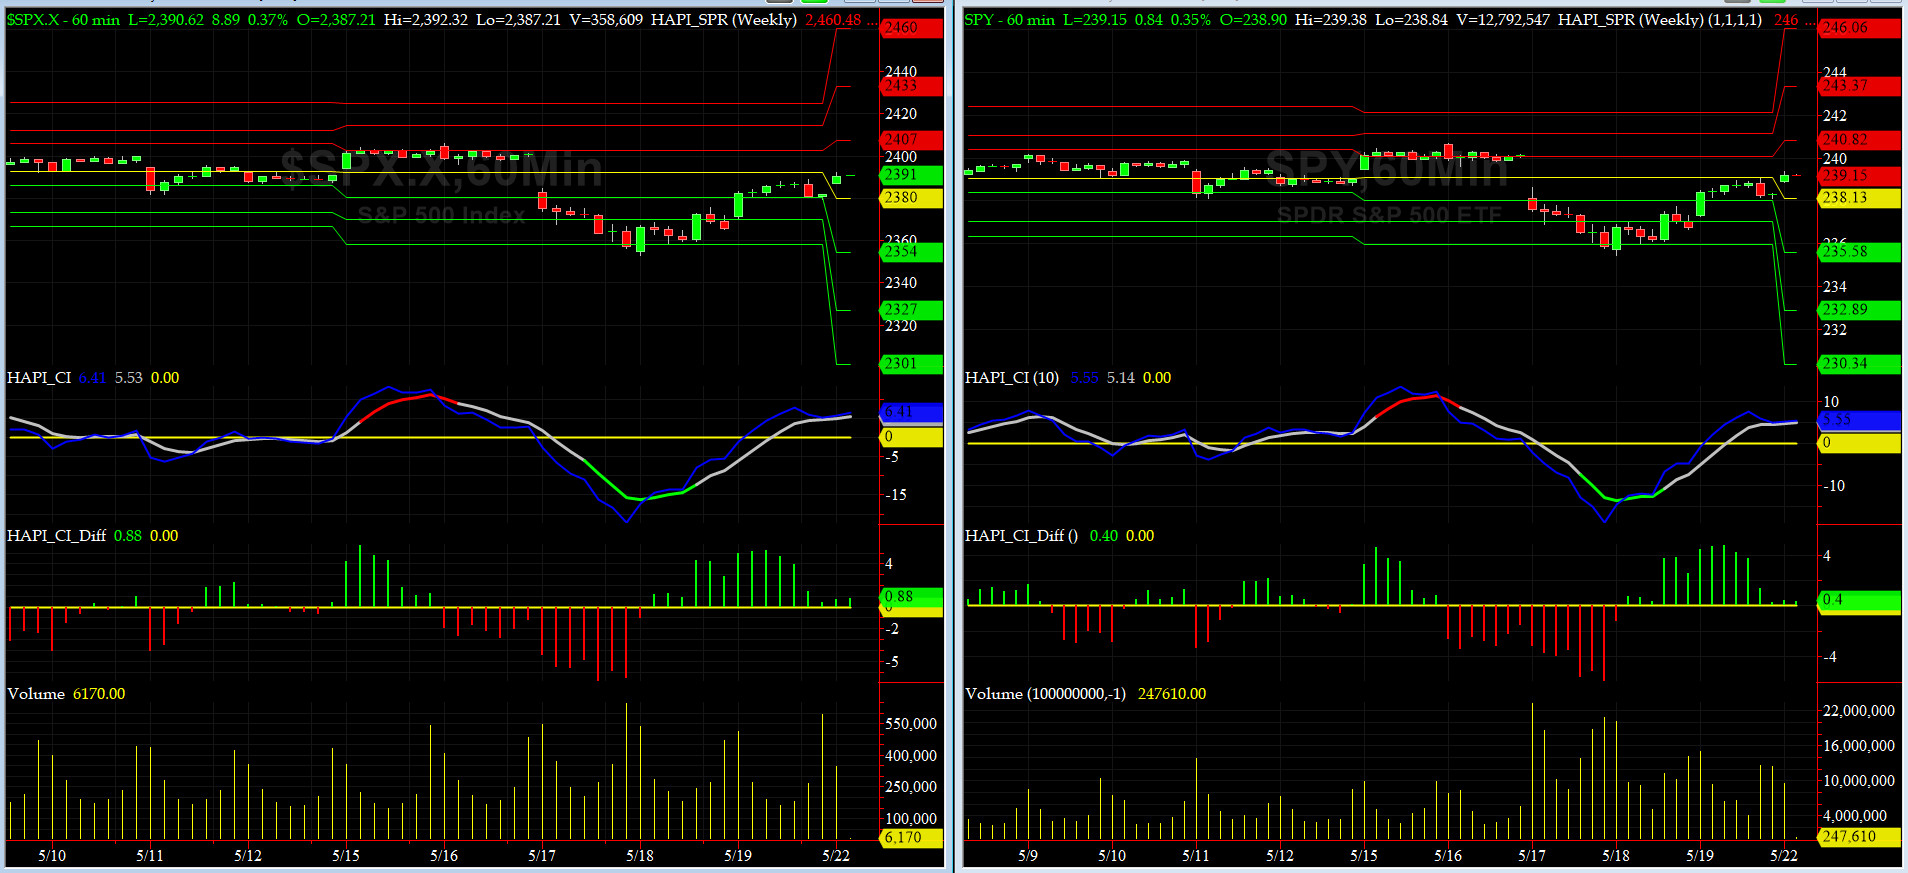
HA_SP1_Momo Chart
WEEKLY Timing Model = on a BUY Signal since Friday 12/16/16 CLOSE at 2258
DAILY Timing Model = on a SELL Signal since Wednesday 5/17/17 CLOSE at 2357
Max SPX 52wk-highs reading last week = 59 (over 120-140, the local maxima is in)
Max SPX 52wk-Lows reading last week = 20 (over 40-60, the local minima is in)
HA_SP1 at just below its +1 sigma channels
HA_Momo = +1.1 (reversals most likely occur above +10 or below -10)

Vol of the Vols Chart
VIX currently stands at 12.4, or just about its +0.5 sigma (remember it's the VIX volatility pattern (its sigma channels) that matters, and not the level of VIX itself (this is per Dr. Robert Whaley, a great mentor and inventor of original VIX, now called VXO). VIX usually peaks around a test of its +4 sigma).
Lat Thursday SPOT VIX traded just above 16 at its +3 sigma but by late Friday, it was back in 12 vols.
Again this week, Crude Oil Vol spiked to almost +3 sigma (at 38) and then eased off by Friday to -1 sigma & closed at 29. This week, my XO, @Capt_Tiko, spent the week at Camp Bow Wow in Naples & away from screens.
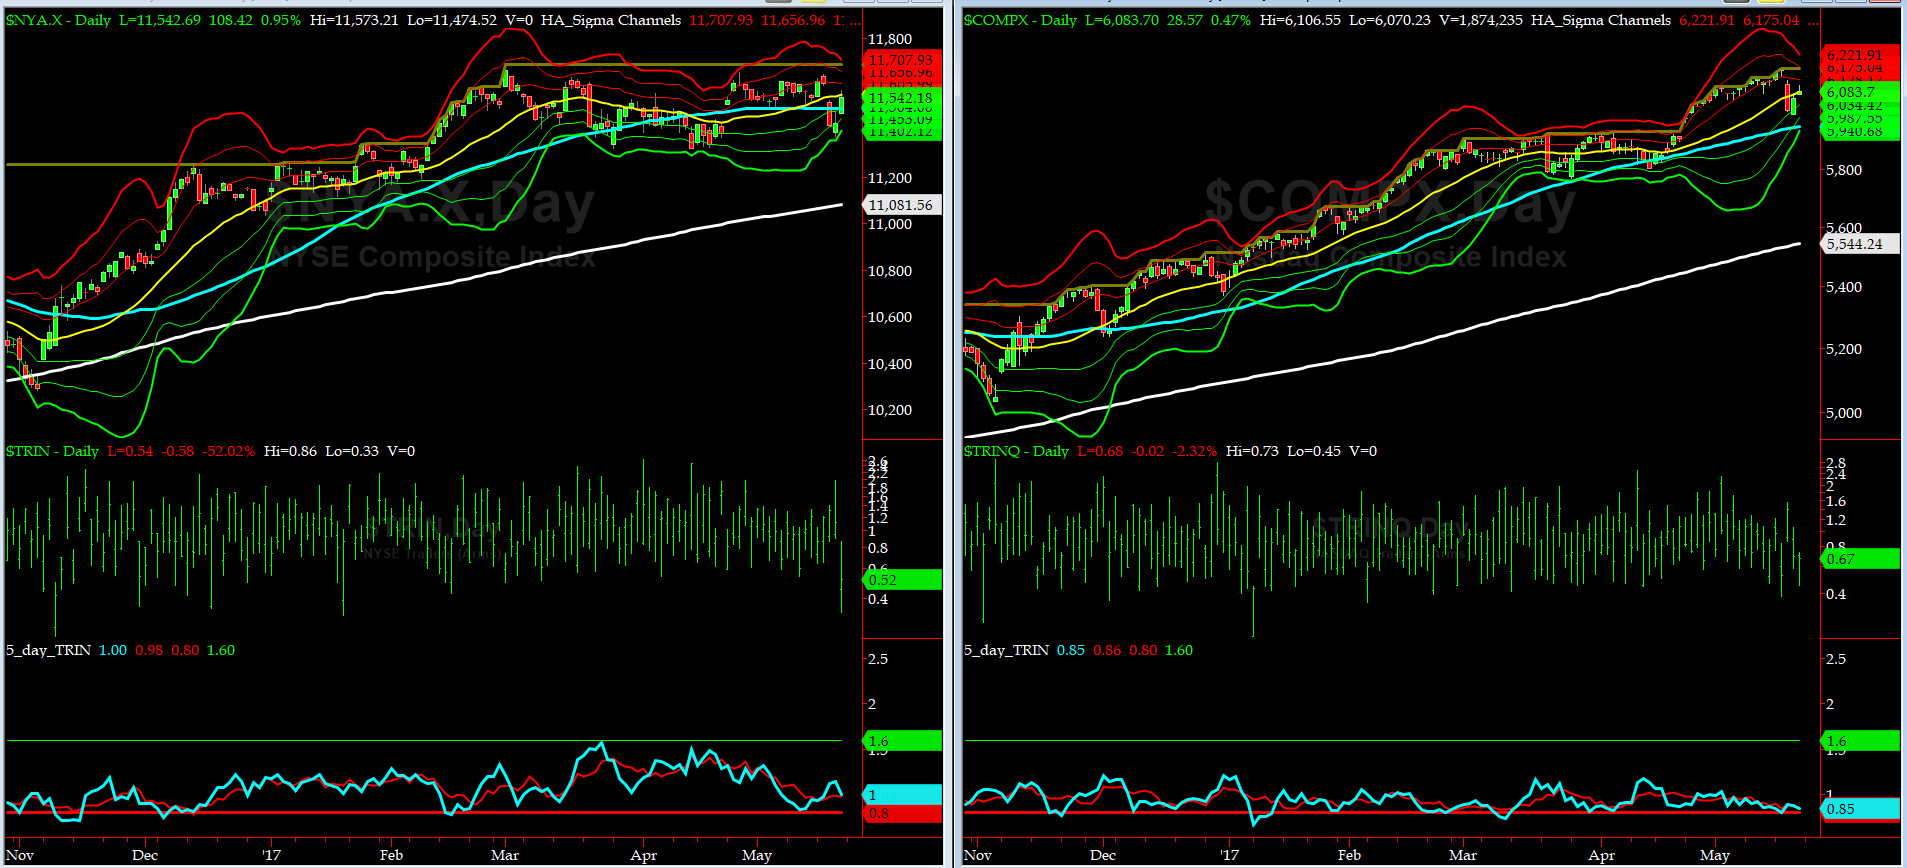
5-day TRIN & TRINQ Charts
GREAT SIGNALS last week, by both of our 5-day TRINs. Secondary Sell signals (as in second mouse going for the cheez) should be next.
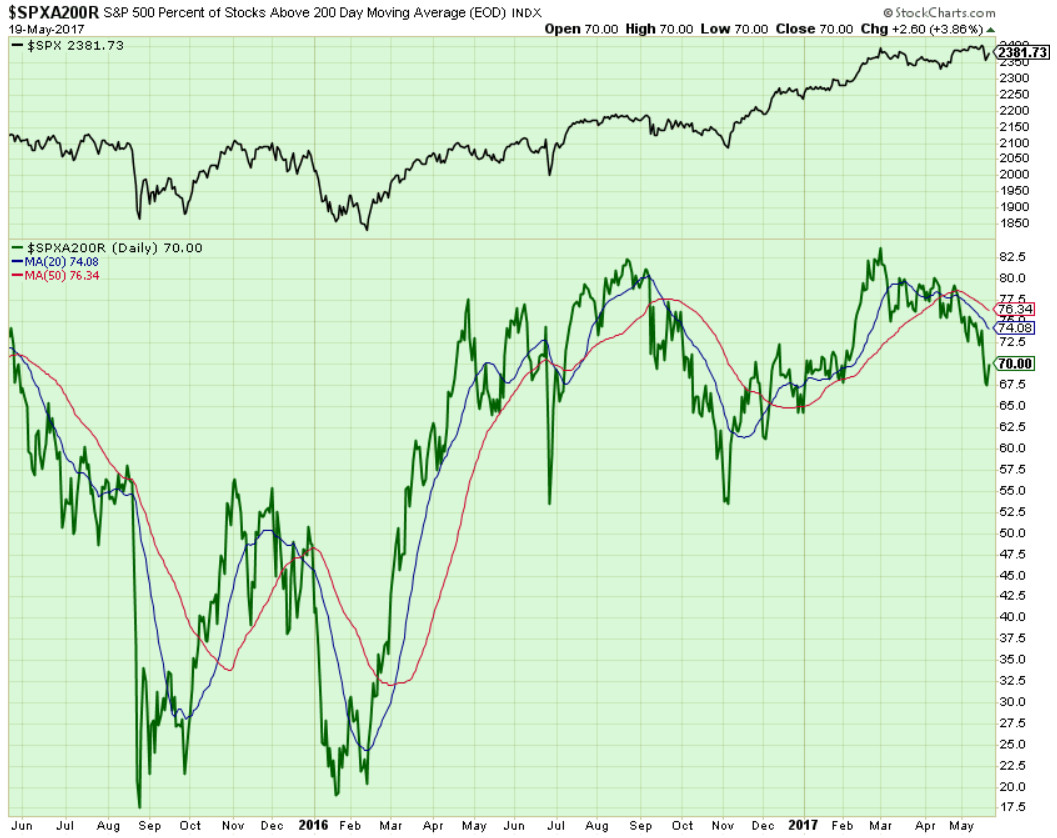
Components of SPX above their respective 200day MA Chart
This scoring indicator hit our traget on Wednesday posted here last week ("Next target to watch is 67.5%") !!!
We should be looking for a test of 50% +/- 5% soon.
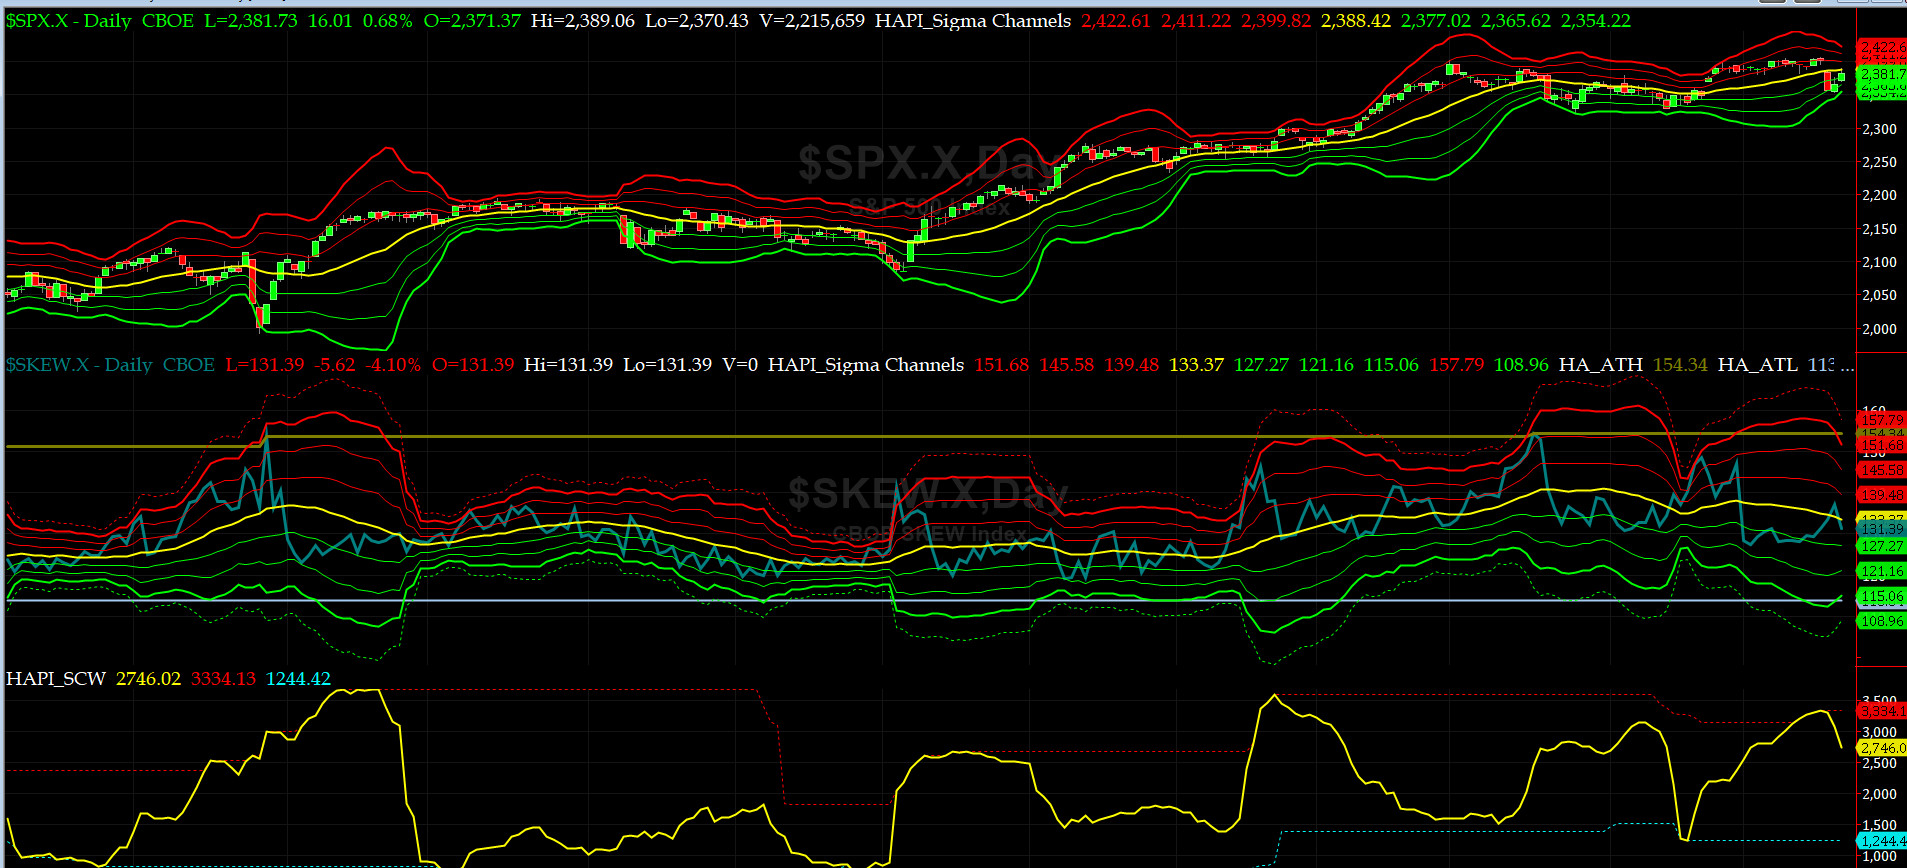
SPX SKEW (Tail Risk) Chart
Last week SPX SKEW (Tail Risk) traded in 127 to 137 zone and then ended up closing near 131.4 (normal = 120-125, range 100-150).
Are all quiet on the Eastern & Mid-Western Fronts? For now, YES & NO.... lol... means stay tuned Sailors. Grumpie's agenda may be in trouble more than he thinks.

3-month VIX Futures Spread(VX) Chart
Our VX Spread spike from -3 to -1 before rolling over back down to -2.7 on Friday.
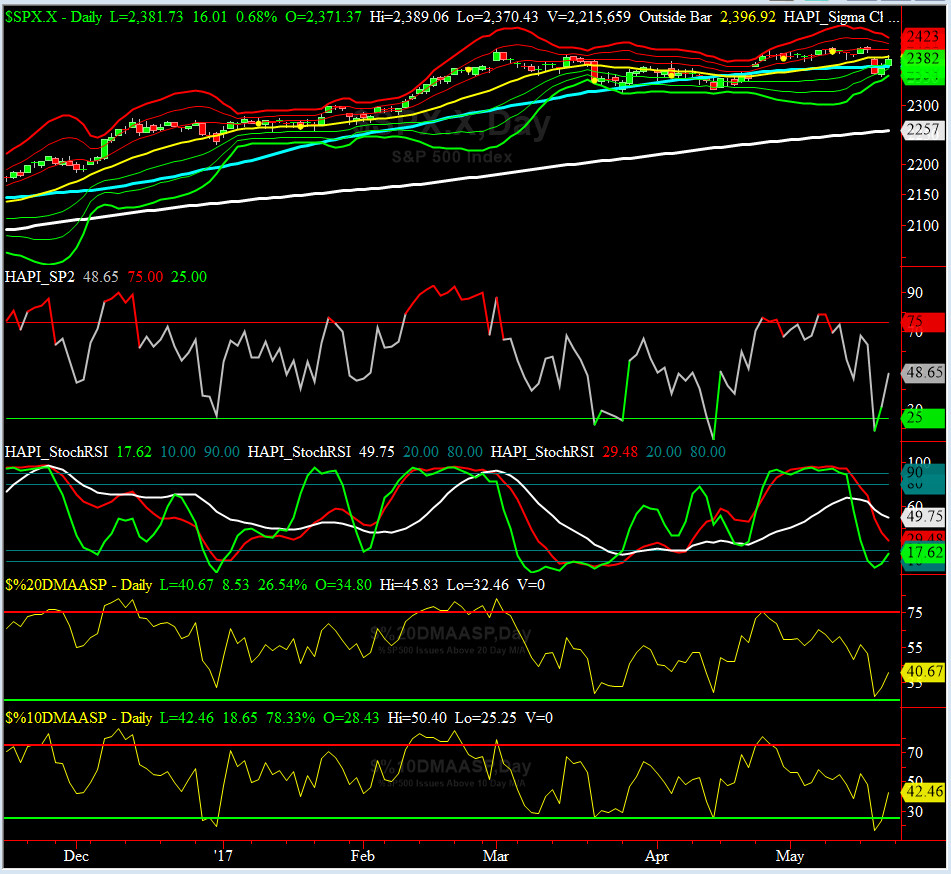
HA_SP2 Chart
HA_SP2 = 48.7 (Buy signal <= 25, Sell Signal >= 75)
We are in NEUTRAL zone after hovering in 19s for most of Wednesday. "We are looking for sub-25" forecast from last week issue came true also. We love this prop indicator.
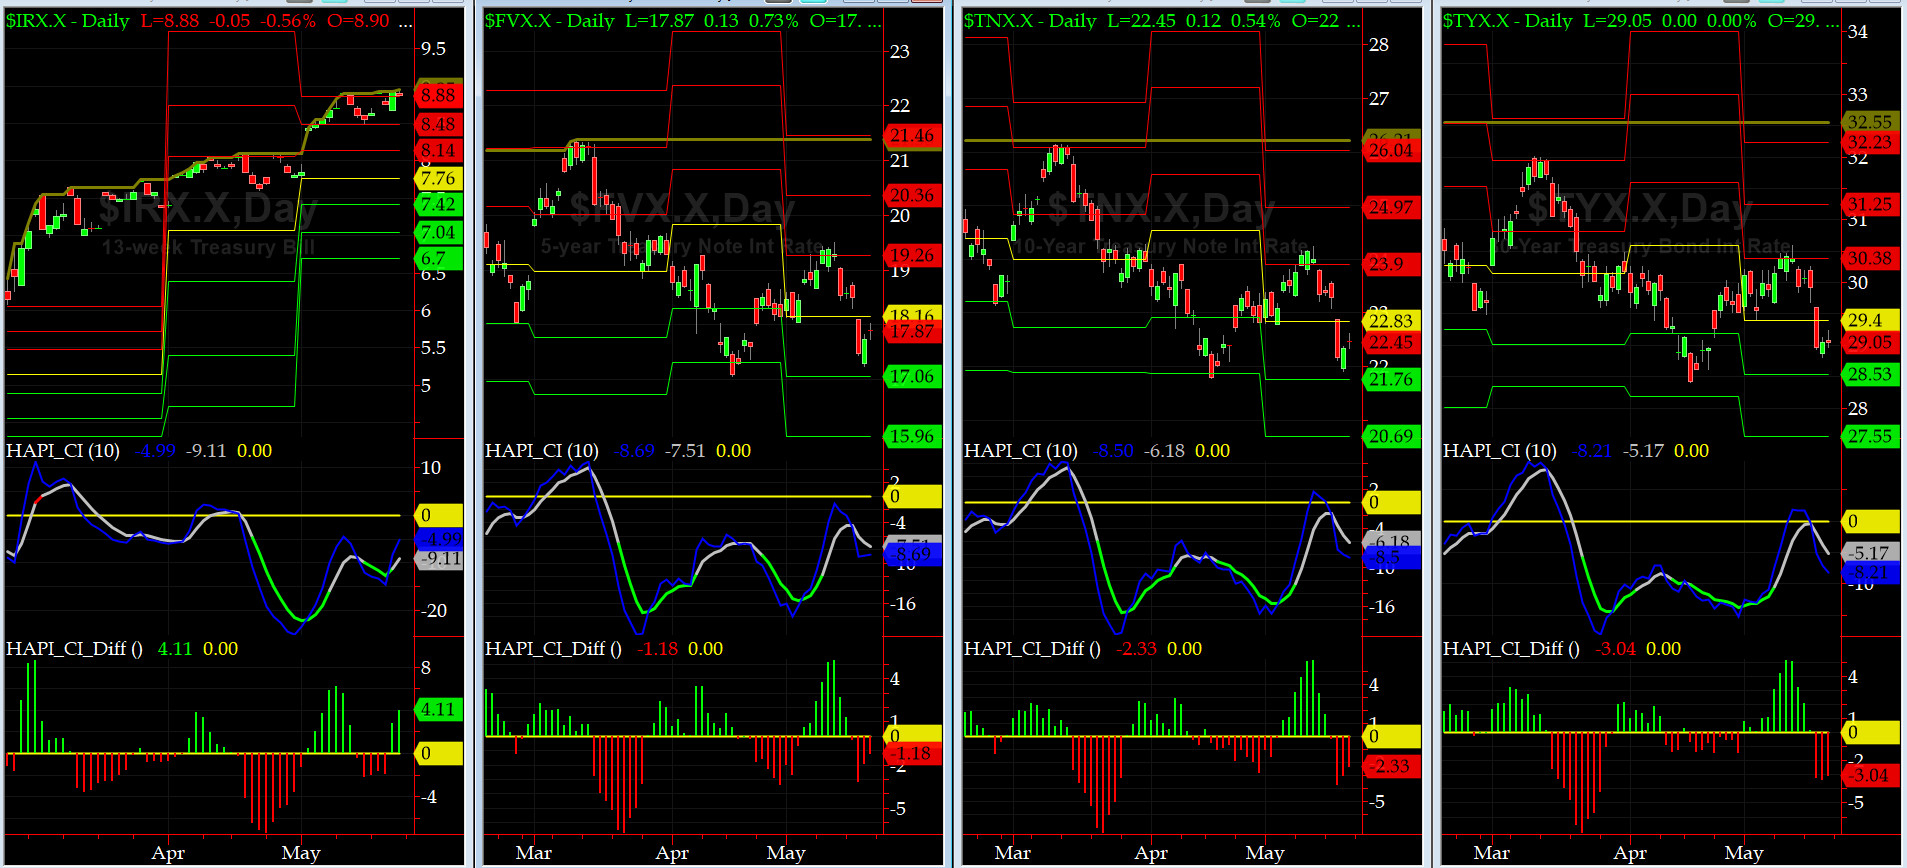
US Treasury T-Notes & T-Bonds Yields Chart
During most of the past week, the US Bond Market rallied & YTMs dropped while in a "suprise" and massive flight-to-safety trade.
Fari Hamzei
|


 Proactive Market Timing