|
Sunday, June 4, 2017, 1500ET
Market Timing Charts, Analysis & Commentary for Issue #195
Timer Charts of S&P-500 Cash Index (SPX) + NASDAQ-100 Cash Index (NDX)
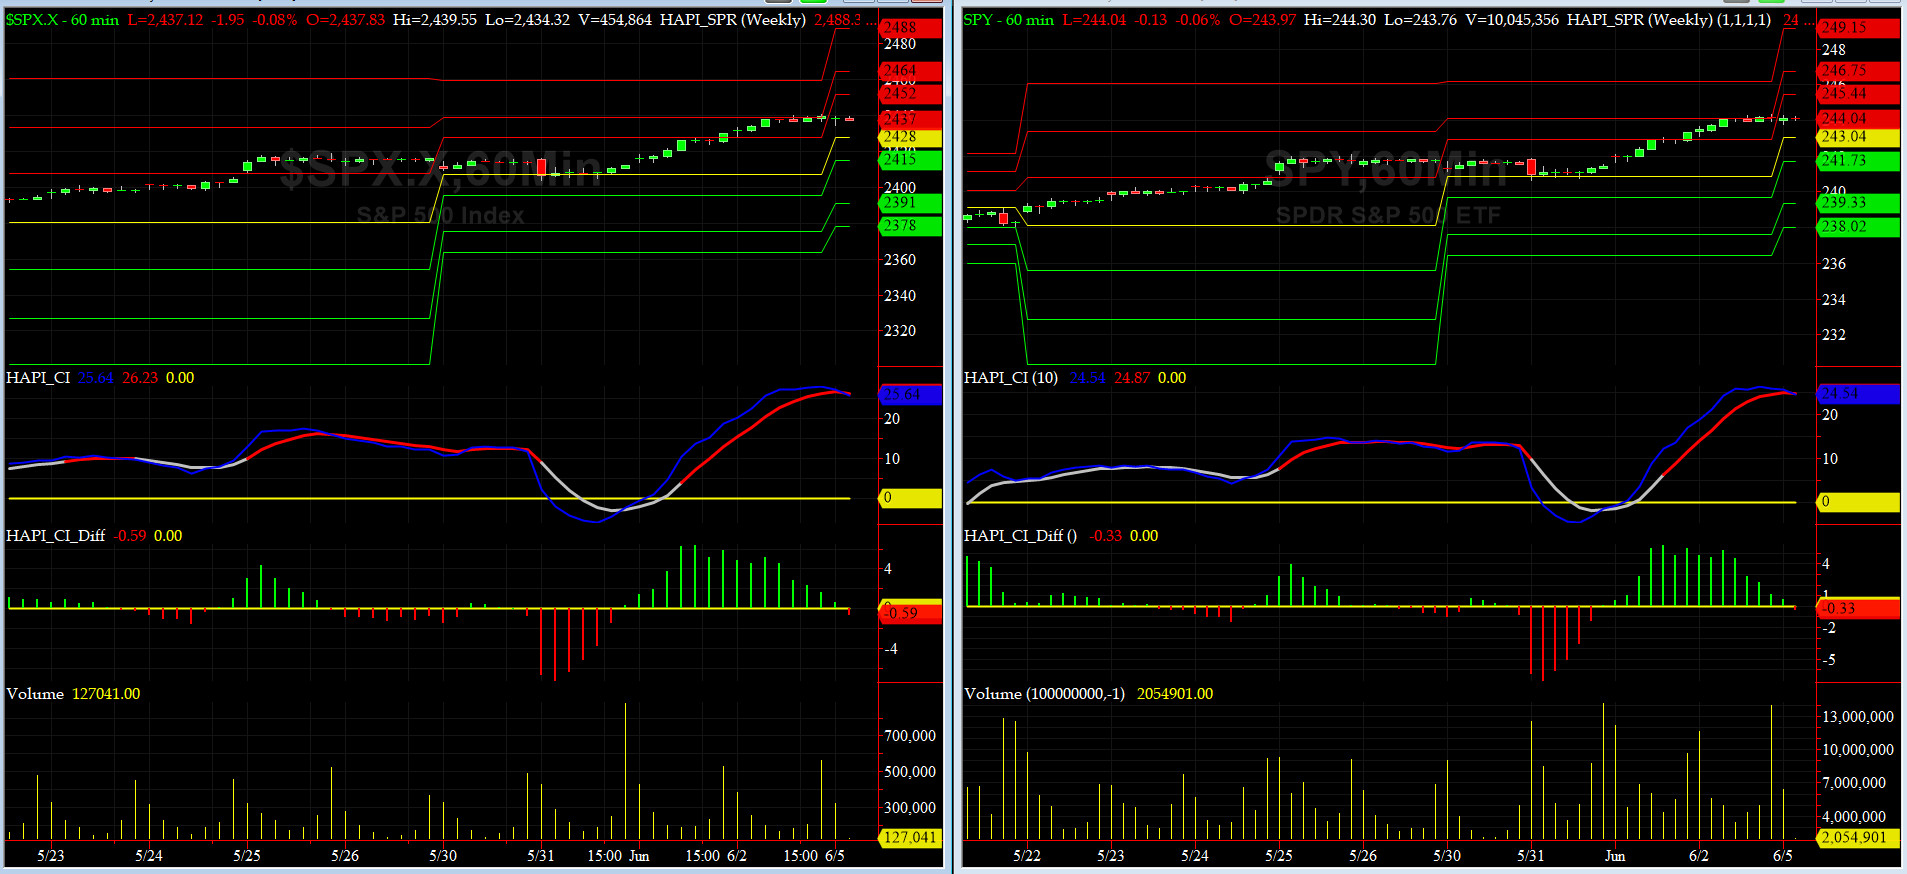
Most recent S&P-500 Cash Index (SPX): 2439.07 up +23.25 (up +0.96%) for the week ending Friday, June 2, 2017, which closed at its +2 sigma.
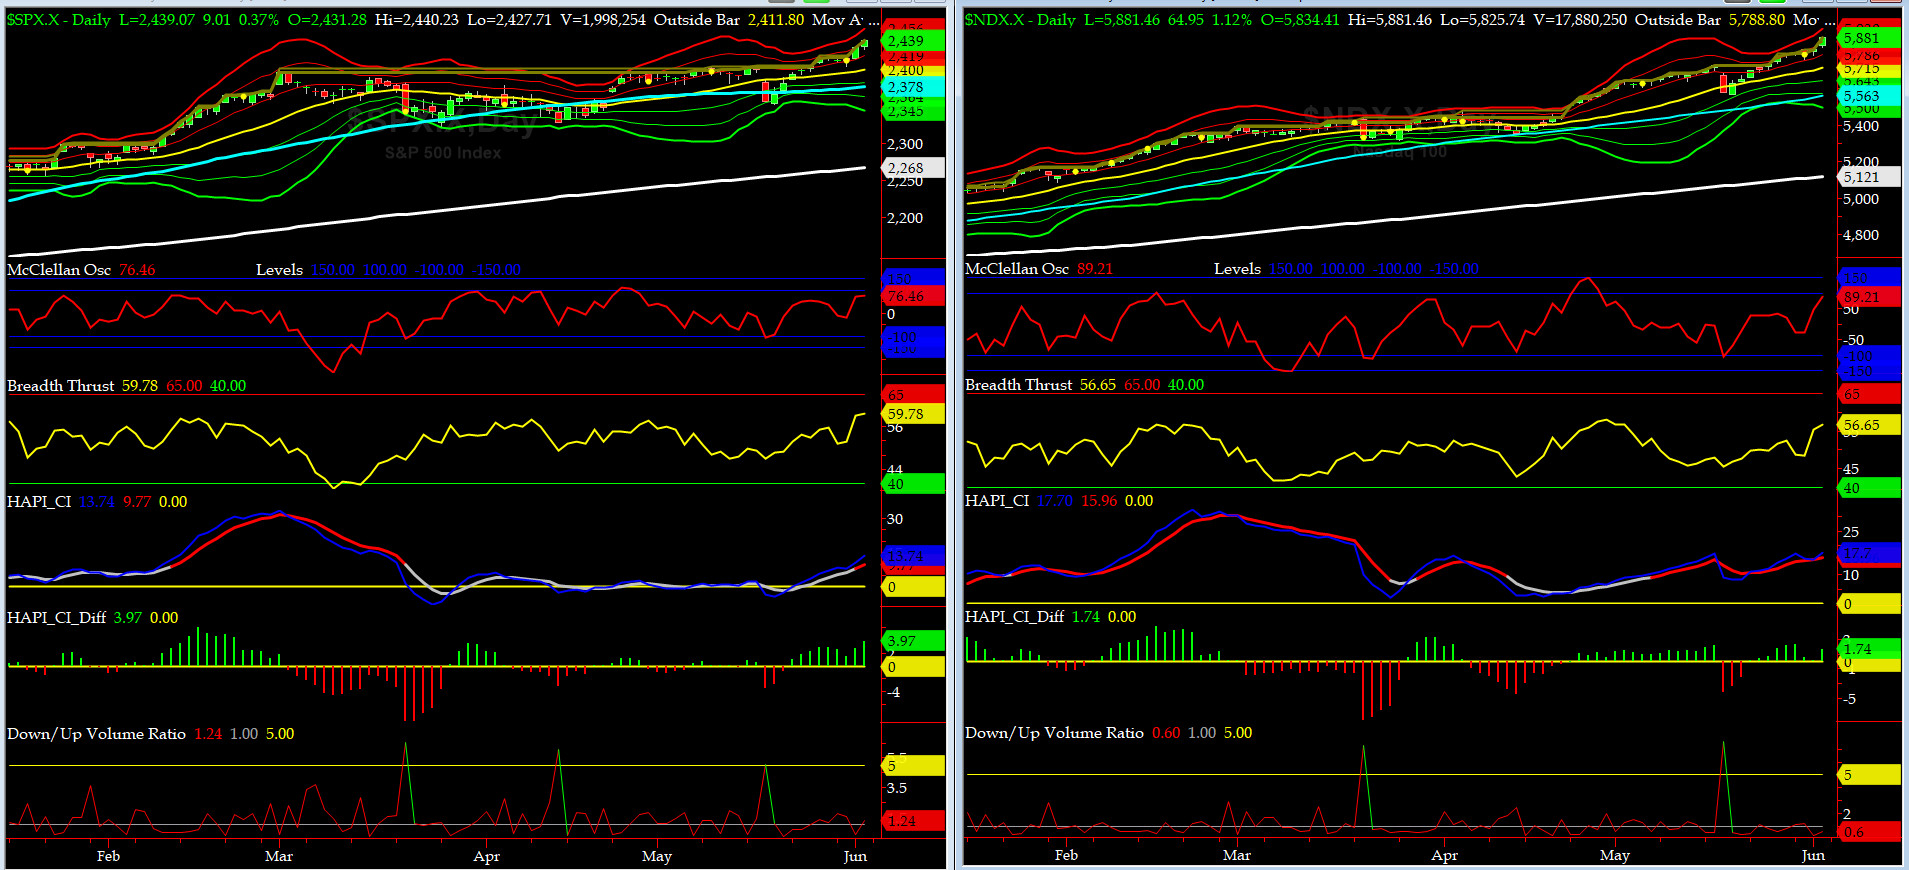
SPX ALL TIME INTRADAY HIGH = 2440.23 (reached on Friday, June 2, 2017)
SPX ALL TIME CLOSING HIGH = 2439.07 (reached on Friday, June 2, 2017)
Current DAILY +2 Sigma SPX = 2437 with WEEKLY +2 Sigma = 2441
Current DAILY 0 Sigma (20 day MA) SPX = 2400 with WEEKLY 0 Sigma = 2359
Current DAILY -2 Sigma SPX = 2364 with WEEKLY -2 Sigma = 2277
NYSE McClellan Oscillator = +76.5 (-150 is start of the O/S area; around -275 to -300 area or lower, we go into the �launch-pad� mode, over +150, we are in O/B area)
NYSE Breadth Thrust = 59.8 (40 is considered as oversold and 65 as overbought)
With divergences galore, our markets continue to demonstrate a non-stop case of irrational exuberance (and for what is the 64MM question - adjusted for value of USD these days LOL). While we cannot get long with these lofty internals� readings, keep shorting this market (specially via higher strike long puts) has been a tough & expensive proposition of late.
The seasonality for early June favors the bearish side and if former FBI Dir Comey has a bombshell in his testimony before Senate Intel Committee on Thursday, that is NOT already discounted by market participants, maybe we see a pullback before it is bought again by the raging bulls.
Go Figure�
Canaries [in the Coal Mine] Chart for DJ TRAN & RUT Indices
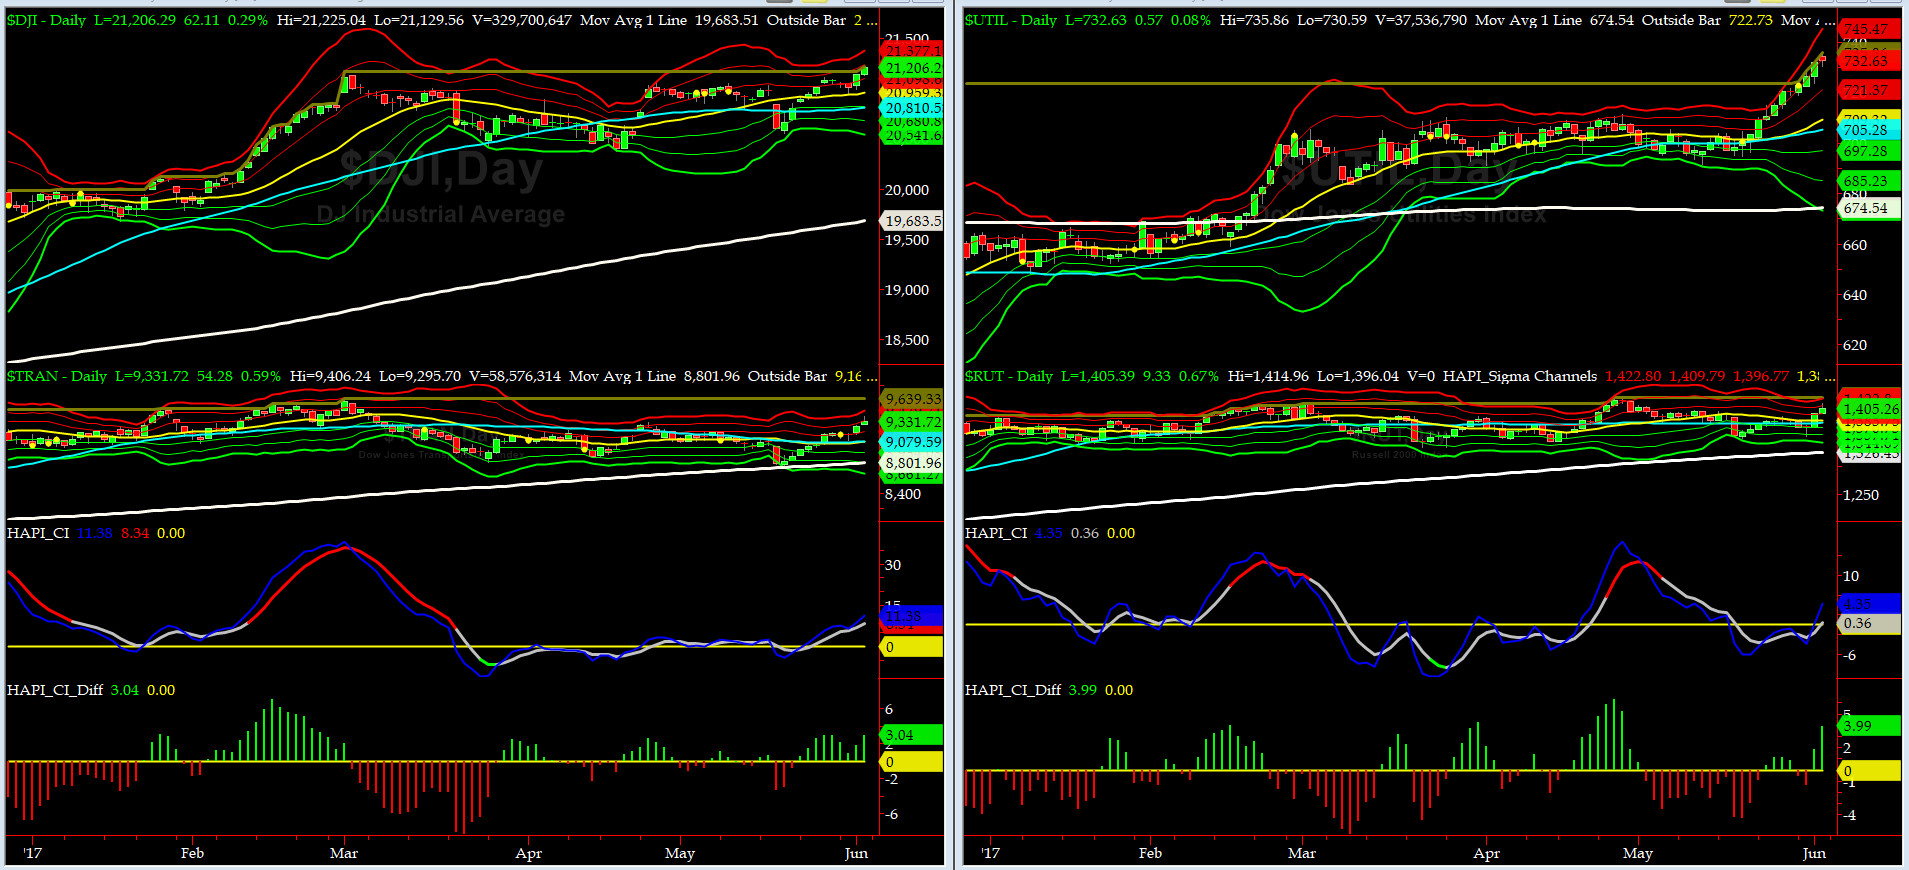
200-Day MA DJ TRAN = 8801 or 6% below DJ TRAN (max observed in last 5 yrs = 20.2%, min = -20.3%)
200-Day MA RUT = 1326 or 5.9% below RUT (max observed in last 5 yrs = 21.3%, min = -22.6%)
DJ Transportation Index (proxy for economic conditions 6 to 9 months hence) rallied hard on Thursday & early Friday and is still ~3% below its ATH.
Russell 2000 Small Caps Index (proxy for Risk ON/OFF) also rallied hard off of its 50day MA and now stands at 1% below its ATH.
DeTrenders Charts for SPX, NDX, TRAN & RUT Indices
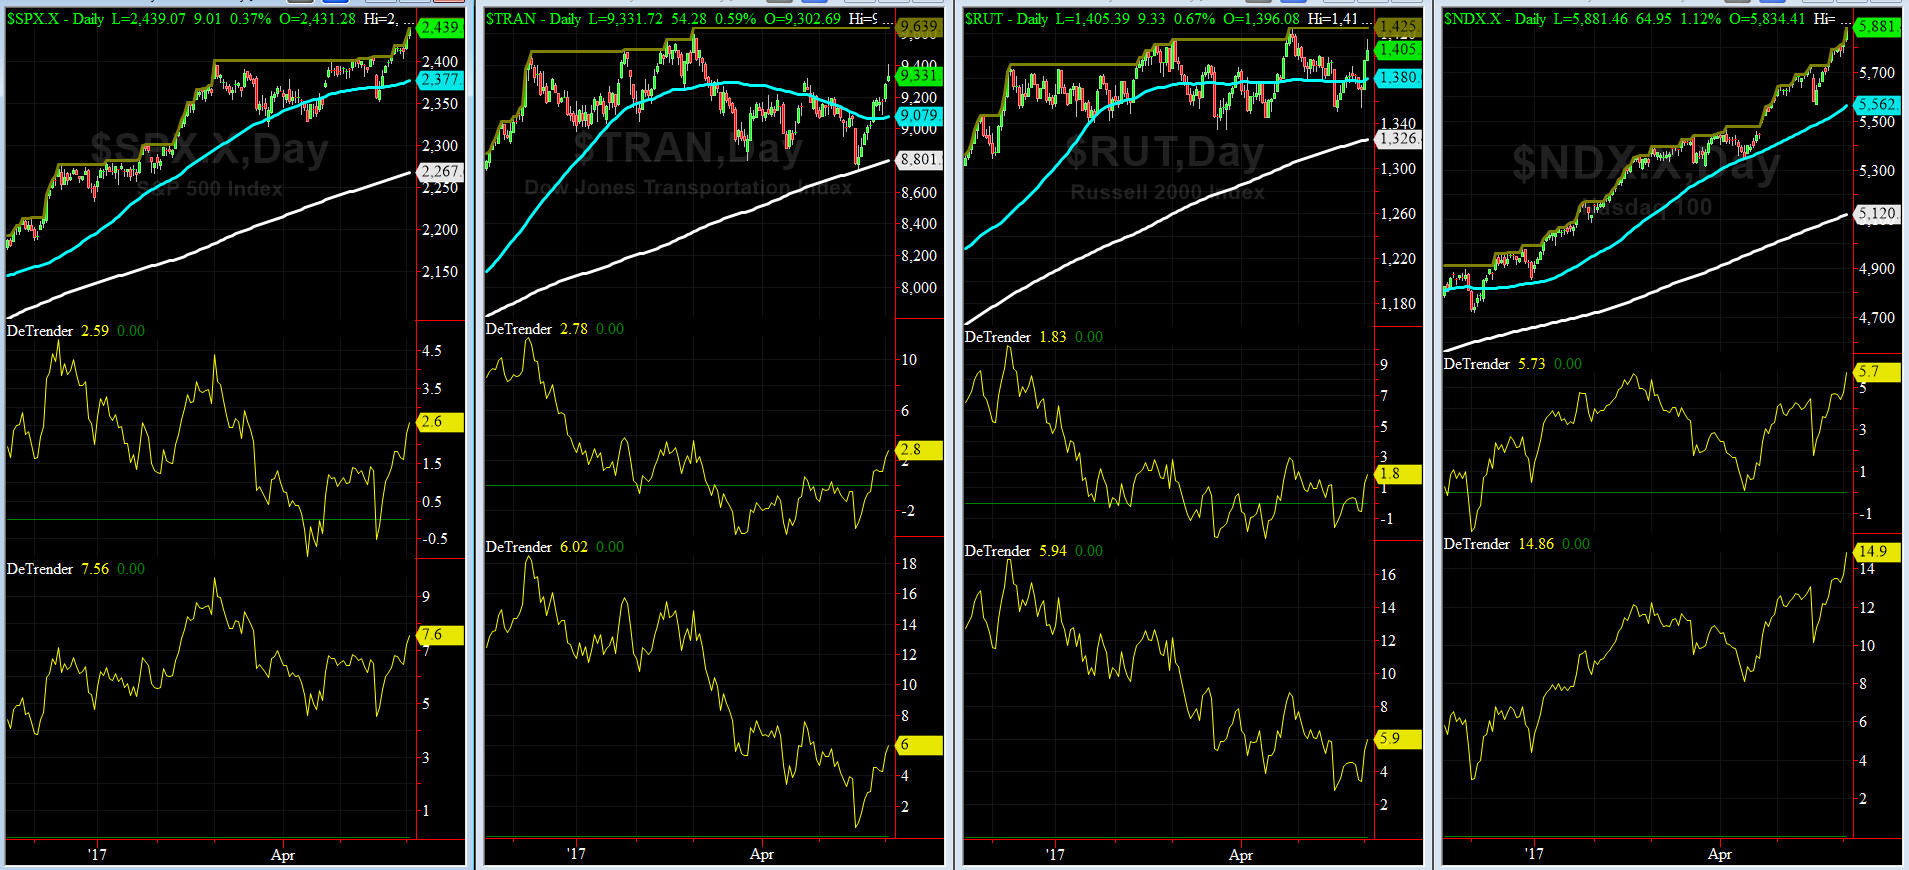
50-Day MA SPX = 2368 or 1.8% below SPX closed on Friday (max observed in last 5 yrs = +8.6%, min = -9.3%)
200-Day MA SPX = 2251 or 6.8% below SPX (max observed in last 5 yrs = 15.2%, min = -14%)
ALL of our EIGHT DeTrenders are POSITIVE for 2nd week in a row. The DeTrenders for DJ Tran & RUT will continue to be harbingers of future price behavior in broad indices.

HA_SP1_Momo Chart
WEEKLY Timing Model = on a BUY Signal since Friday 12/16/16 CLOSE at 2258
DAILY Timing Model = on a BUY Signal since Thursday 5/25/17 CLOSE at 2357
Max SPX 52wk-highs reading last week = 123 (over 120-140, the local maxima is in)
Max SPX 52wk-Lows reading last week = 18 (over 40-60, the local minima is in)
HA_SP1 at just above its +2 sigma channels
HA_Momo = +5.3 (reversals most likely occur above +10 or below -10)
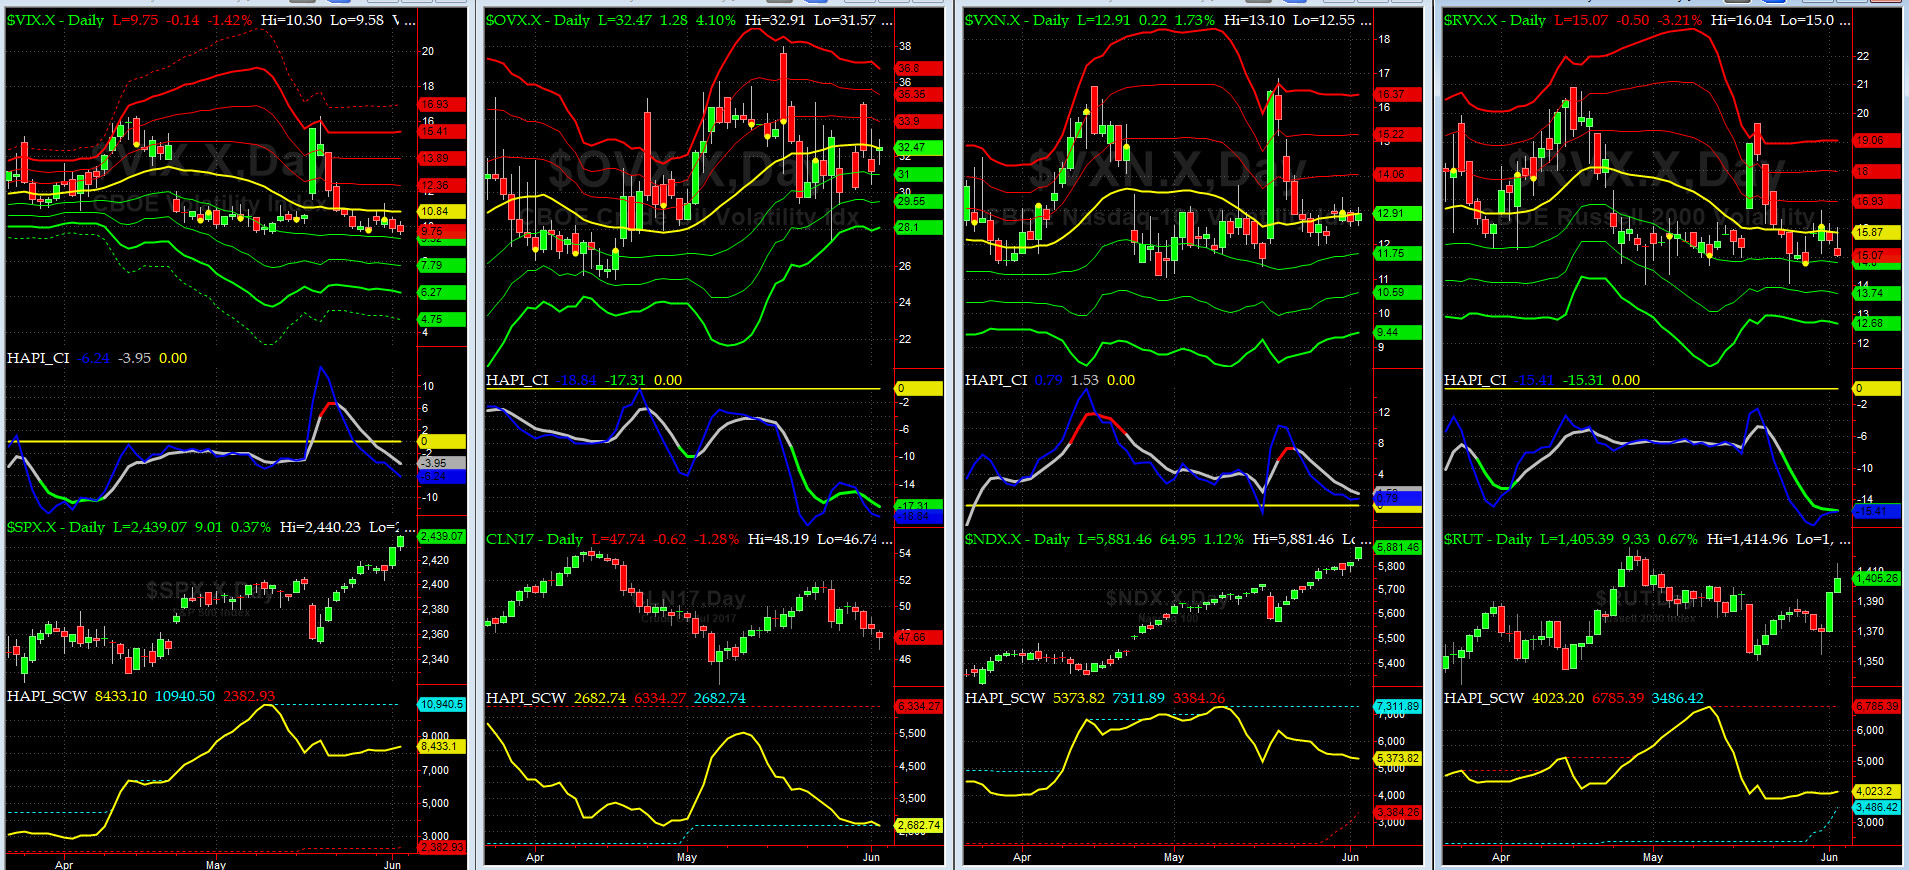
Vol of the Vols Chart
VIX currently stands at 9.8, or just above its -1 sigma ( remember it's the VIX volatility pattern ( its sigma channels) that matters, and not the level of VIX itself ( this is per Dr. Robert Whaley, a great mentor and inventor of original VIX, now called VXO ). VIX usually peaks around a test of its +4 sigma).
Vol Indices remained fairly quiet this week. Remember Navy Sailors recall that Vol Cycles are more predictive than Price Cycles.
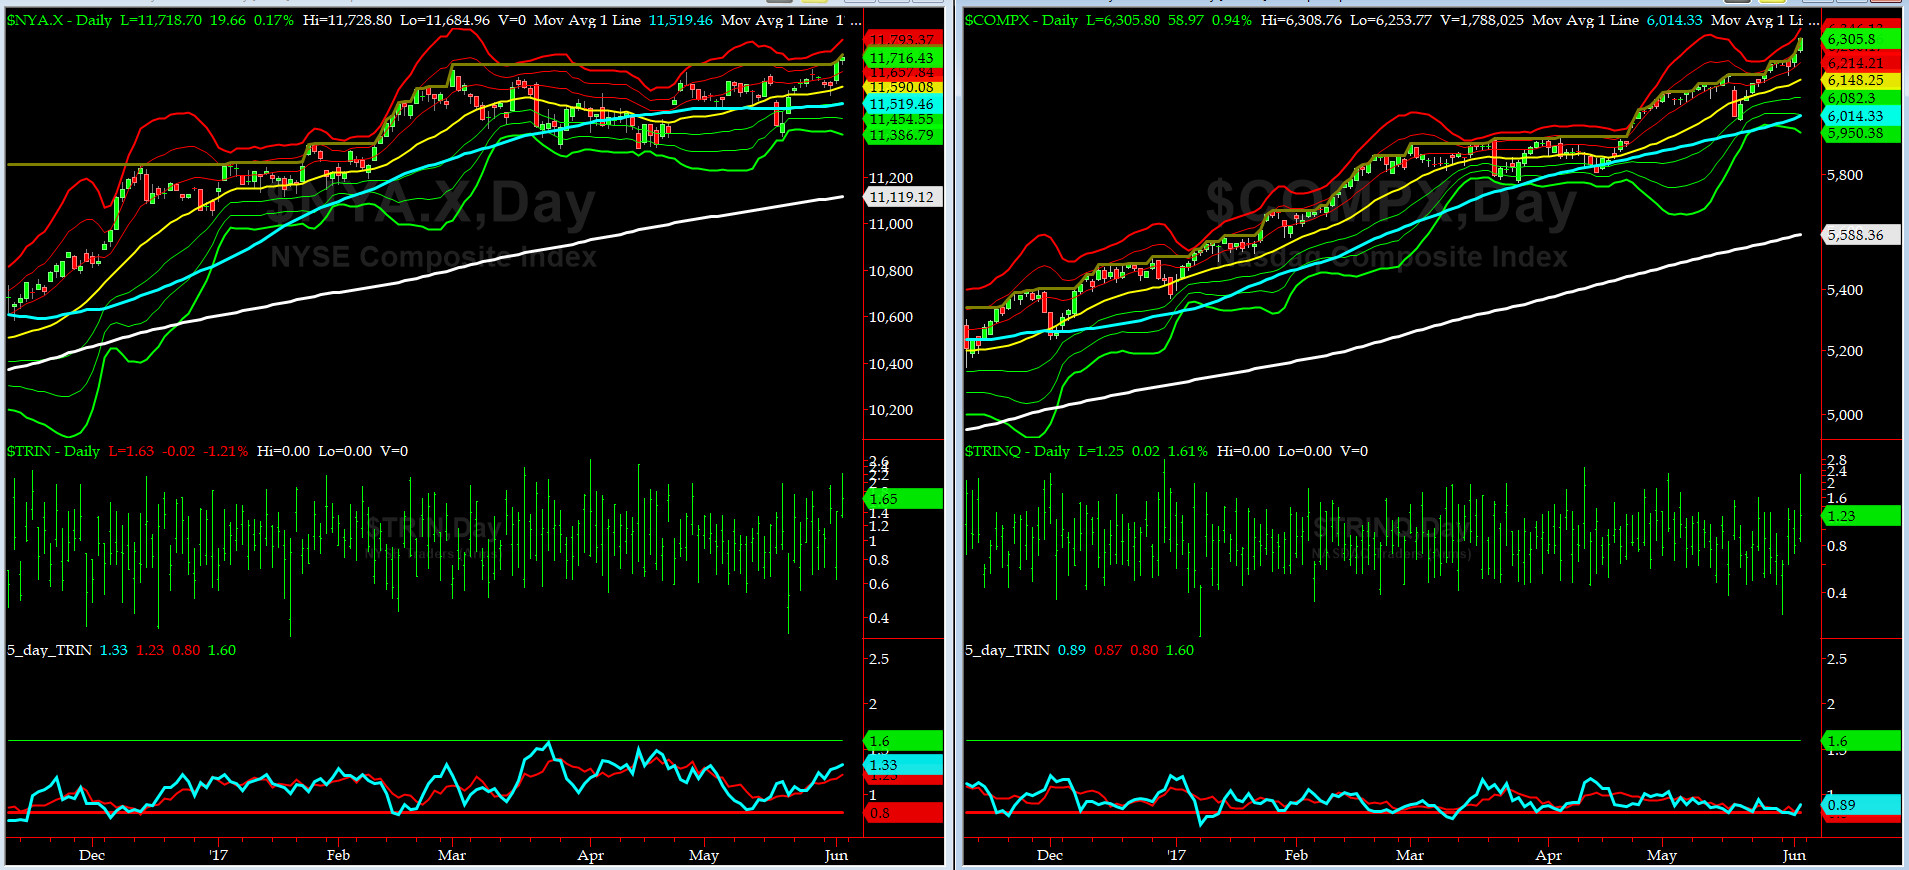
5-day TRIN & TRINQ Charts
NYSE 5-day TRIN is still in the NEUTRAL zone while the NASDAQ 5-day TRINQ remains in close to a SELL signal.

Components of SPX above their respective 200day MA Chart
This scoring indicator while did not test 50% zone, is in an strong divergence with SPX. This is a must watch indicator going forward.
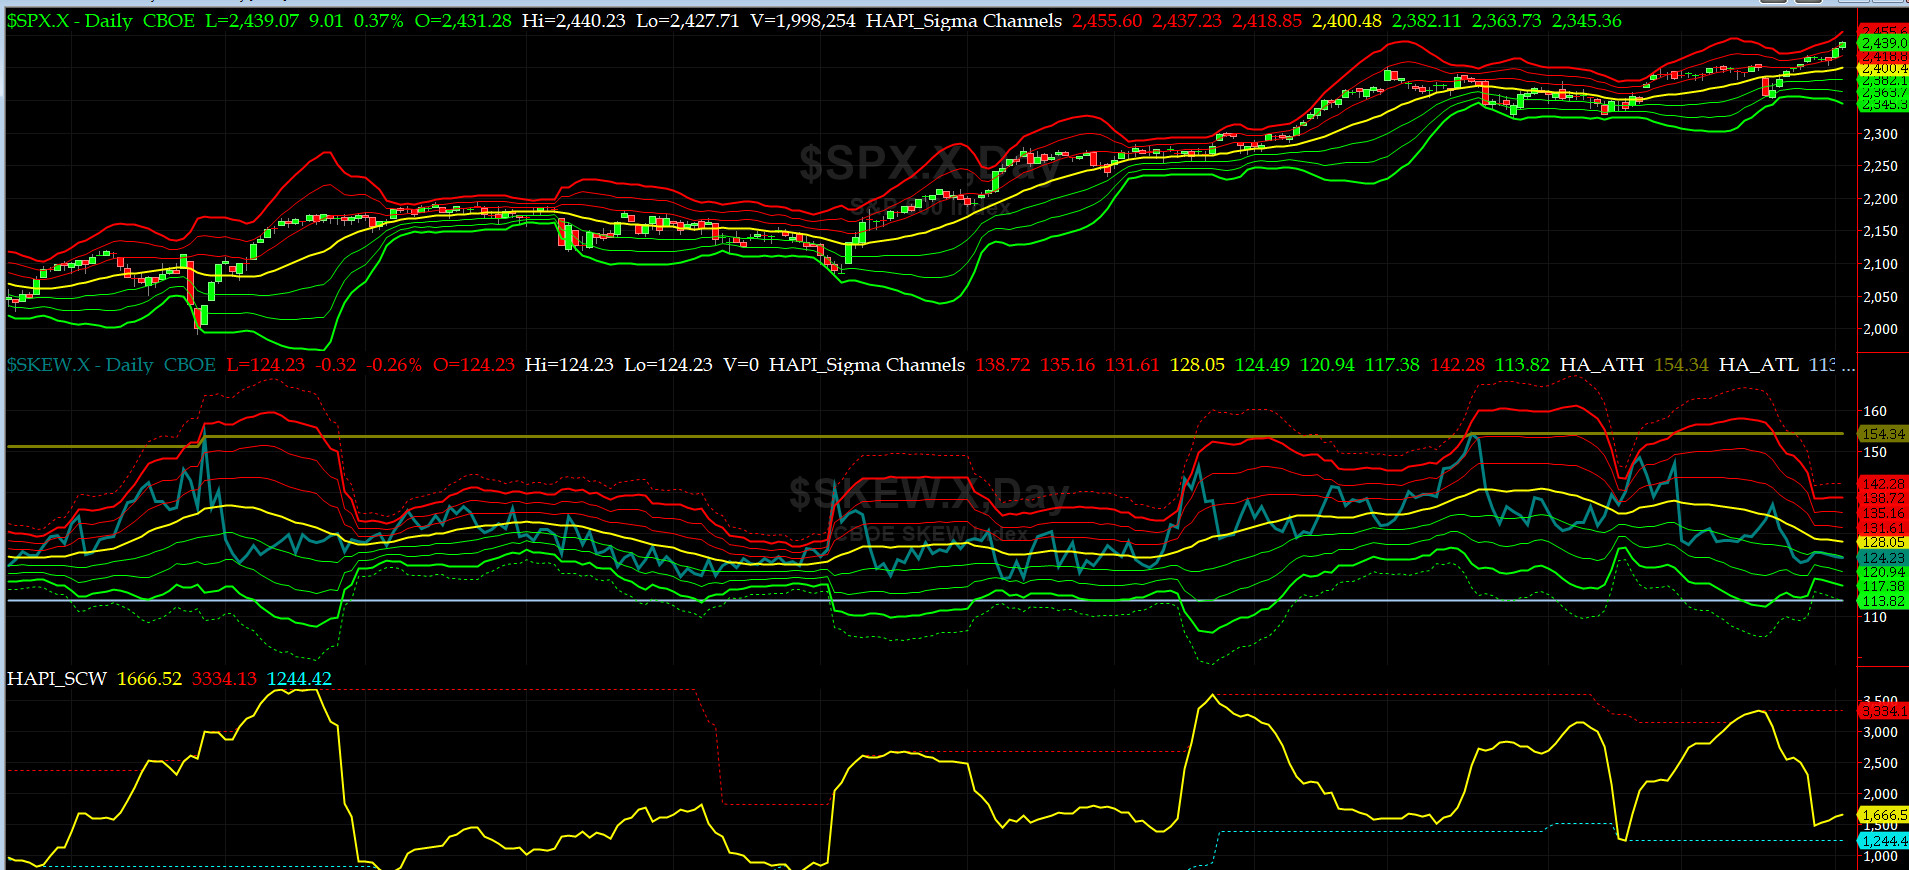
SPX SKEW (Tail Risk) Chart
Last week SPX SKEW (Tail Risk) stayed in 124-125 range near its -1 sigma (normal = 120-125, range 100-150).
Is all quiet on the Eastern & Mid-Western Fronts? For now, large market participants think YES. We disagree but then again we're just another PDI......LOL.
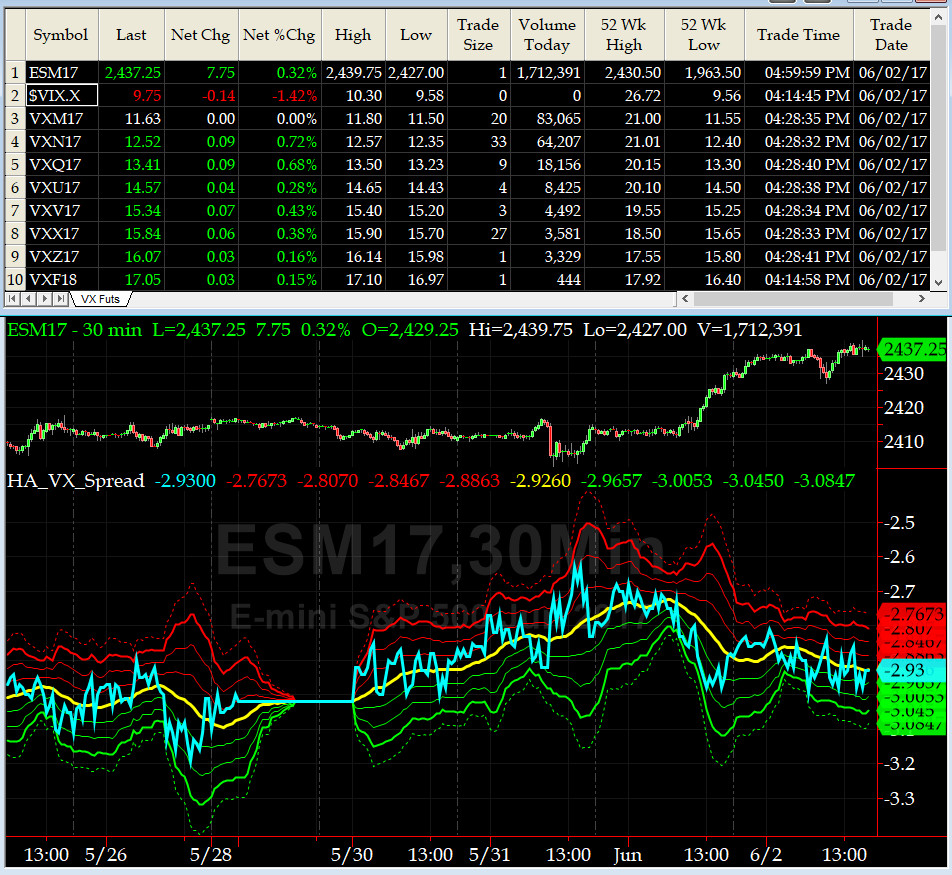
3-month VIX Futures Spread(VX) Chart
Our VX Spread traded from about -2.5 to -3 for most of last week. No signal here.
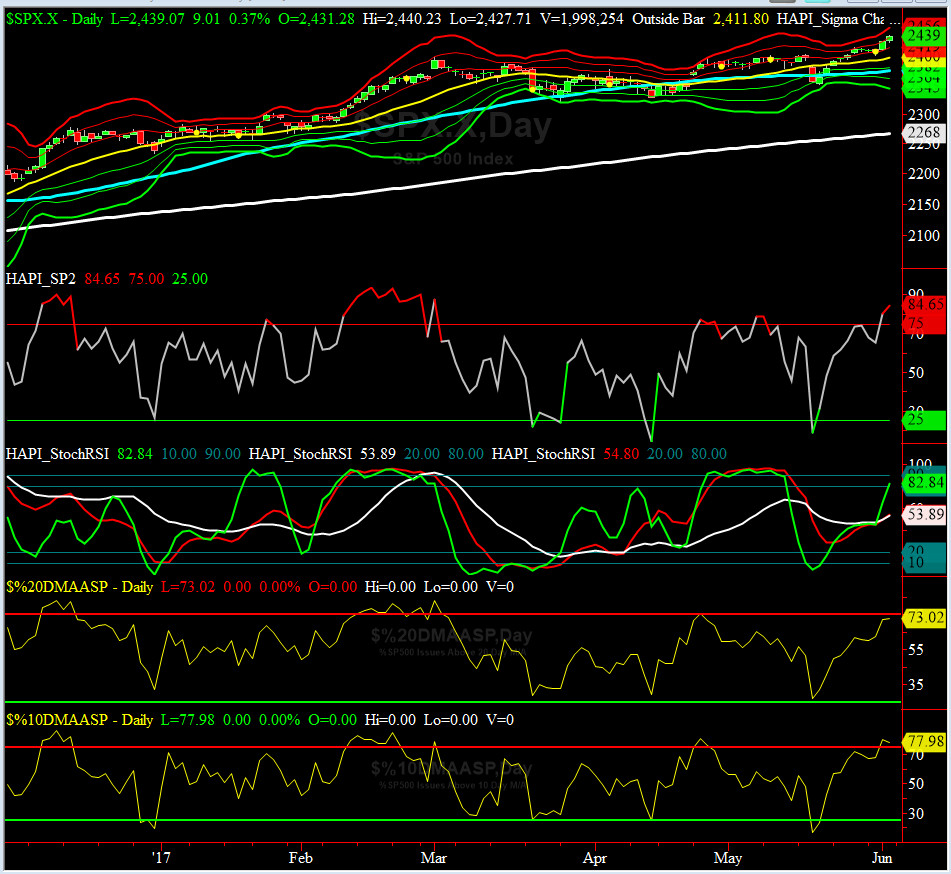
HA_SP2 Chart
HA_SP2 = 84.7 (Buy signal <= 25, Sell Signal >= 75)
We are very OVERBOUGHT now. Will the markets sell off here? Who knows. Just like Ferdinand Magellan, we're in unchartered waters, ioho.
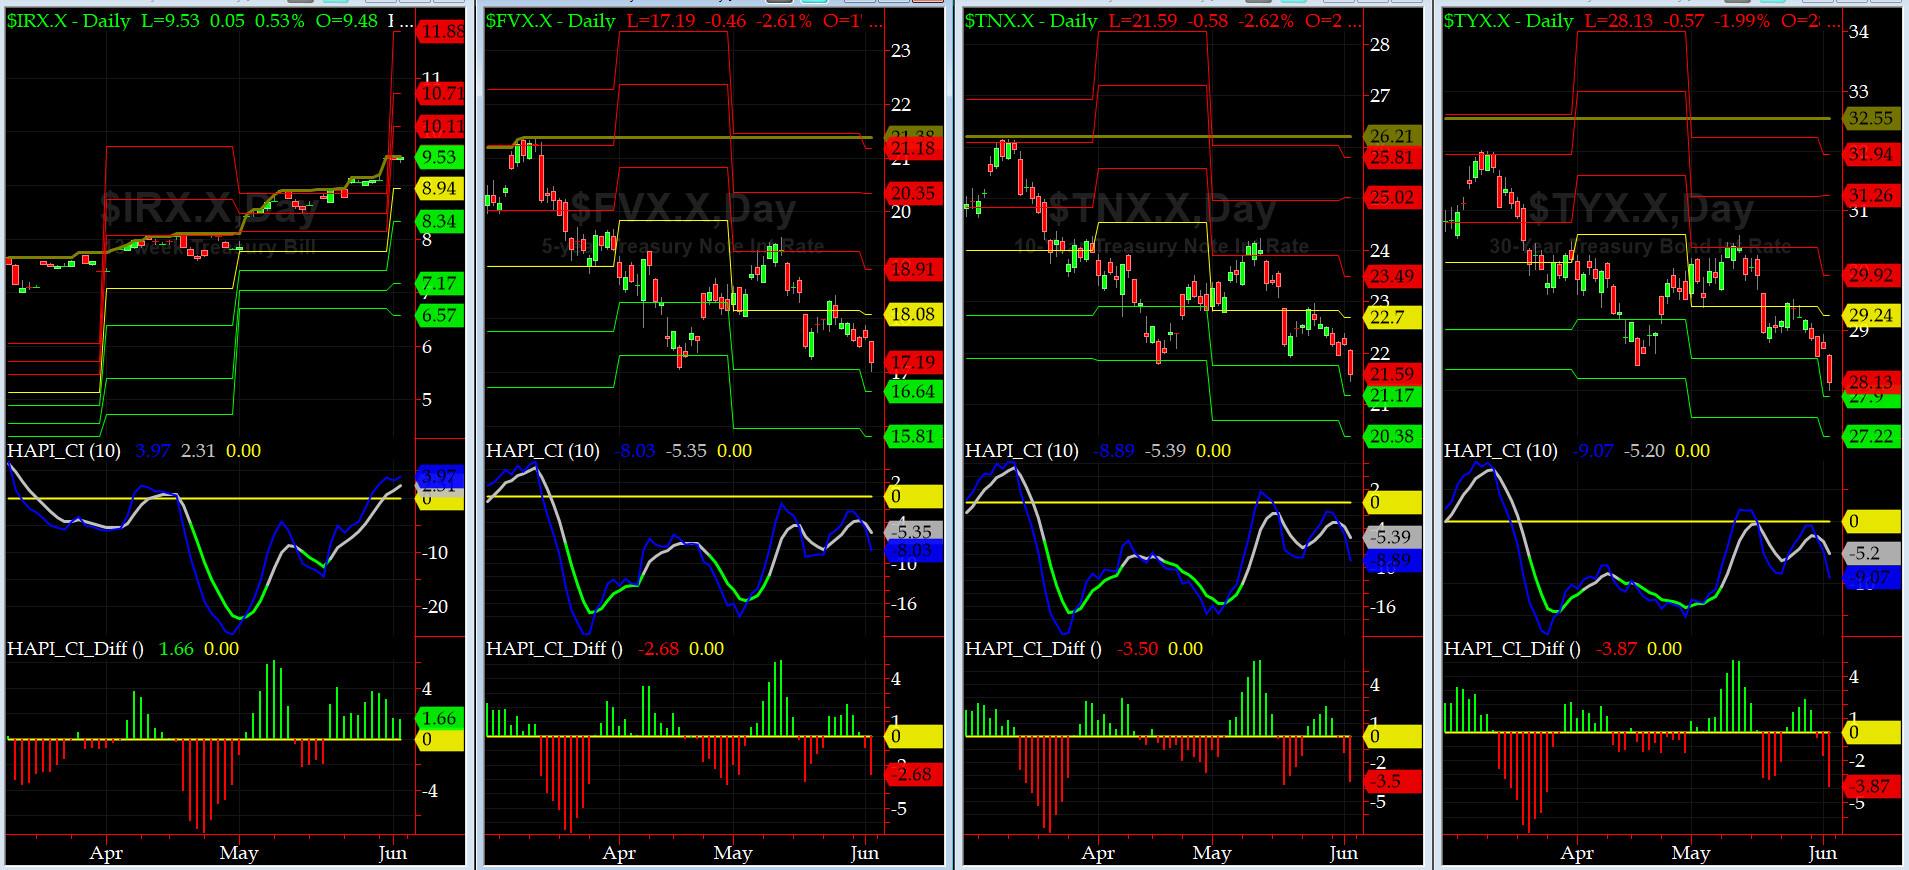
US Treasury T-Notes & T-Bonds Yields Chart
Last week was another flight to safety week in our Debt Markets with US Notes & Bonds rallying higher as YTMs fell further.
Fari Hamzei
|


 Proactive Market Timing