|
Saturday, June 10, 2017, 1115ET
Market Timing Charts, Analysis & Commentary for Issue #196
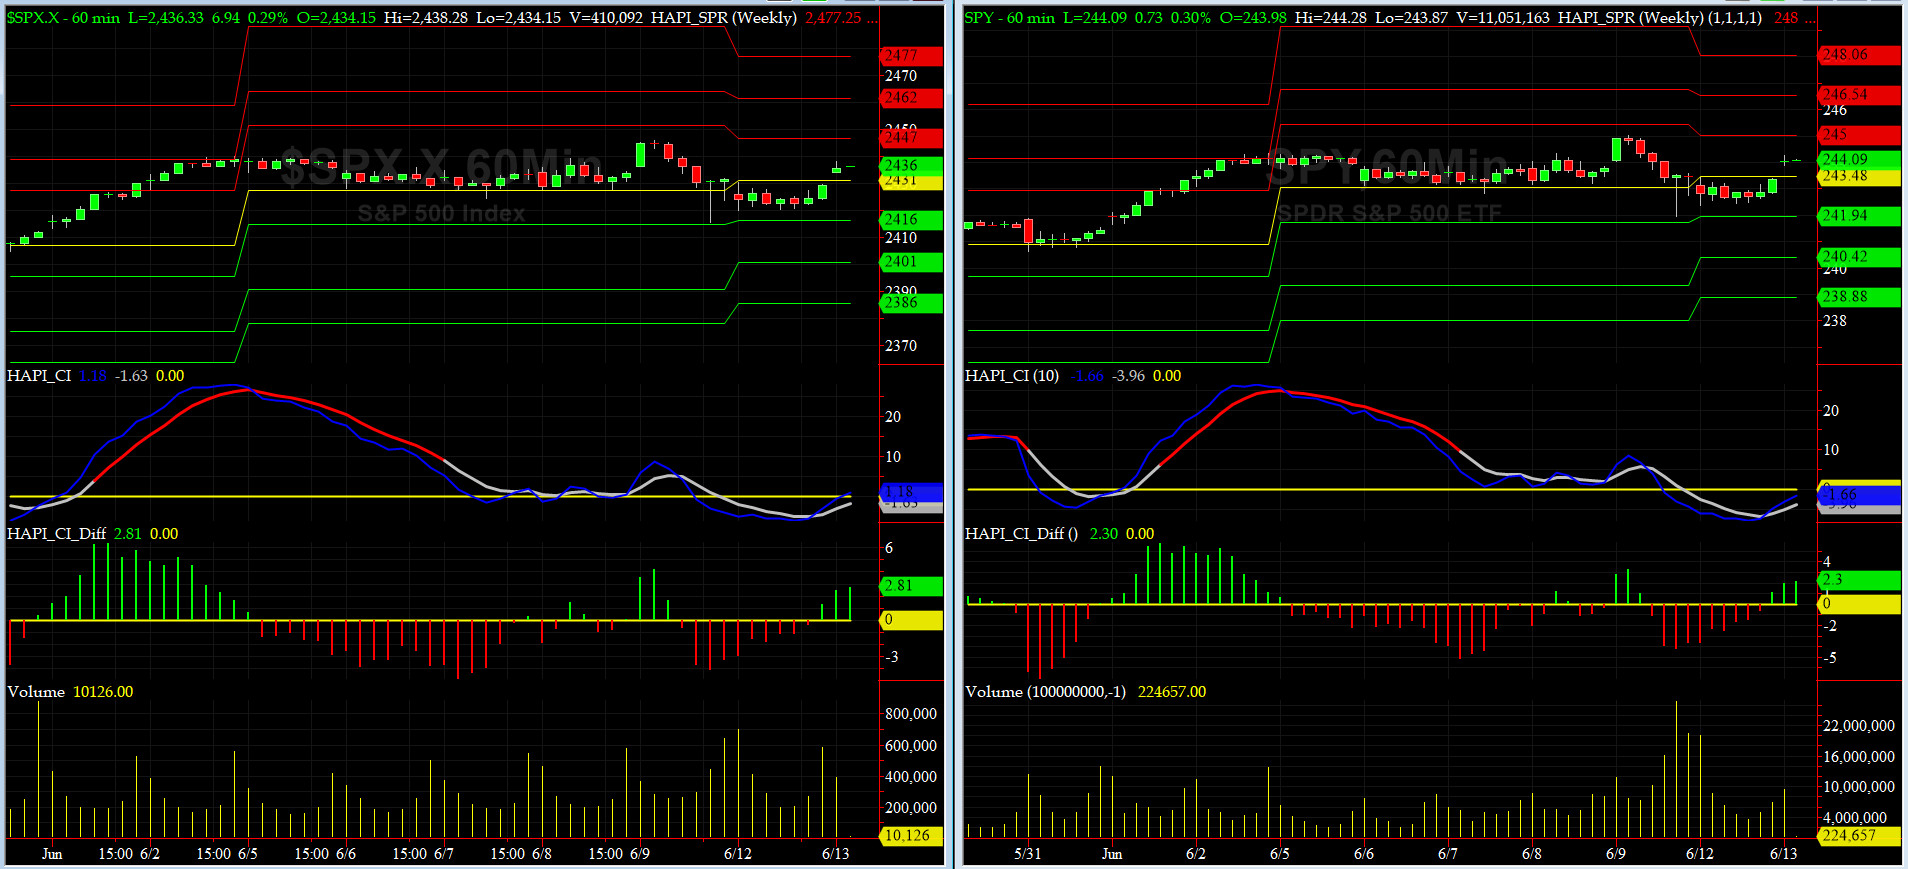
Timer Charts of S&P-500 Cash Index (SPX) + NASDAQ-100 Cash Index (NDX)
Most recent S&P-500 Cash Index (SPX): 2431.77 down -7.30 (down -0.3%) for the week ending Friday, June 9, 2017, which closed at its +1 sigma.
SPX ALL TIME INTRADAY HIGH = 2446.20 (reached on Friday, June 9, 2017)
SPX ALL TIME CLOSING HIGH = 2439.07 (reached on Friday, June 2, 2017)
Current DAILY +2 Sigma SPX = 2455 with WEEKLY +2 Sigma = 2444
Current DAILY 0 Sigma (20 day MA) SPX = 2409 with WEEKLY 0 Sigma = 2367
Current DAILY -2 Sigma SPX = 2364 with WEEKLY -2 Sigma = 2290
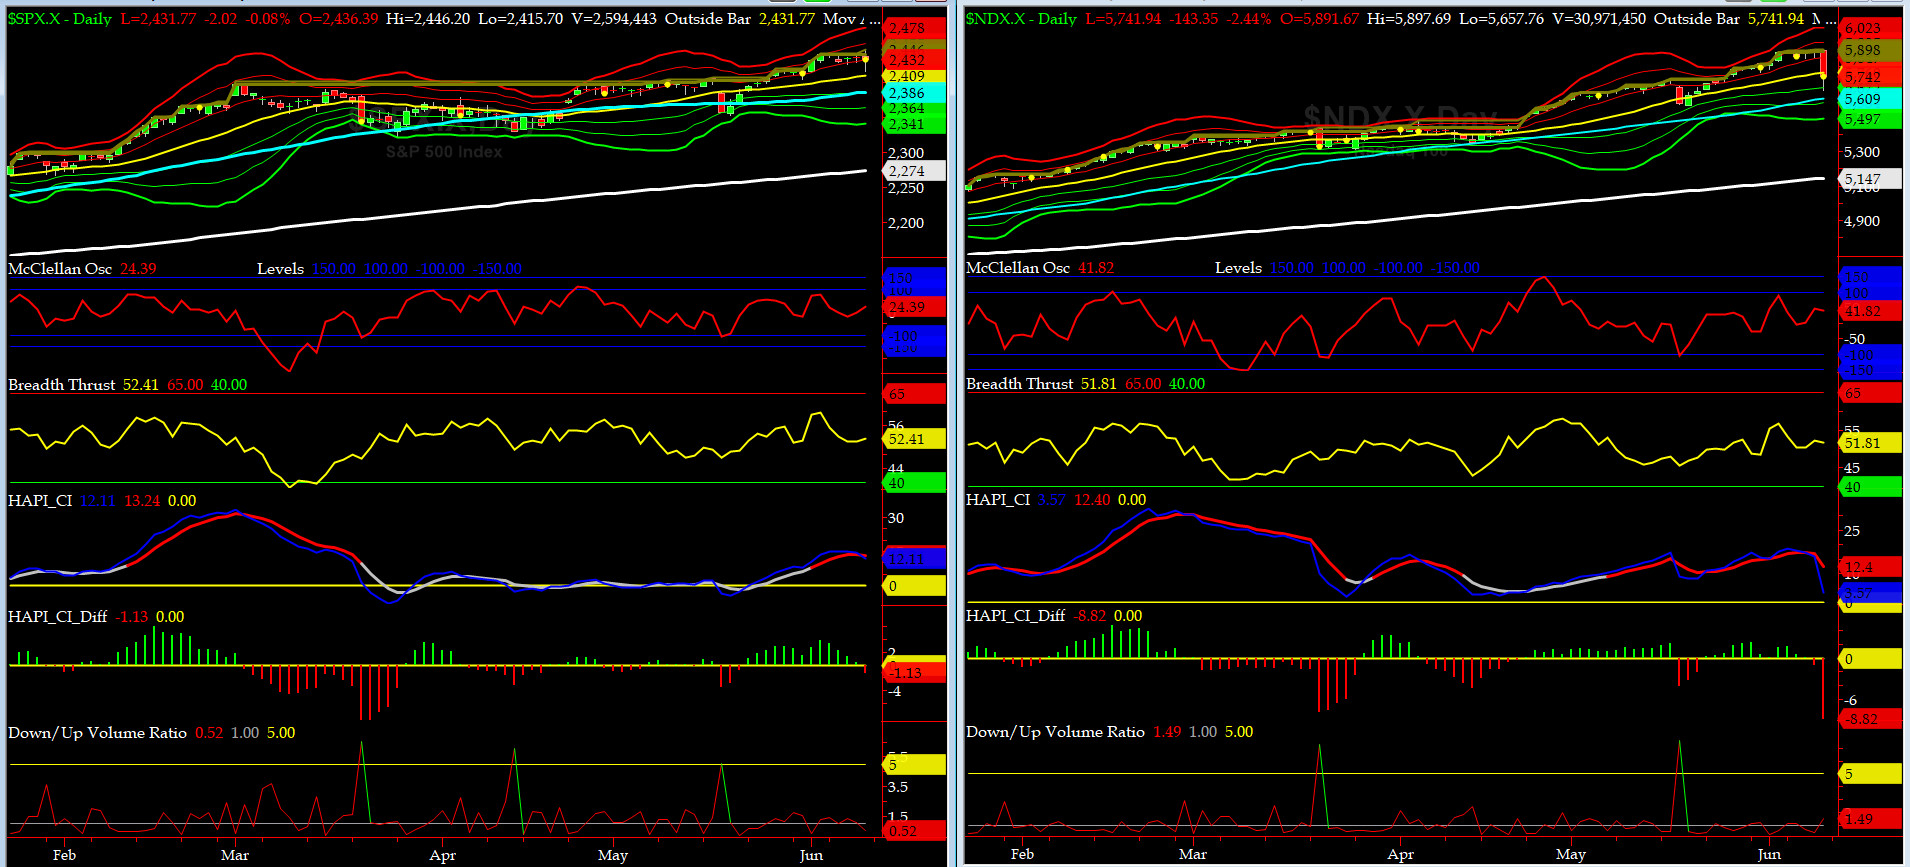
NYSE McClellan Oscillator = +24.4 (-150 is start of the O/S area; around -275 to -300 area or lower, we go into the �launch-pad� mode, over +150, we are in O/B area)
NYSE Breadth Thrust = 52.4 (40 is considered as oversold and 65 as overbought)
Ex-FBI Dir testimony on Thursday got priced in quickly given the public release of his opening remarks a day earlier, but by Friday afternoon, we witnessed a defiant Grumpie in the Rose Garden, which may have saved our markets, at least for now. More drama this week on the Hill with Mueller and Sessions on deck.... Sailors, fasten your harnesses... the ride ahead should get bumpier ahead of Earning Season, and thus deliver another wonderland for day traders.
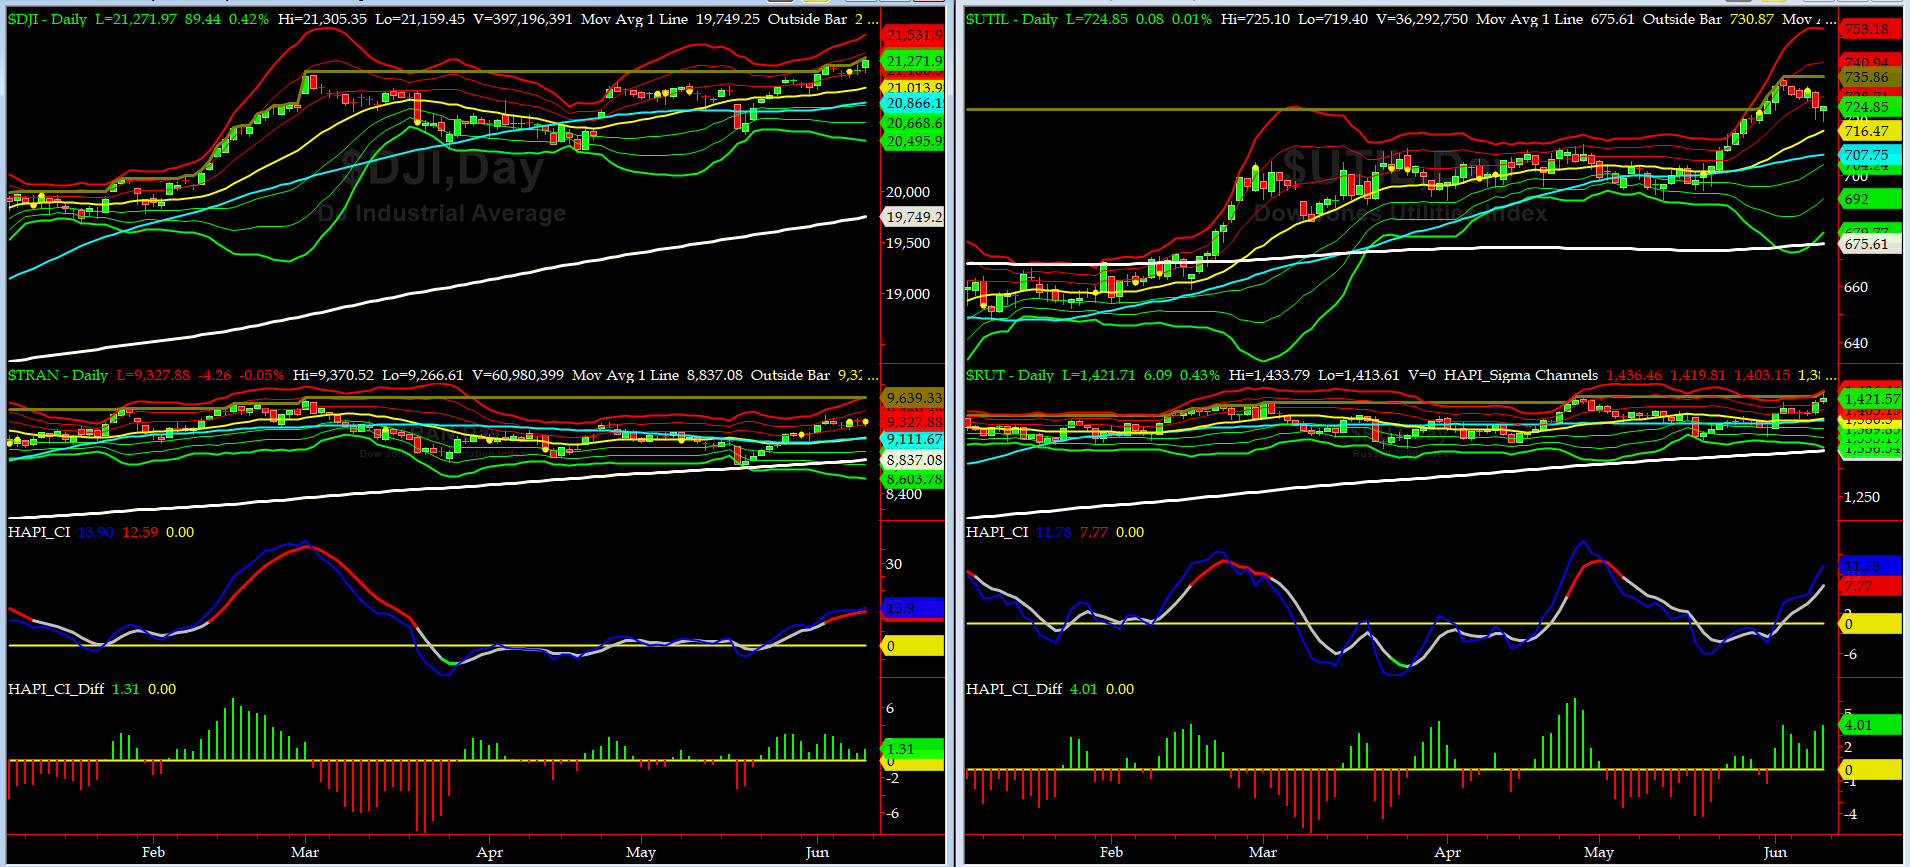
Canaries [in the Coal Mine] Chart for DJ TRAN & RUT Indices
200-Day MA DJ TRAN = 8837 or 5.6% below DJ TRAN (max observed in last 5 yrs = 20.2%, min = -20.3%)
200-Day MA RUT = 1330 or 6.8% below RUT (max observed in last 5 yrs = 21.3%, min = -22.6%)
DJ Transportation Index (proxy for economic conditions 6 to 9 months hence) went sideways this week as indices made new highs. This pause is again reminding us of the divergences abound.
Russell 2000 Small Caps Index (proxy for Risk ON/OFF) rallied hard on Thursday and then into new ATHs early Friday but gave back most. RISK is back ON.... just look at NVDA.....do you remember QCOM in Q4 '99?
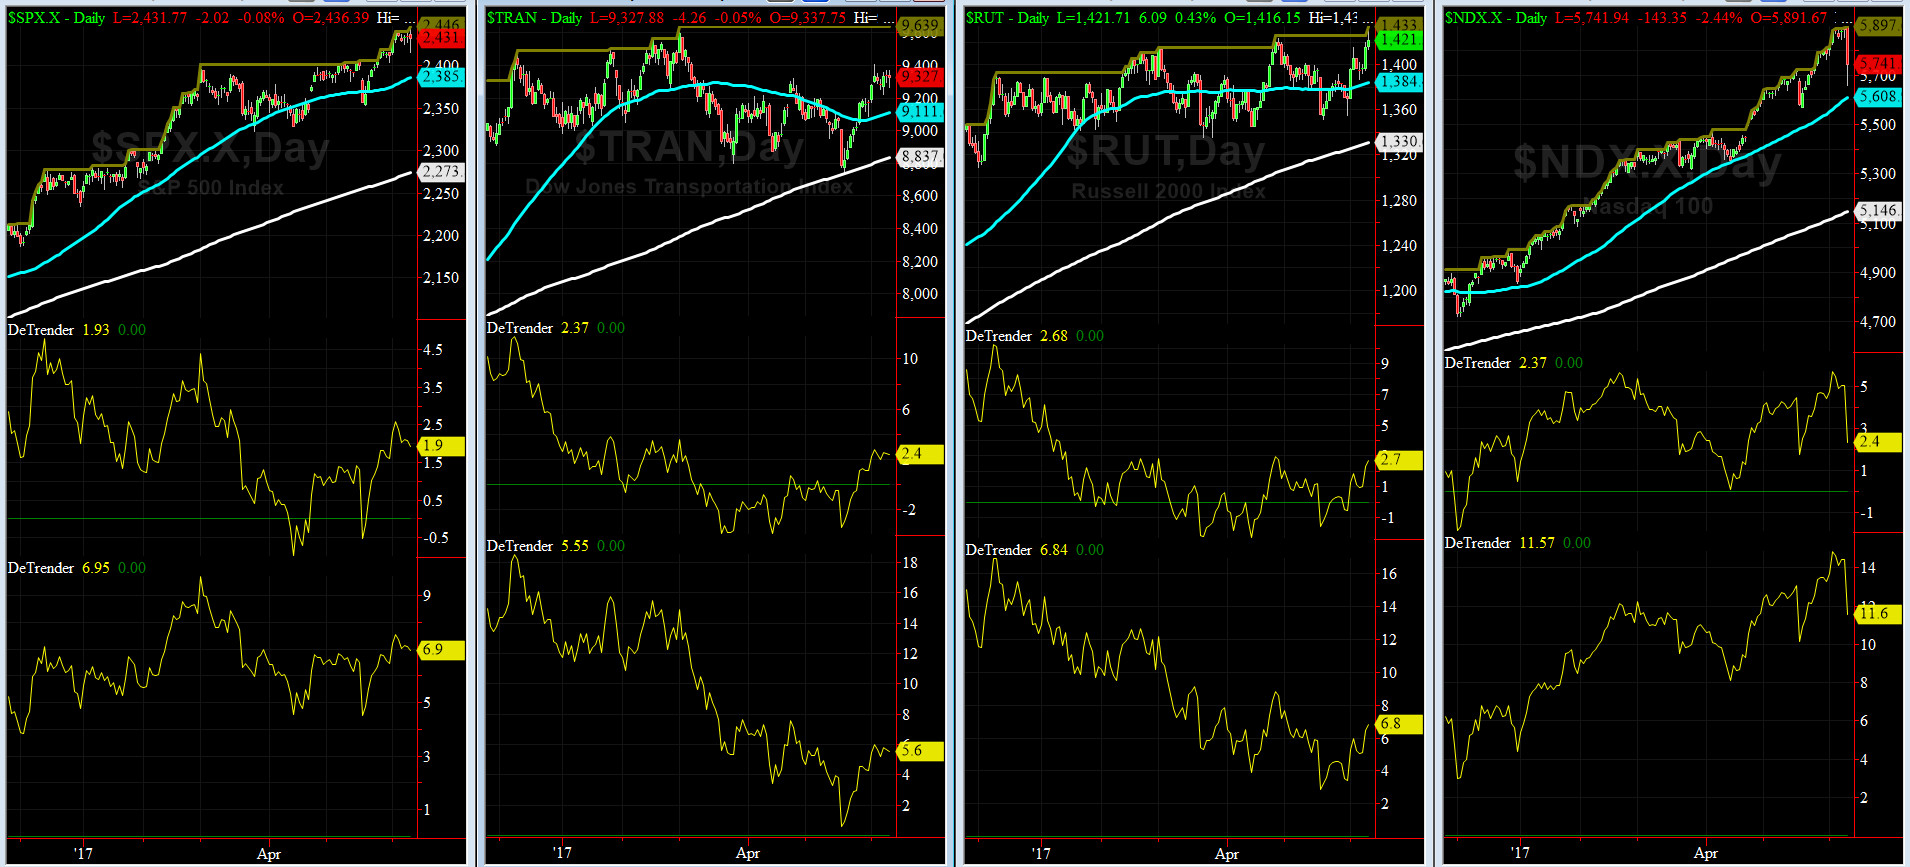
DeTrenders Charts for SPX, NDX, TRAN & RUT Indices
50-Day MA SPX = 2385 or 1.9% below SPX closed on Friday (max observed in last 5 yrs = +8.6%, min = -9.3%)
200-Day MA SPX = 2273 or 6.9% below SPX (max observed in last 5 yrs = 15.2%, min = -14%)
ALL of our EIGHT DeTrenders are POSITIVE for 3rd week in a row. The DeTrenders for DJ Tran & RUT will continue to be harbingers of future price behavior in broad indices.
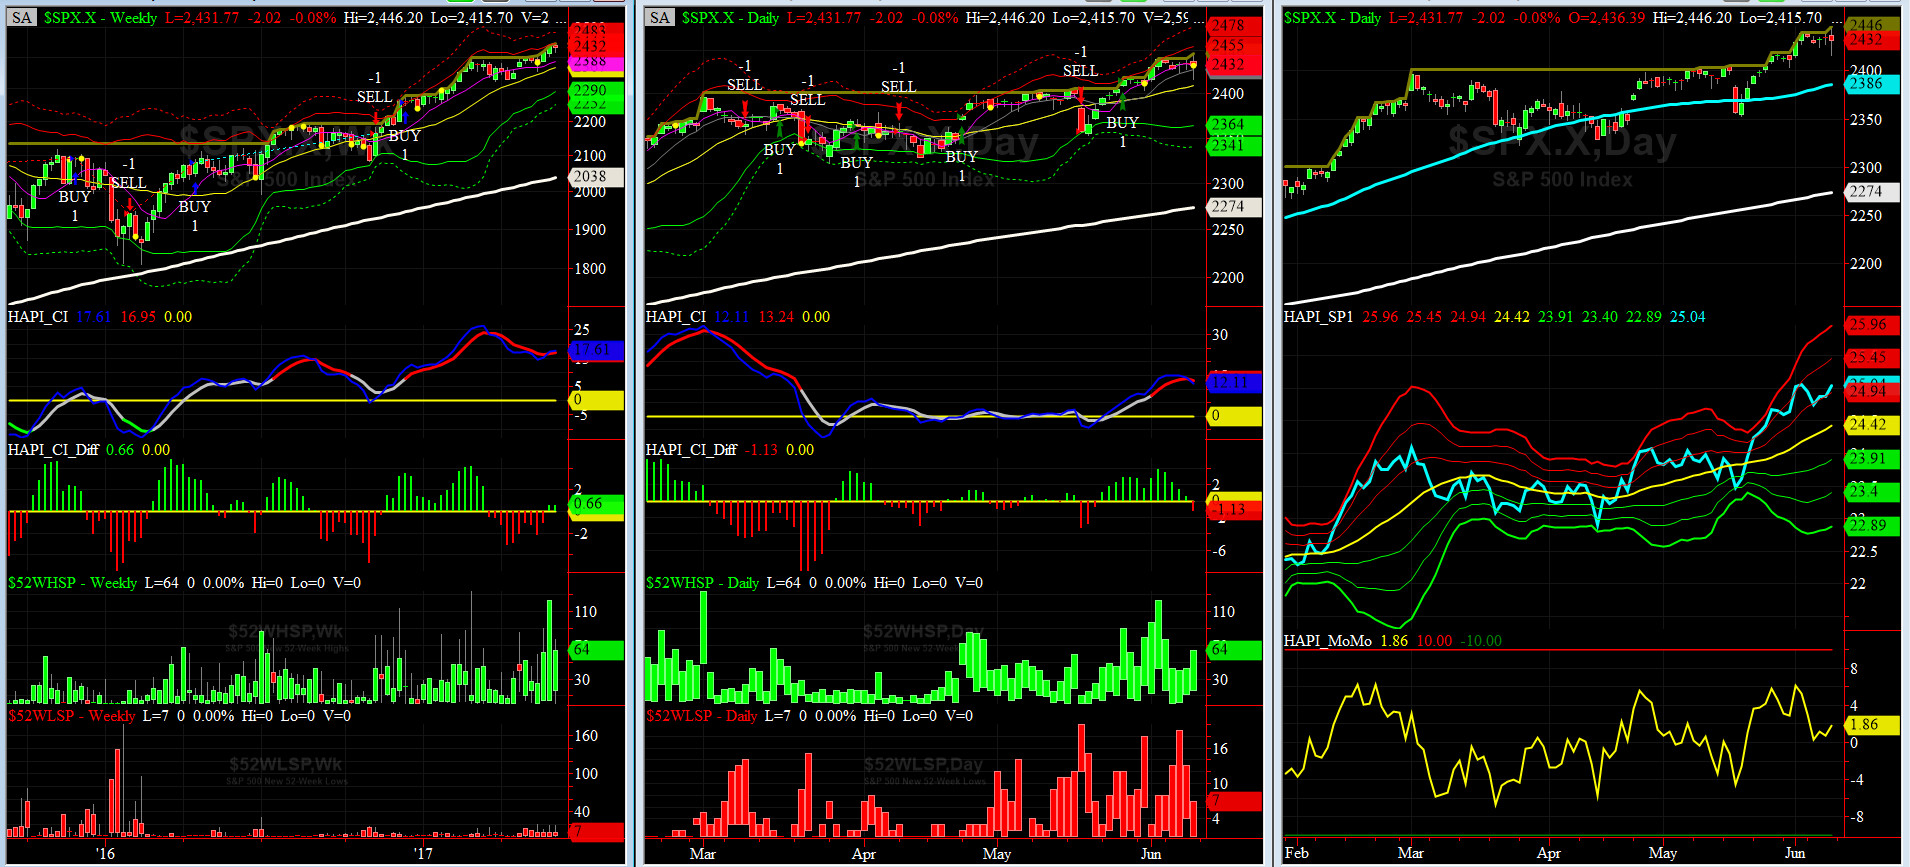
HA_SP1_Momo Chart
WEEKLY Timing Model = on a BUY Signal since Friday 12/16/16 CLOSE at 2258
DAILY Timing Model = on a BUY Signal since Thursday 5/25/17 CLOSE at 2357
Max SPX 52wk-highs reading last week = 77 (over 120-140, the local maxima is in)
Max SPX 52wk-Lows reading last week = 19 (over 40-60, the local minima is in)
HA_SP1 at just above its +1 sigma channels
HA_Momo = +1.7 (reversals most likely occur above +10 or below -10)

Vol of the Vols Chart
VIX currently stands at 10.7, or just at its zero sigma ( remember it's the VIX volatility pattern ( its sigma channels) that matters, and not the level of VIX itself ( this is per Dr. Robert Whaley, a great mentor and inventor of original VIX, now called VXO ). VIX usually peaks around a test of its +4 sigma).
Vol Indices remained fairly quiet for most of this past week. But on Friday, we saw an decent size spike in NASDAQ Vol, VXN, to +3 sigma while I was away at an appointment (I left you all home alone... again....LOL). what is key to watch for is whether we will see more of [this] shockwave or is this just another one day wonder.
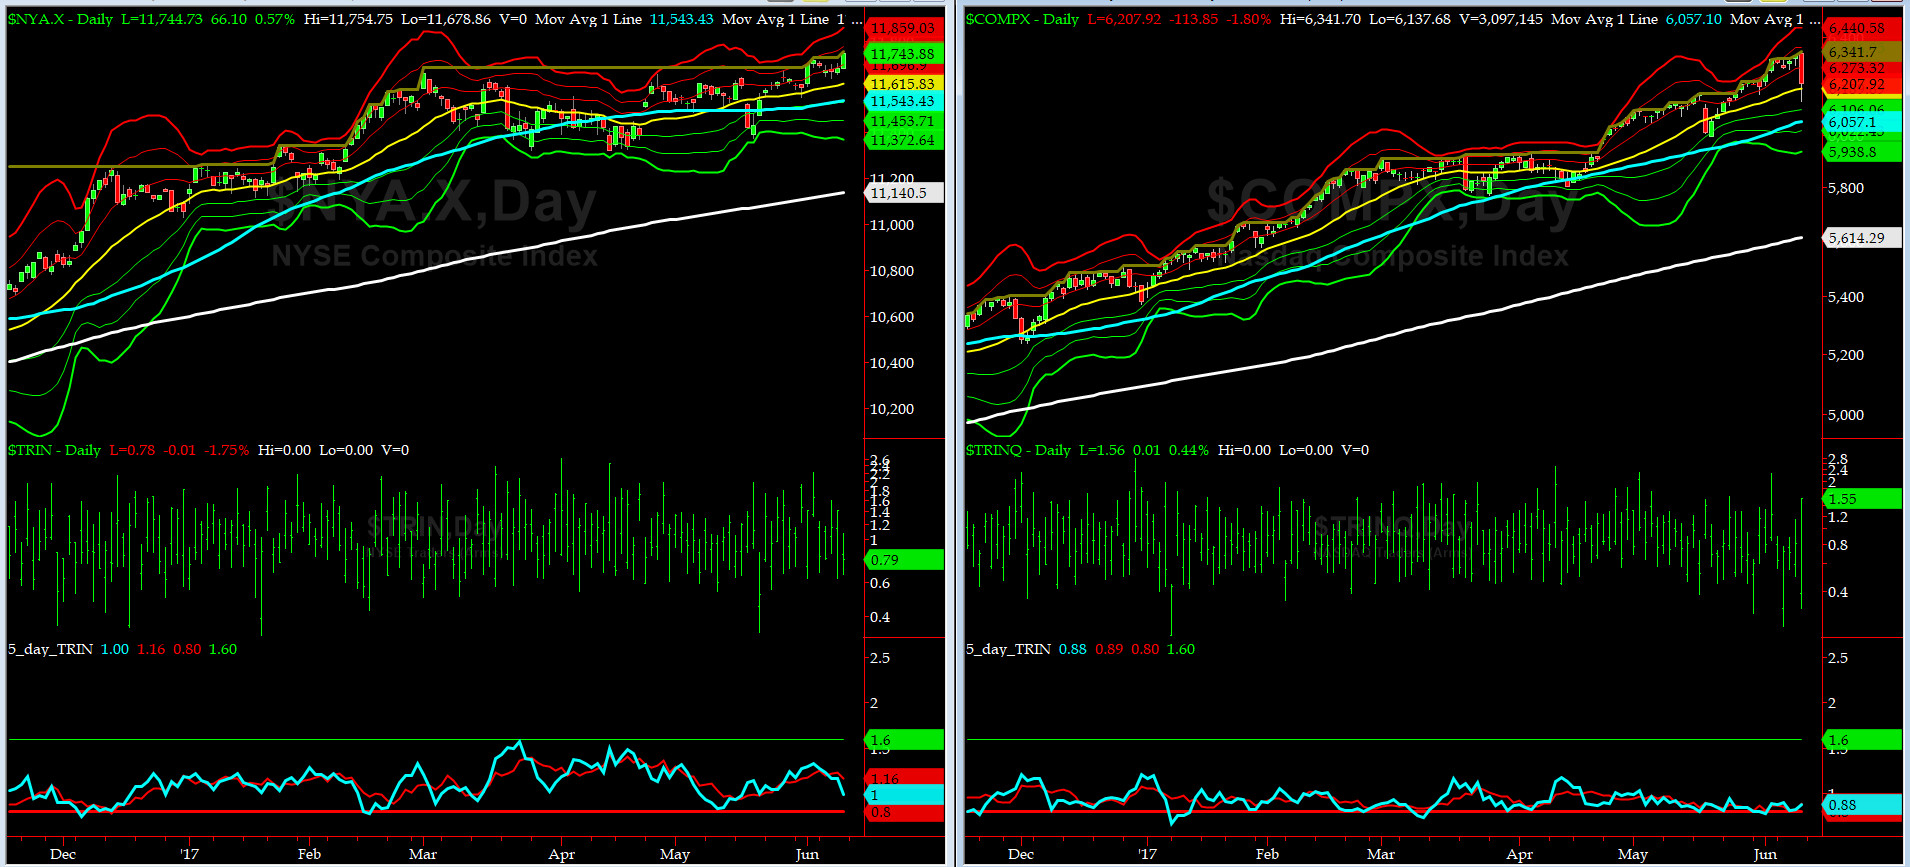
5-day TRIN & TRINQ Charts
NYSE 5-day TRIN is heading into the SELL zone while the NASDAQ 5-day TRINQ remains very near a SELL signal.
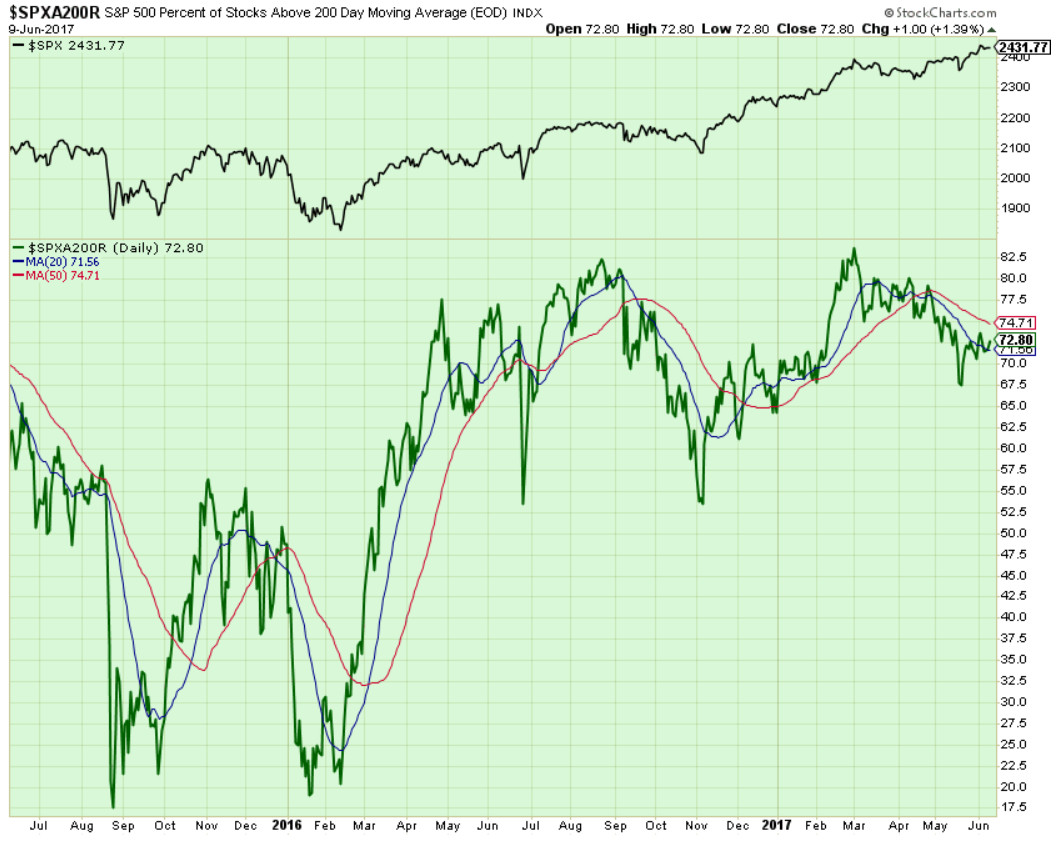
Components of SPX above their respective 200day MA Chart
This scoring indicator stayed relatively dormant this past week. Strong divergence with SPX continued further. We shall keep an eye on this chart after each close.
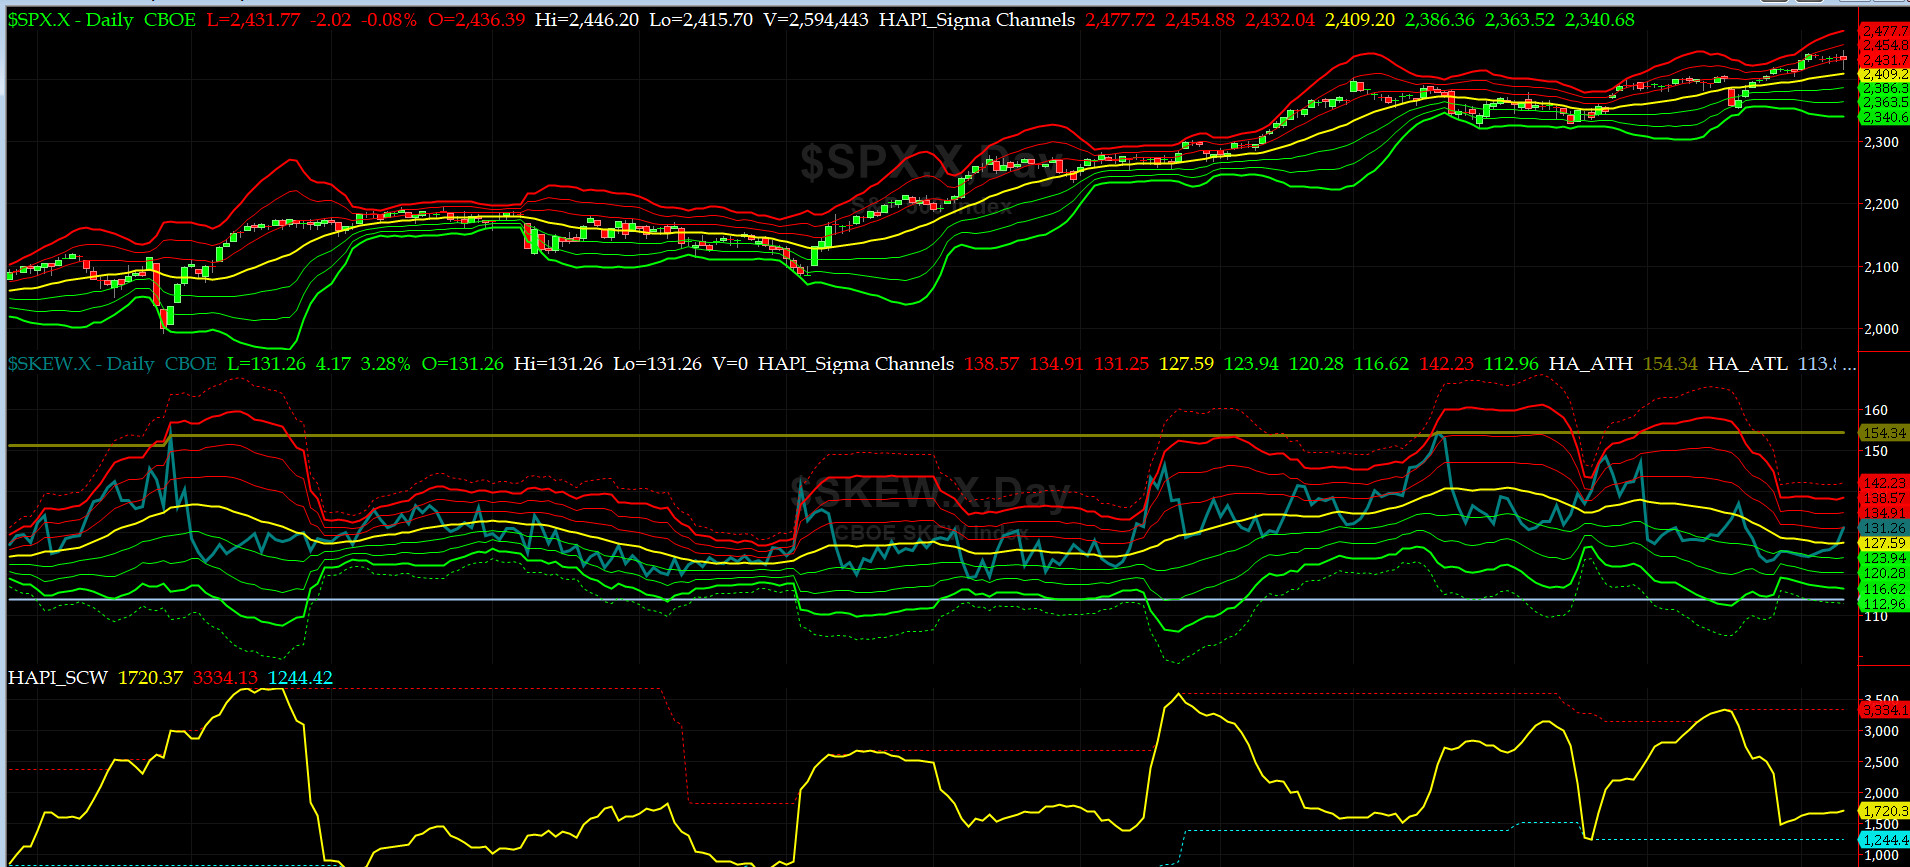
SPX SKEW (Tail Risk) Chart
Last week SPX SKEW (Tail Risk) rose to 131 near its +1 sigma (normal = 120-125, range 100-150).
Is all quiet on the Eastern & Mid-Western Fronts? Large market participants (BLUE TEAM) slowly have begun to think NO. Interesting times are ahead, ioho.
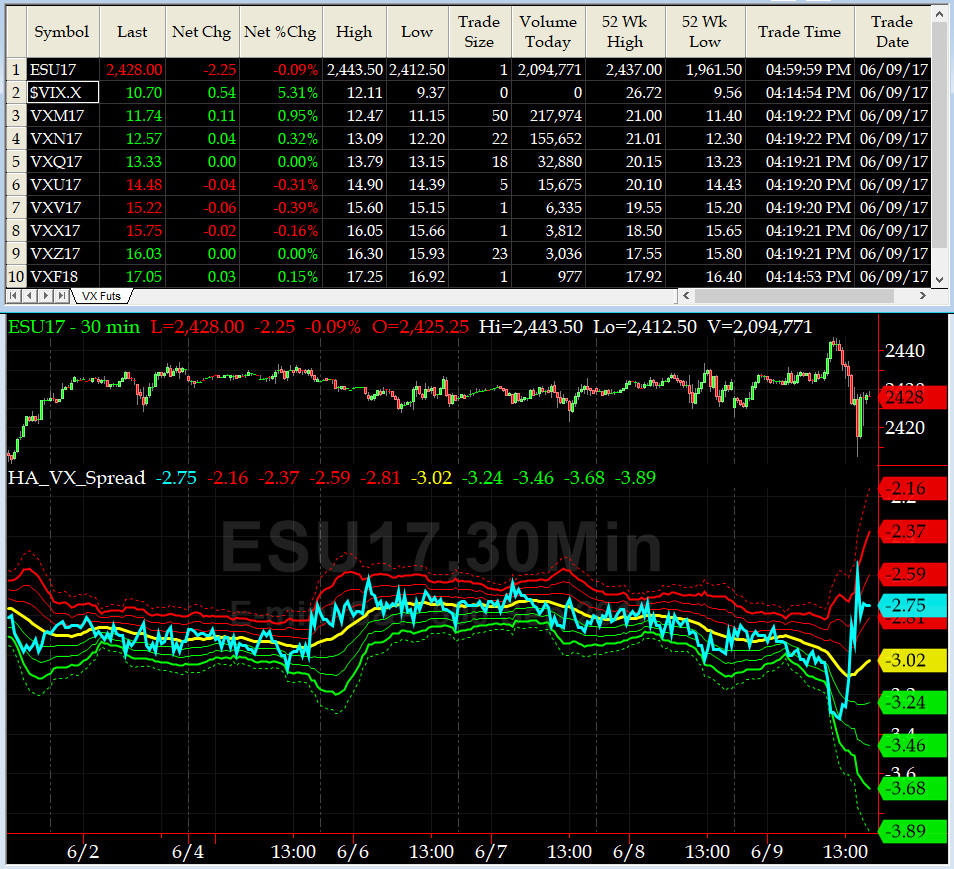
3-month VIX Futures Spread(VX) Chart
Our VX Spread traded sharply higher on Friday peaking around -2.5. No signal here. Next Friday, we roll this spread to LONG JULY SHORT OCT.
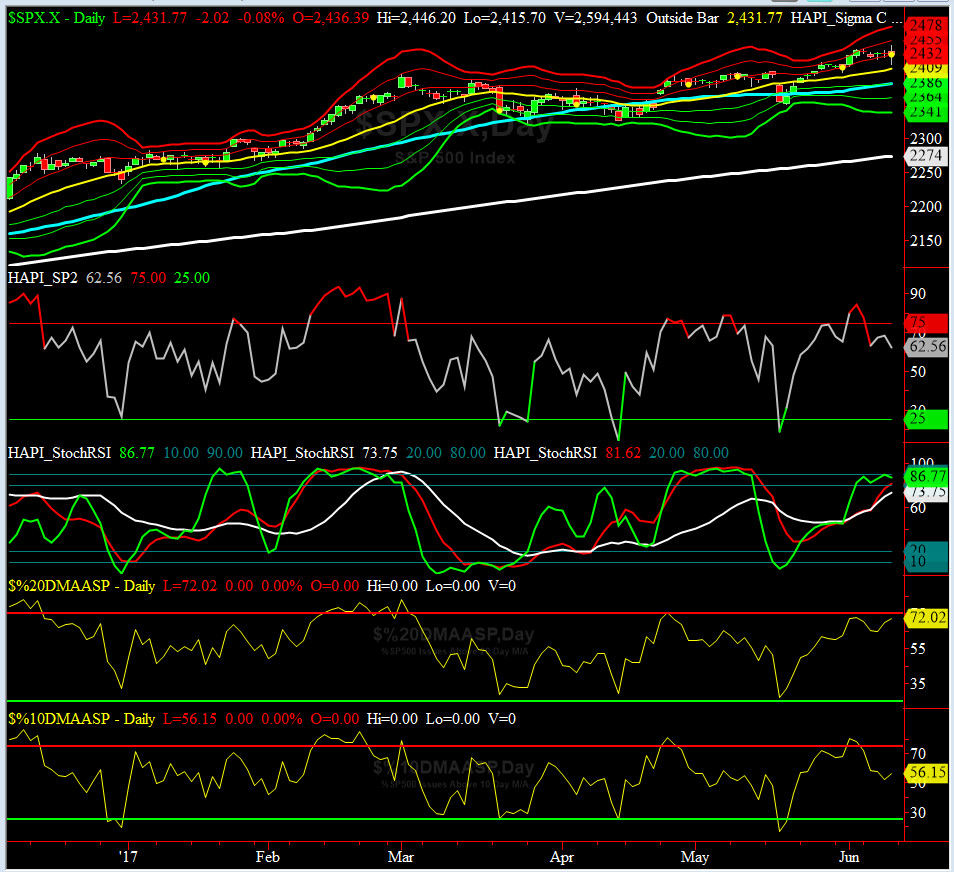
HA_SP2 Chart
HA_SP2 = 62.5 (Buy signal <= 25, Sell Signal >= 75)
We are no longer OVERBOUGHT. Will the markets continue to sell off here? Who knows. This week is key.
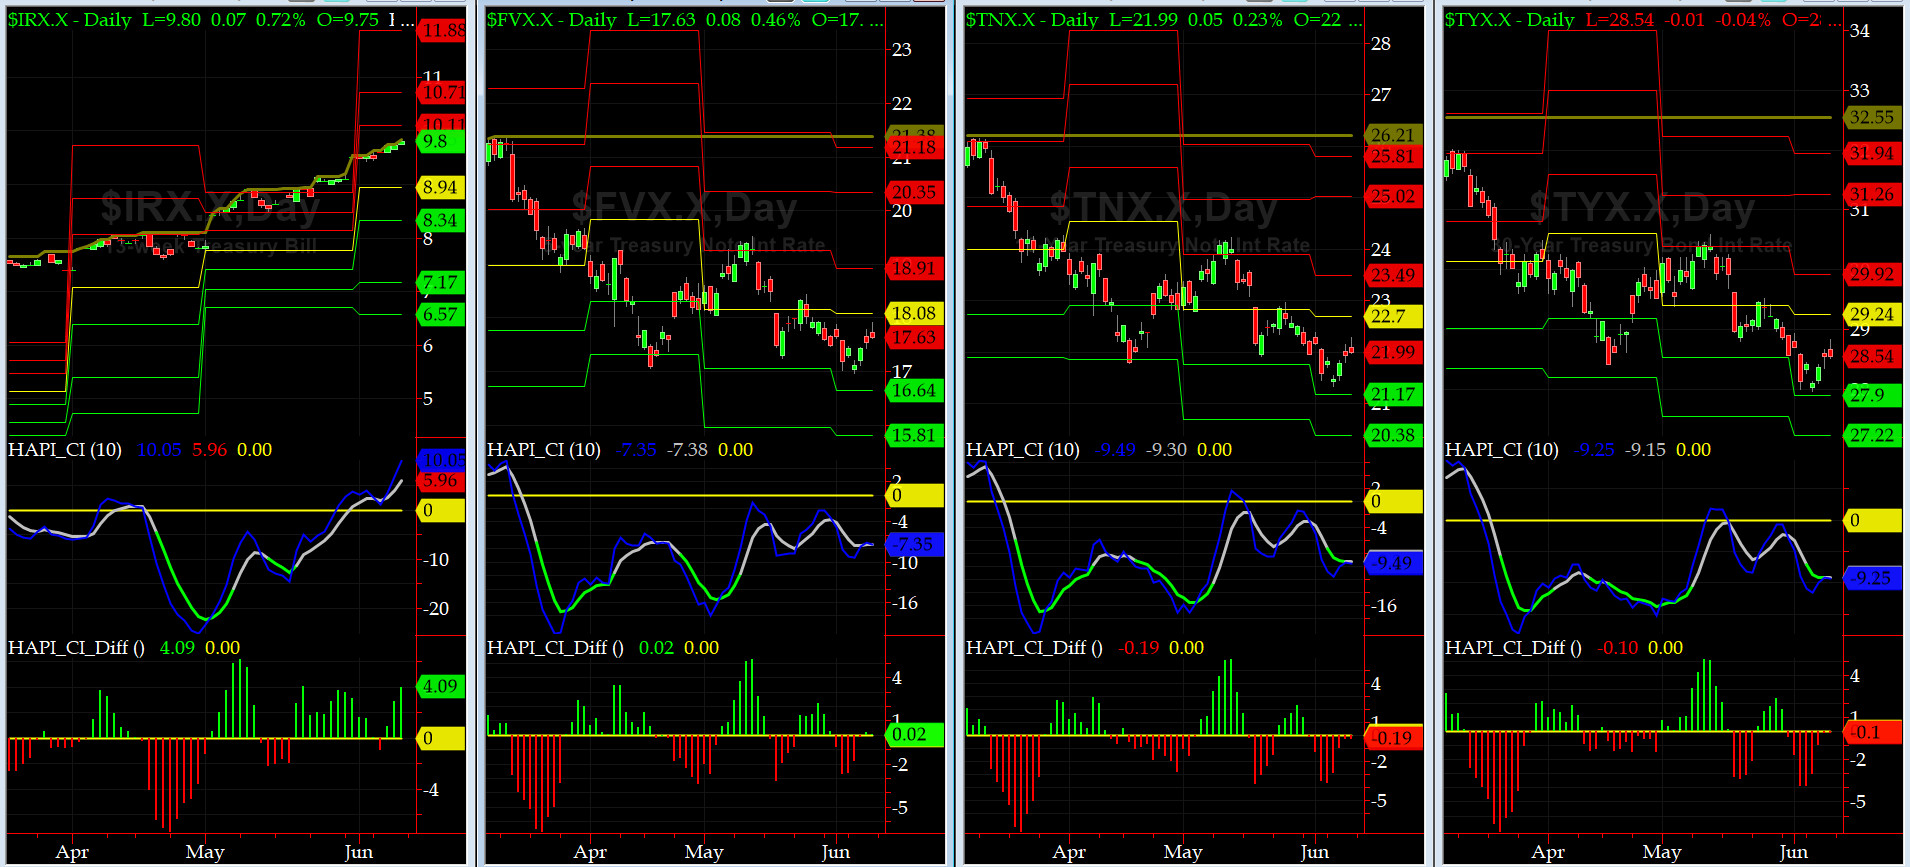
US Treasury T-Notes & T-Bonds Yields Chart
We saw more flight-to-safety trades this week (UK Vote and Comey Testimony) on the long end (YTMs went down) while the front end rose (EBY).
Fari Hamzei
|


 Proactive Market Timing