|
Sunday, June 25, 2017, 1945ET
Market Timing Charts, Analysis & Commentary for Issue #198
Timer Charts of S&P-500 Cash Index (SPX) + NASDAQ-100 Cash Index (NDX)
Most recent S&P-500 Cash Index (SPX): 2438.30 up +5.15 (up +0.21%) for the week ending Friday, June 23, 2017, which closed near its +1 sigma.
SPX ALL TIME INTRADAY HIGH = 2453.82 (reached on Monday, June 19, 2017)
SPX ALL TIME CLOSING HIGH = 2453.46 (reached on Monday, June 19, 2017)
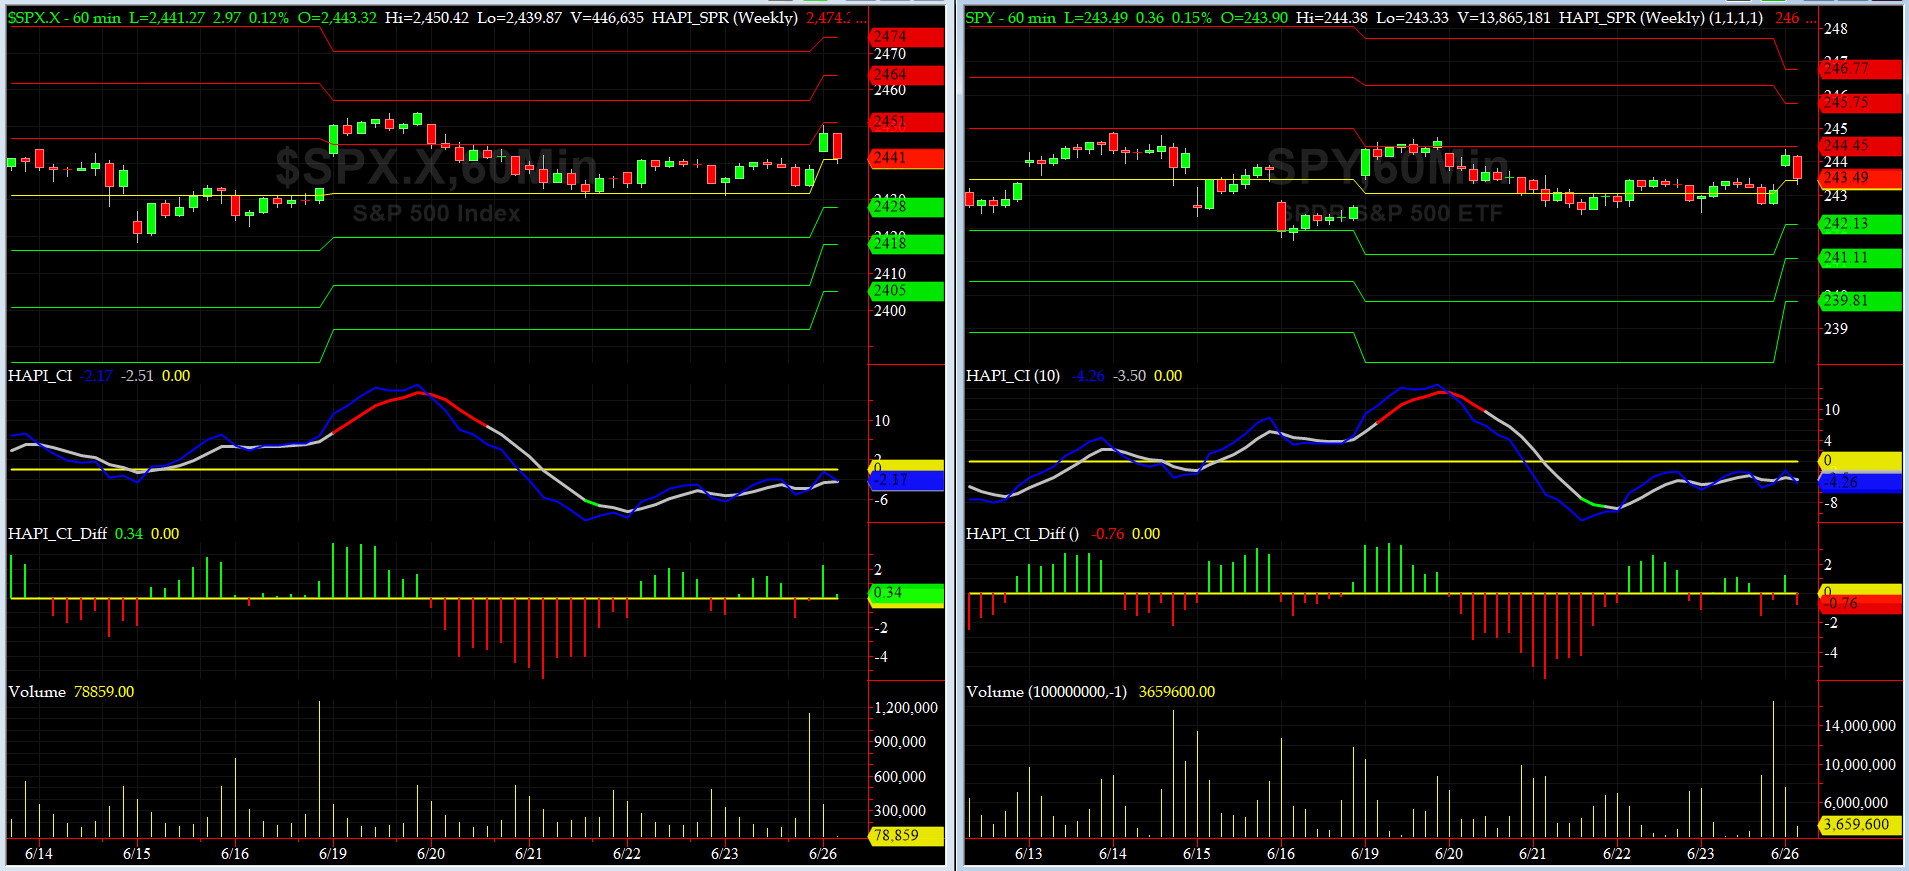
Current DAILY +2 Sigma SPX = 2451 with WEEKLY +2 Sigma = 2452
Current DAILY 0 Sigma (20 day MA) SPX = 2432 with WEEKLY 0 Sigma = 2381
Current DAILY -2 Sigma SPX = 2413 with WEEKLY -2 Sigma = 2310
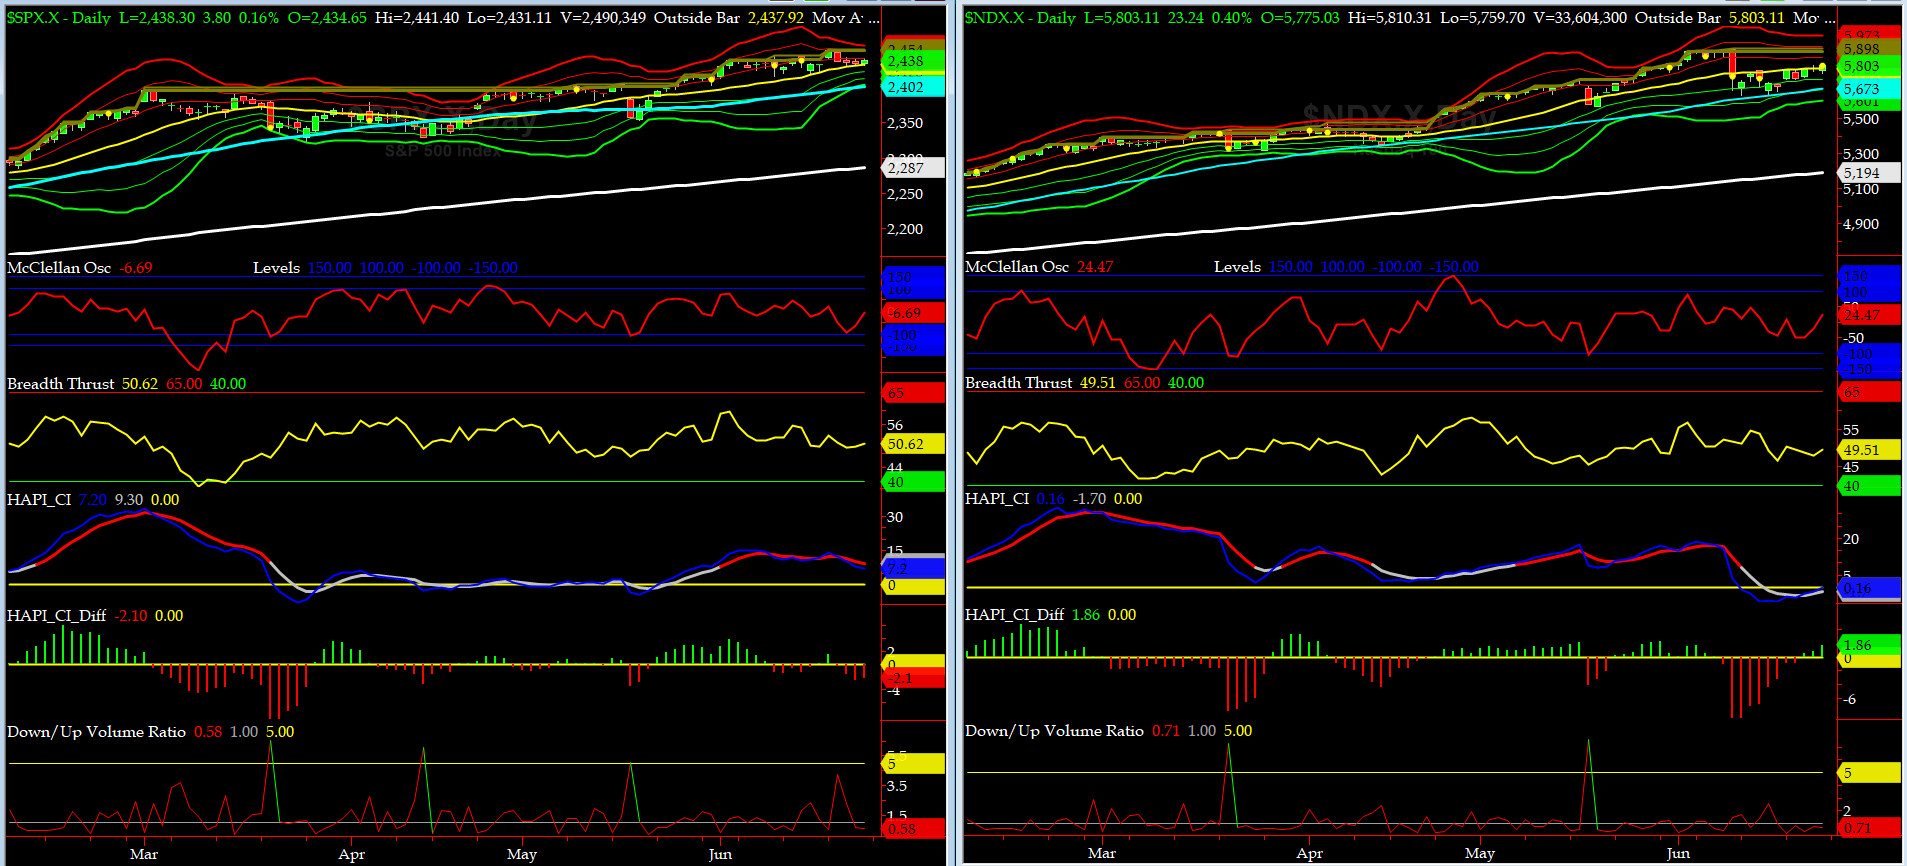
NYSE McClellan Oscillator = -6.7 (-150 is start of the O/S area; around -275 to -300 area or lower, we go into the �launch-pad� mode, over +150, we are in O/B area)
NYSE Breadth Thrust = 50.6 (40 is considered as oversold and 65 as overbought)
The Teflon Presidency of Grumpie continues till our markets wake up to his missteps, and then, we will all have only a few exit doors.
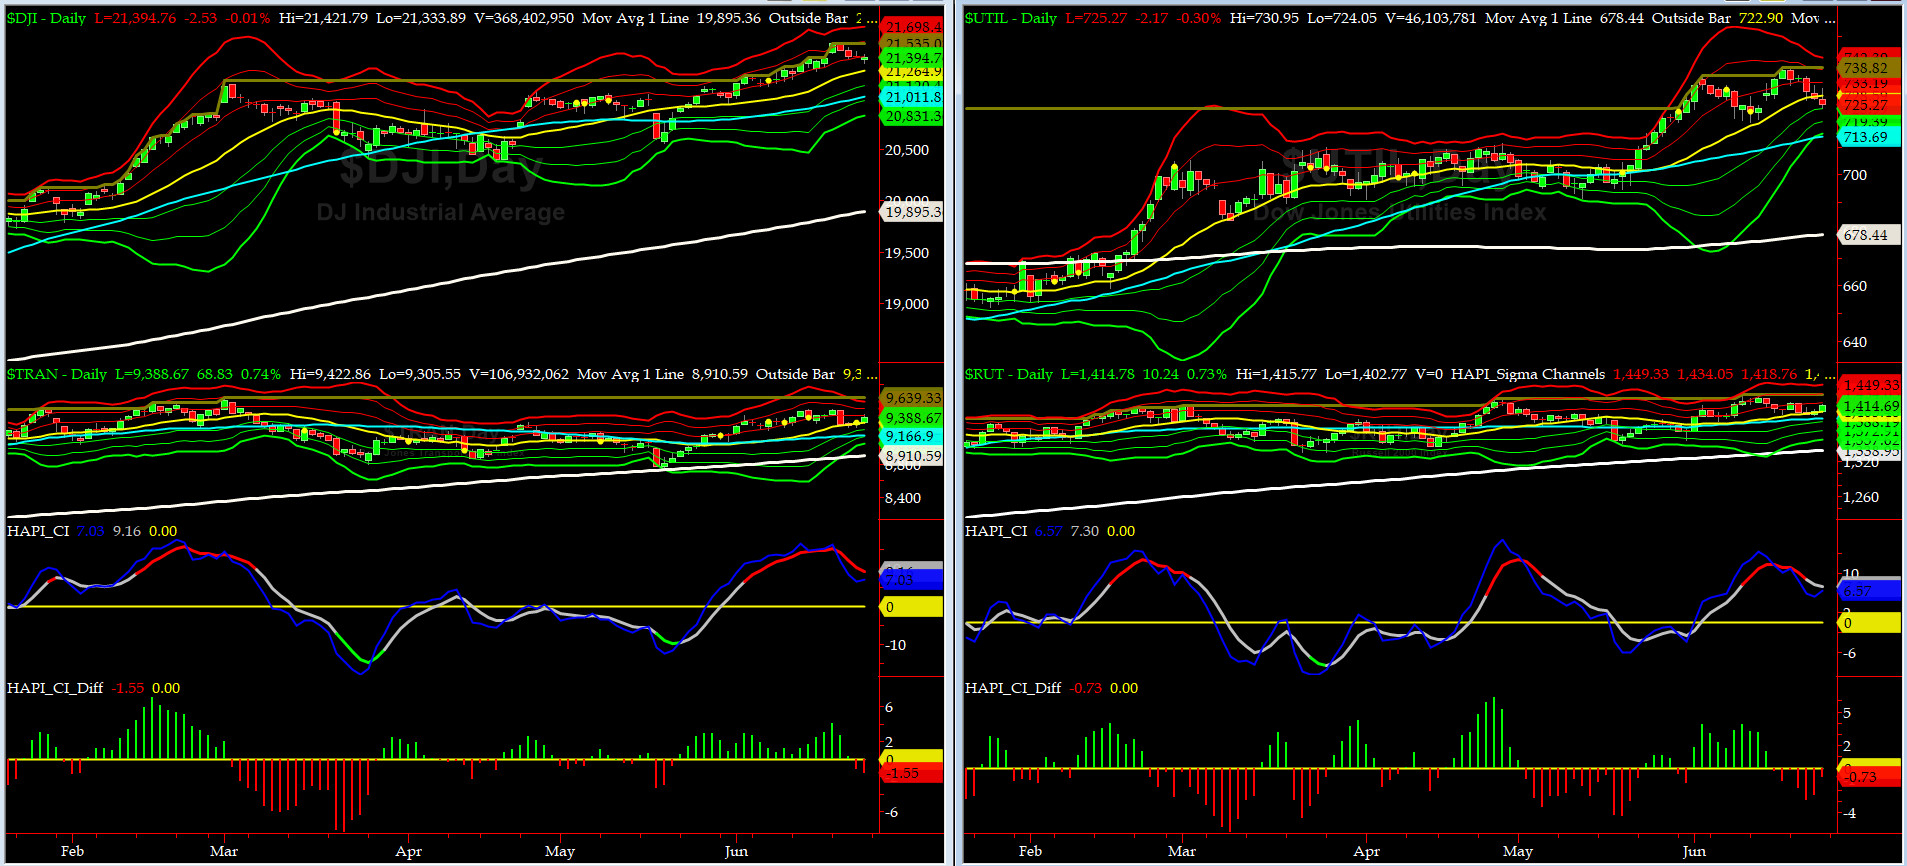
Canaries [in the Coal Mine] Chart for DJ TRAN & RUT Indices
200-Day MA DJ TRAN = 8910 or 5.4% below DJ TRAN (max observed in last 5 yrs = 20.2%, min = -20.3%)
200-Day MA RUT = 1338 or 5.7% below RUT (max observed in last 5 yrs = 21.3%, min = -22.6%)
DJ Transportation Index (proxy for economic conditions 6 to 9 months hence) went nowhere fast during last week, but put in a lower high.
Russell 2000 Small Caps Index (proxy for Risk ON/OFF) was slightly higher for the week. RISK is still ON.
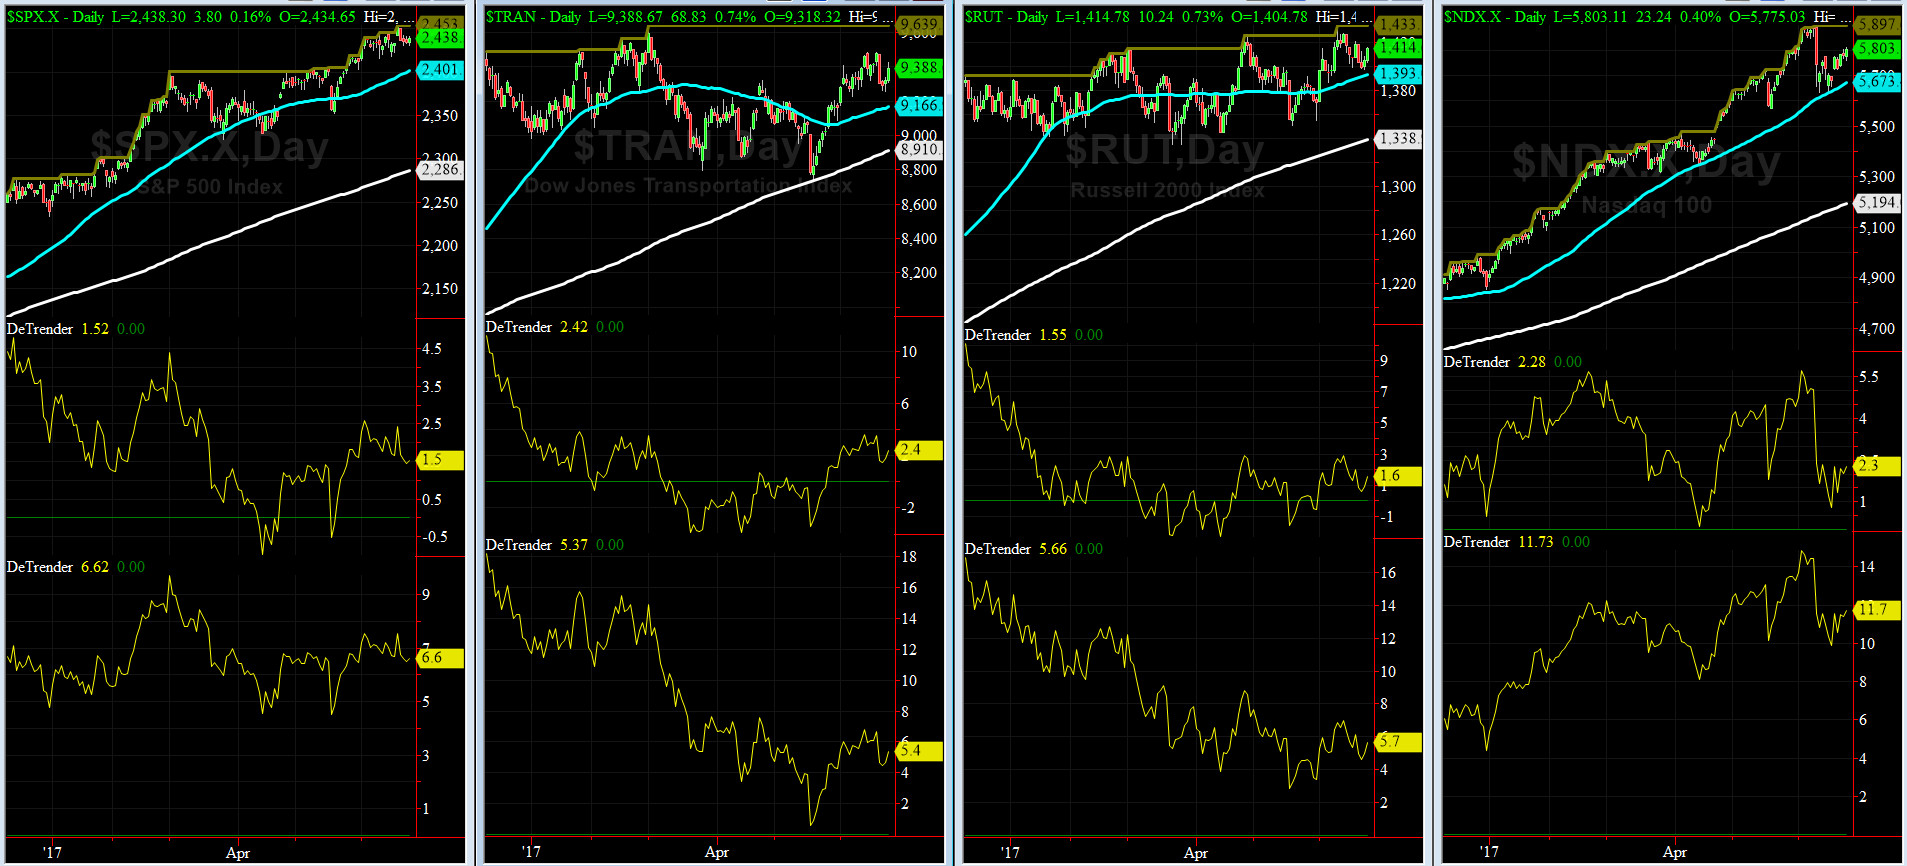
DeTrenders Charts for SPX, NDX, TRAN & RUT Indices
50-Day MA SPX = 2401 or 1.5% below SPX close of Friday (max observed in last 5 yrs = +8.6%, min = -9.3%)
200-Day MA SPX = 2286 or 6.6% below SPX (max observed in last 5 yrs = 15.2%, min = -14%)
ALL of our EIGHT DeTrenders are POSITIVE for 5th week in a row. The DeTrenders for DJ Tran & RUT will continue to be harbingers of future price behavior in broad indices.
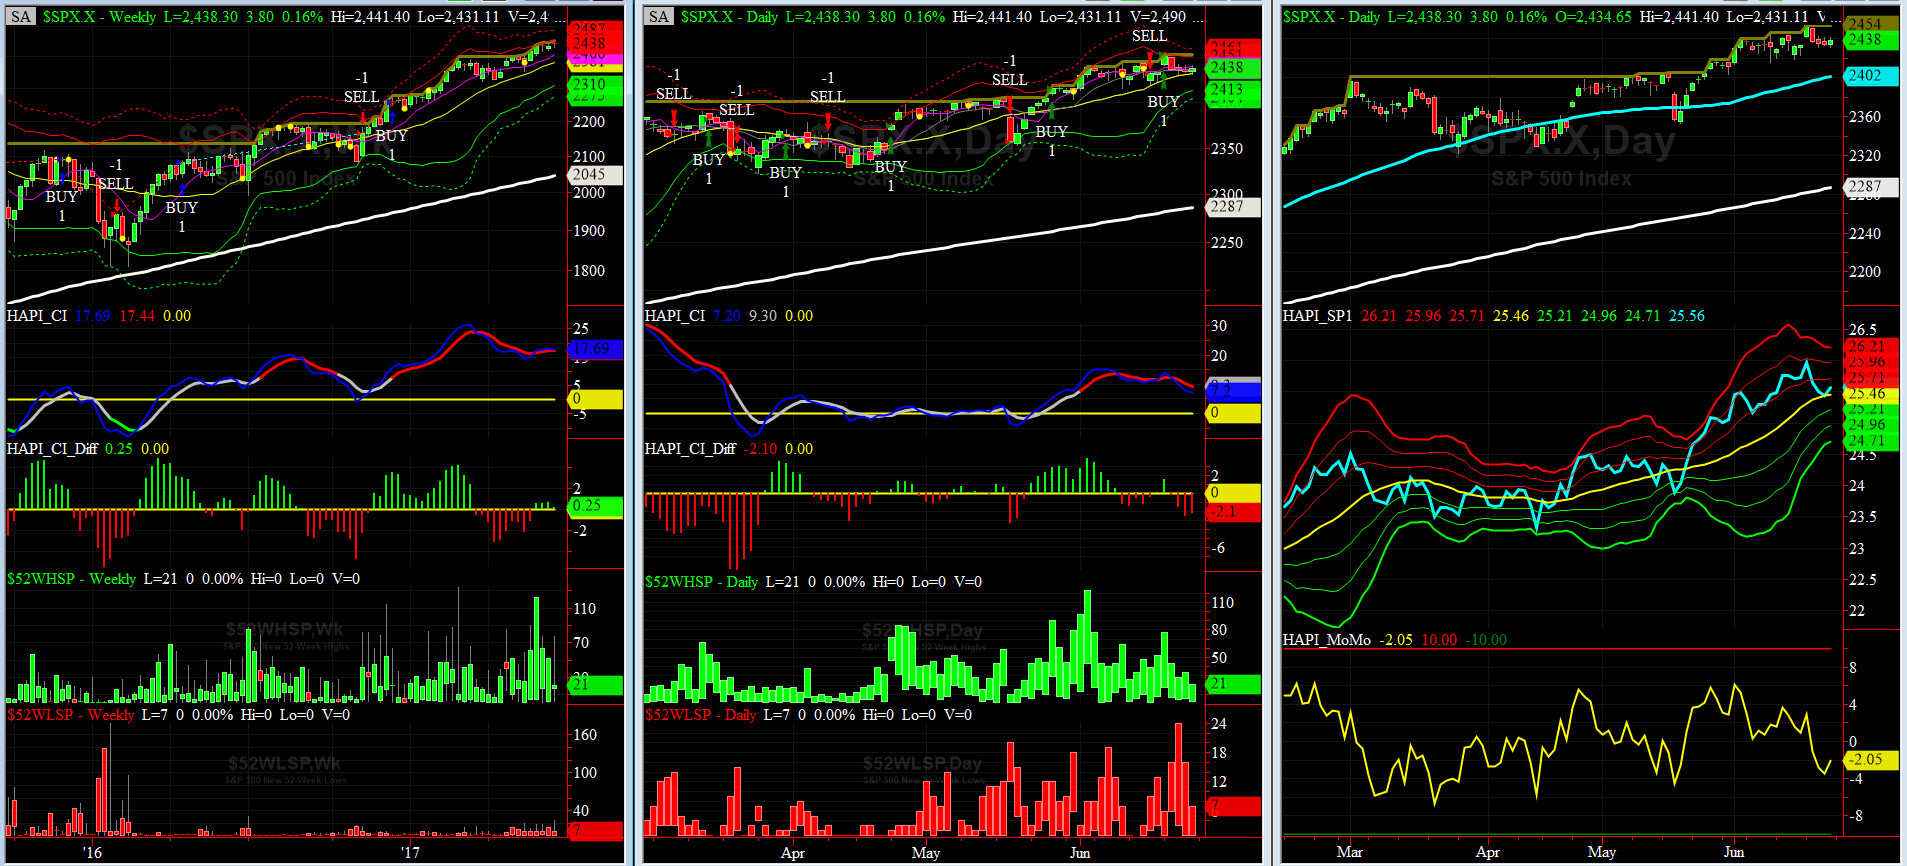
HA_SP1_Momo Chart
WEEKLY Timing Model = on a BUY Signal since Friday 12/16/16 CLOSE at 2258
DAILY Timing Model = on a BUY Signal since Monday 6/19/17 CLOSE at 2432
Max SPX 52wk-highs reading last week = 77 (over 120-140, the local maxima is in)
Max SPX 52wk-Lows reading last week = 24 (over 40-60, the local minima is in)
HA_SP1 closed at just above its zero sigma channels
HA_Momo = -2 (reversals most likely occur above +10 or below -10)

Vol of the Vols Chart
VIX currently stands at 10.02, or just at its -1 sigma (remember it's the VIX volatility pattern ( its sigma channels) that matters, and not the level of VIX itself ( this is per Dr. Robert Whaley, a great mentor and inventor of original VIX, now called VXO ). VIX usually peaks around a test of its +4 sigma).
Vol Indices remained fairly quiet for most of this past week. And again on Monday, we saw another drop in NASDAQ Vol, VXN, from +1 sigma to near its zero sigma on Monday.
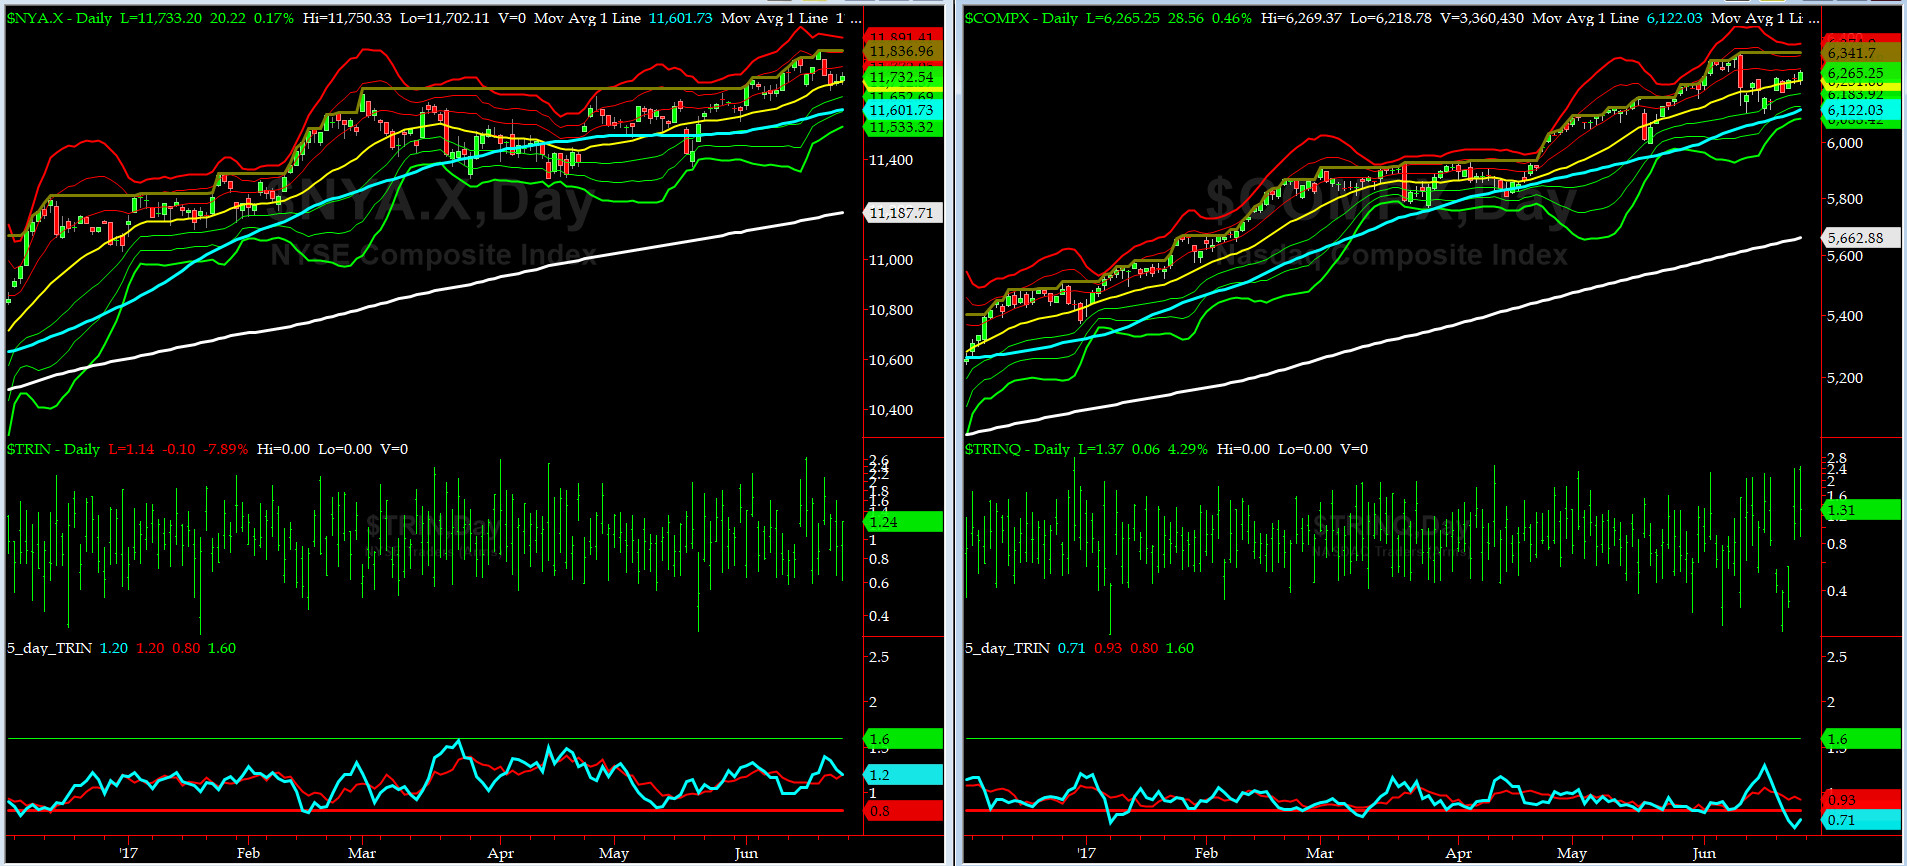
5-day TRIN & TRINQ Charts
NASDAQ 5-day TRIN says: SELL BABY SELL but no one is listening, at least not yet.
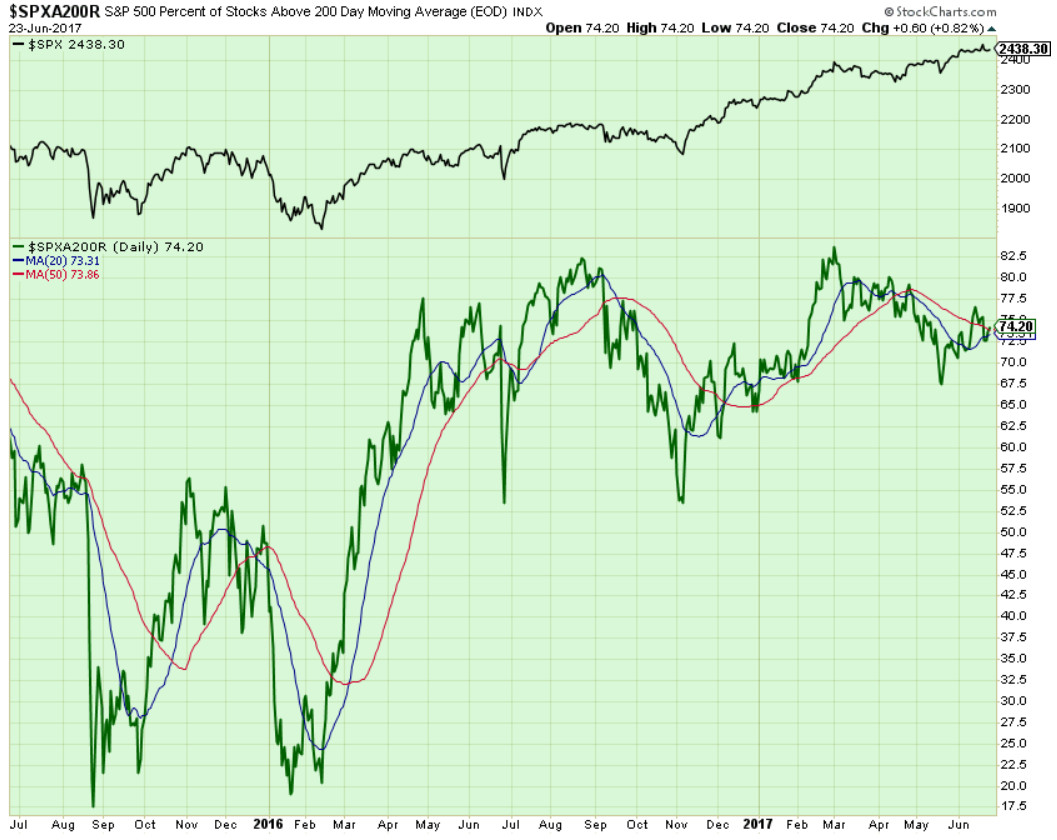
Components of SPX above their respective 200day MA Chart
This scoring indicator still having divergences with SPX. Typically, this pattern won't end nicely. We shall keep looking at this daily.
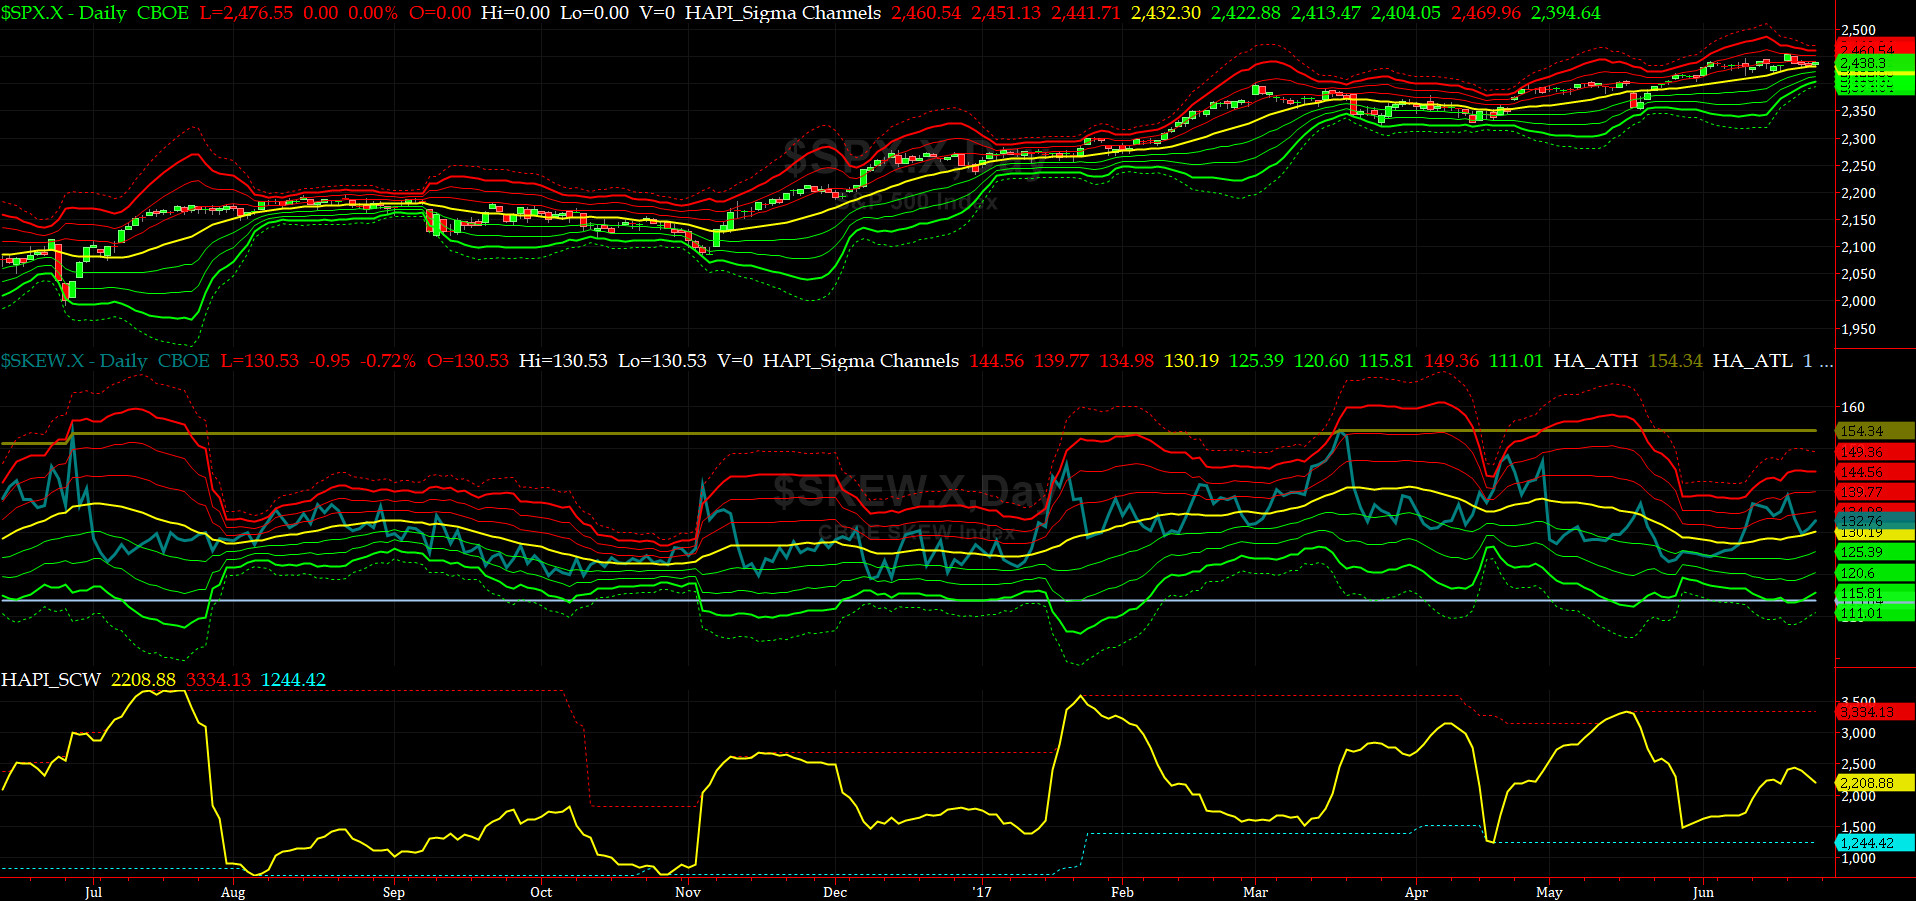
SPX SKEW (Tail Risk) Chart
Last week SPX SKEW (Tail Risk) rose to 139 near its +1 sigma before fallin back to to near its zero sigma (normal = 120-125, range 100-150).
Is all quiet on the Eastern & Mid-Western Fronts? Does anybody really care? (the group Chicago sings) as Party Hearty continues.
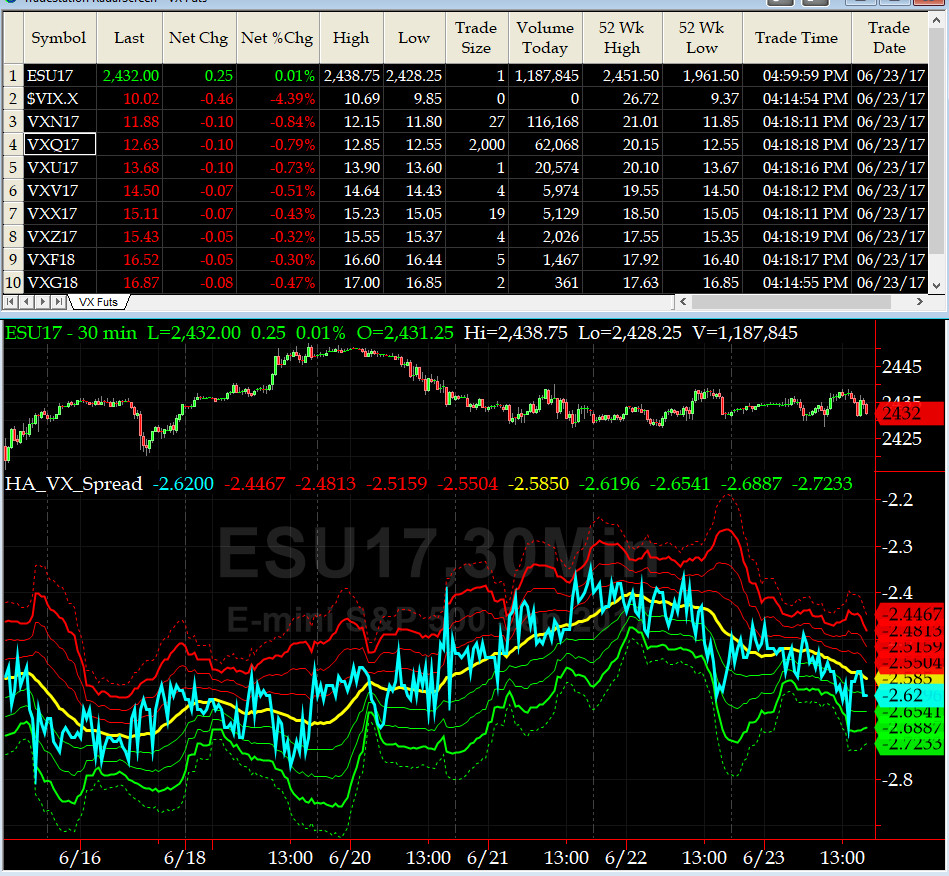
3-month VIX Futures Spread(VX) Chart
This indicator also went nowhere fast during the last week. No signal here, as of now.
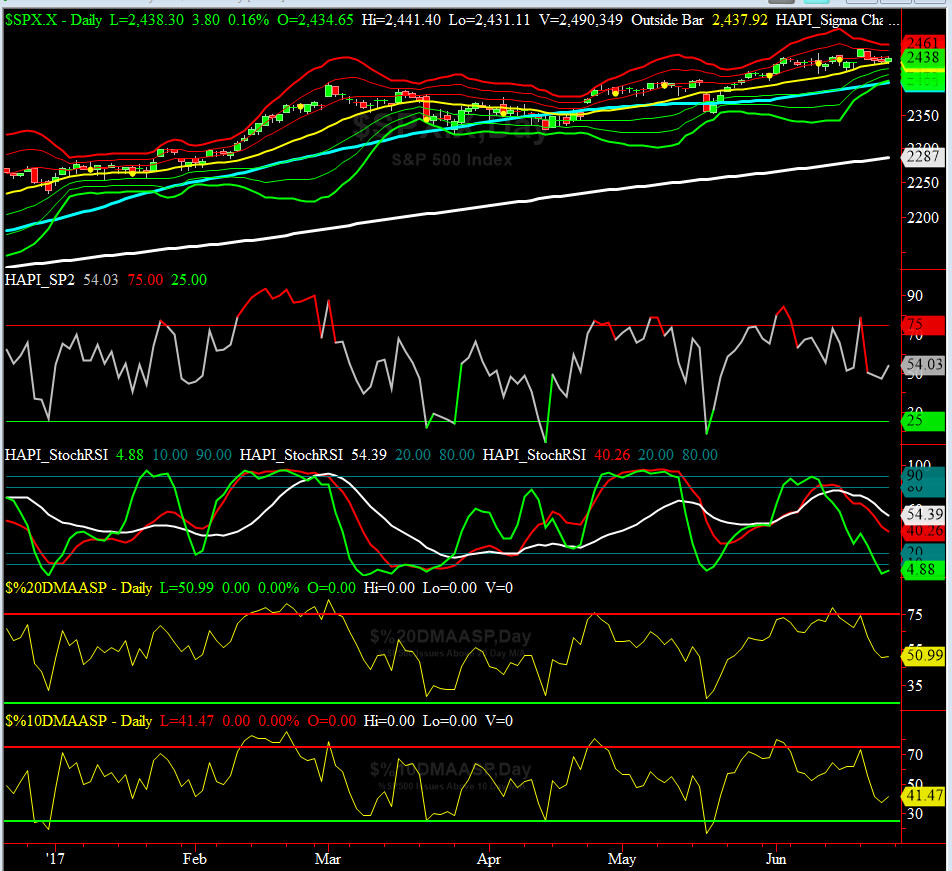
HA_SP2 Chart
HA_SP2 = 54 (Buy signal <= 25, Sell Signal >= 75)
We are in NEUTRAL zone again. More [Persian] Iced Tea? Our beloved XO, @Capt_Tiko, tells us: ubetcha (in Palingo).....
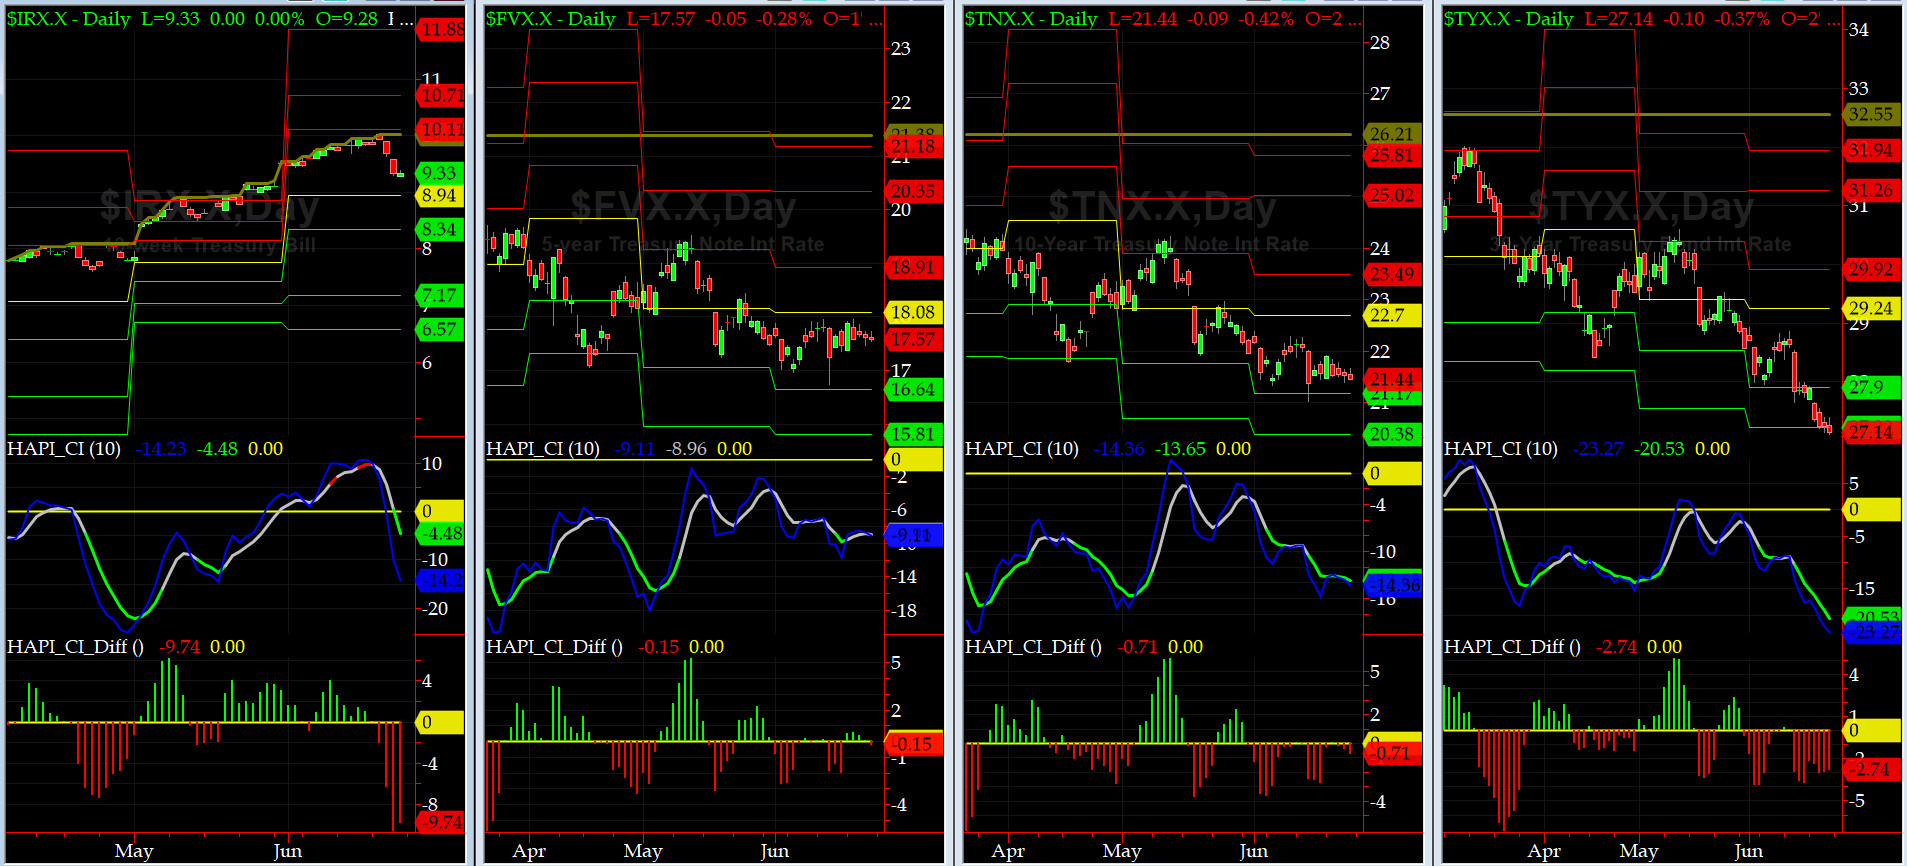
US Treasury T-Notes & T-Bonds Yields Chart
More flight-to-quality was seen this past week in the US Debt Markets (we sound like a broken record).
Fari Hamzei
|


 Proactive Market Timing