|
Saturday, July 8, 2017, 2000ET
Market Timing Charts, Analysis & Commentary for Issue #200
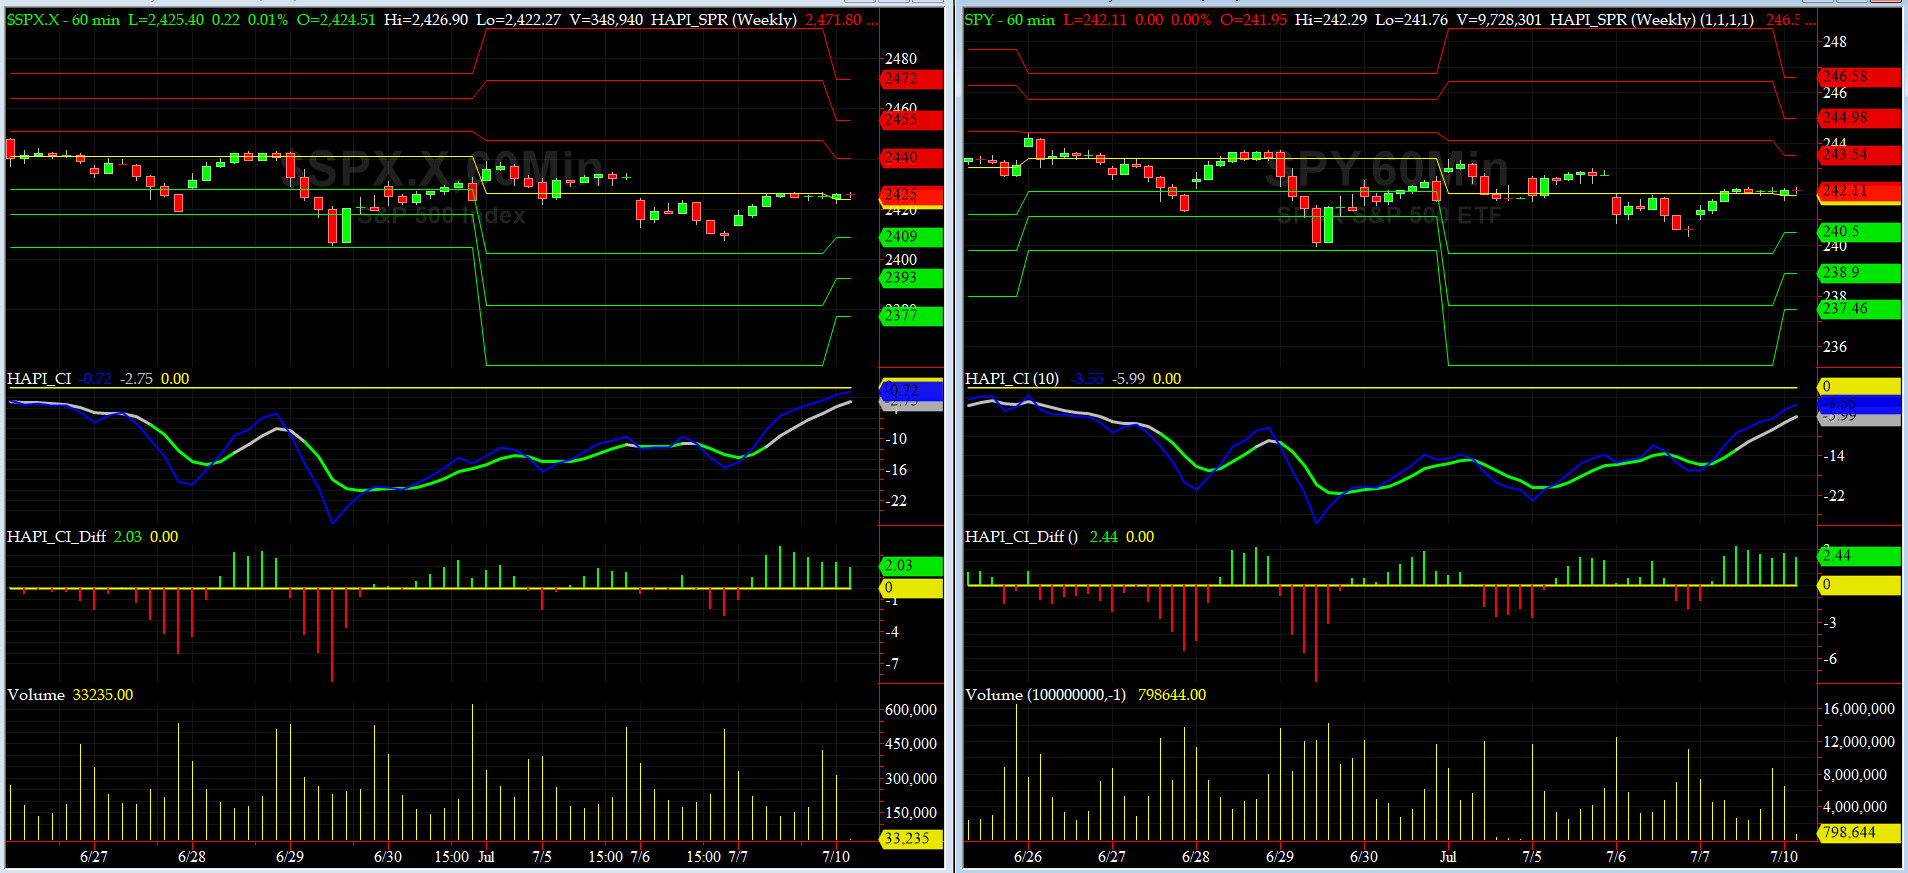
Timer Charts of S&P-500 Cash Index (SPX) + NASDAQ-100 Cash Index (NDX)
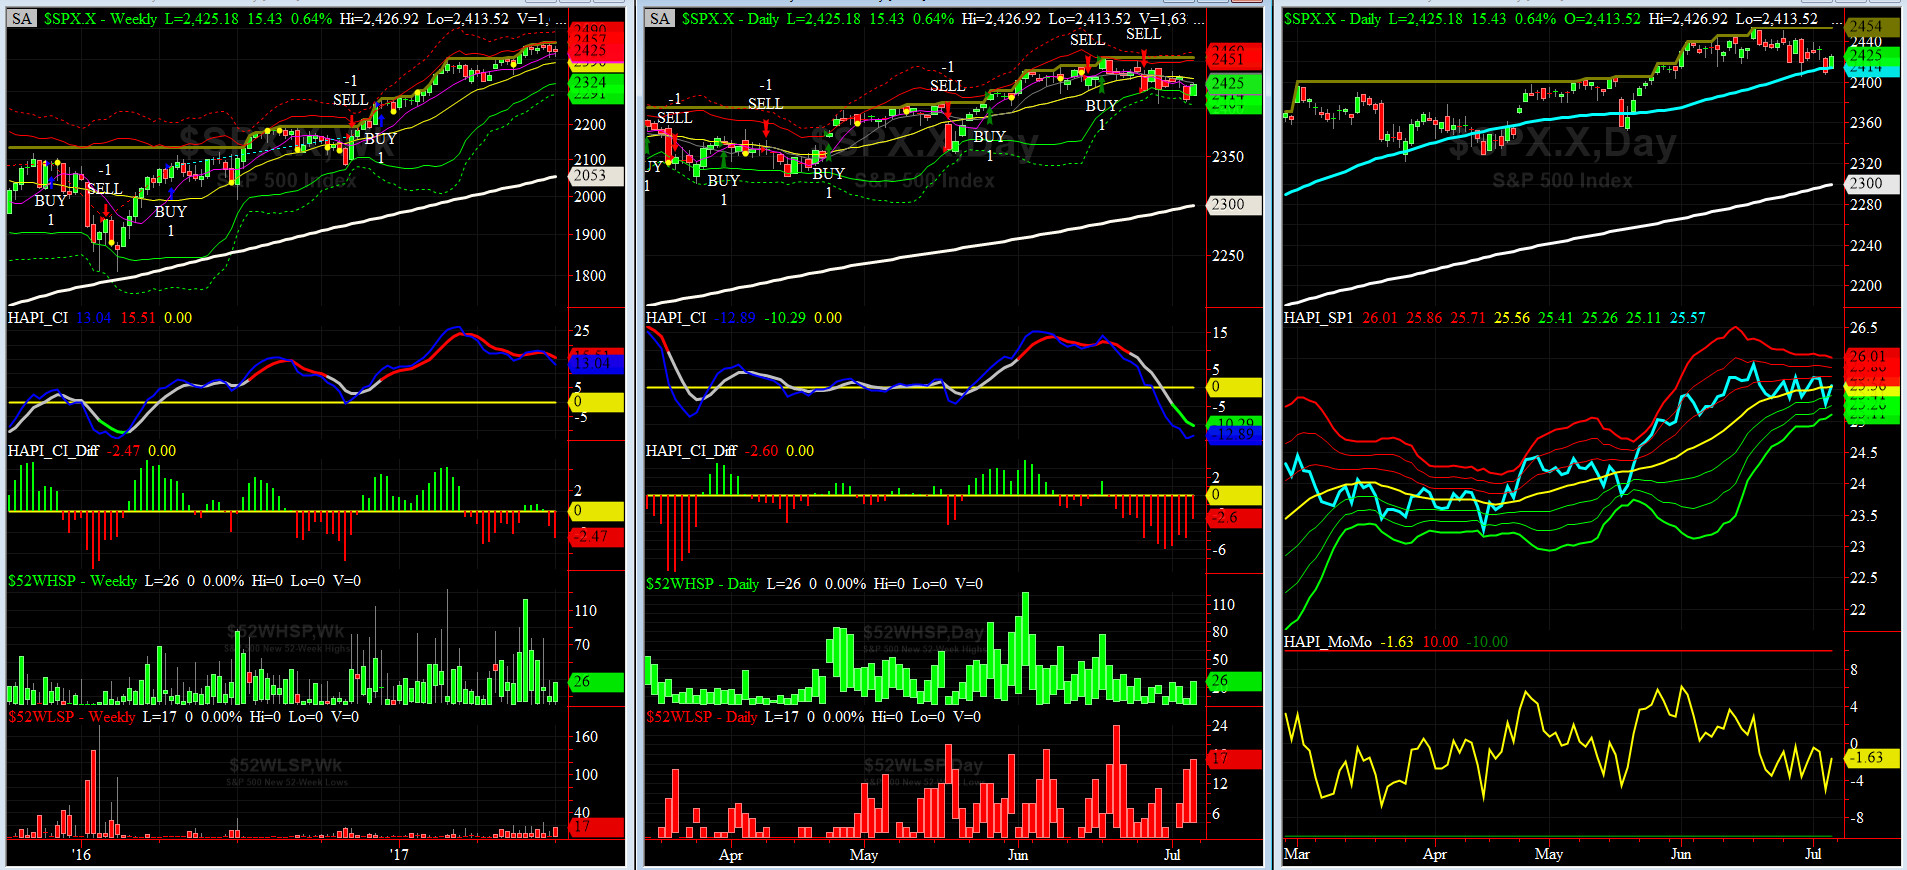
Most recent S&P-500 Cash Index (SPX): 2425.18 up +1.77 (up +0.07%) for the week ending Friday, July 7, 2017, which closed near its -1 sigma.
SPX ALL TIME INTRADAY HIGH = 2453.82 (reached on Monday, June 19, 2017)
SPX ALL TIME CLOSING HIGH = 2453.46 (reached on Monday, June 19, 2017)
Current DAILY +2 Sigma SPX = 2451 with WEEKLY +2 Sigma = 2457
Current DAILY 0 Sigma (20 day MA) SPX = 2432 with WEEKLY 0 Sigma = 2390
Current DAILY -2 Sigma SPX = 2414 with WEEKLY -2 Sigma = 2324
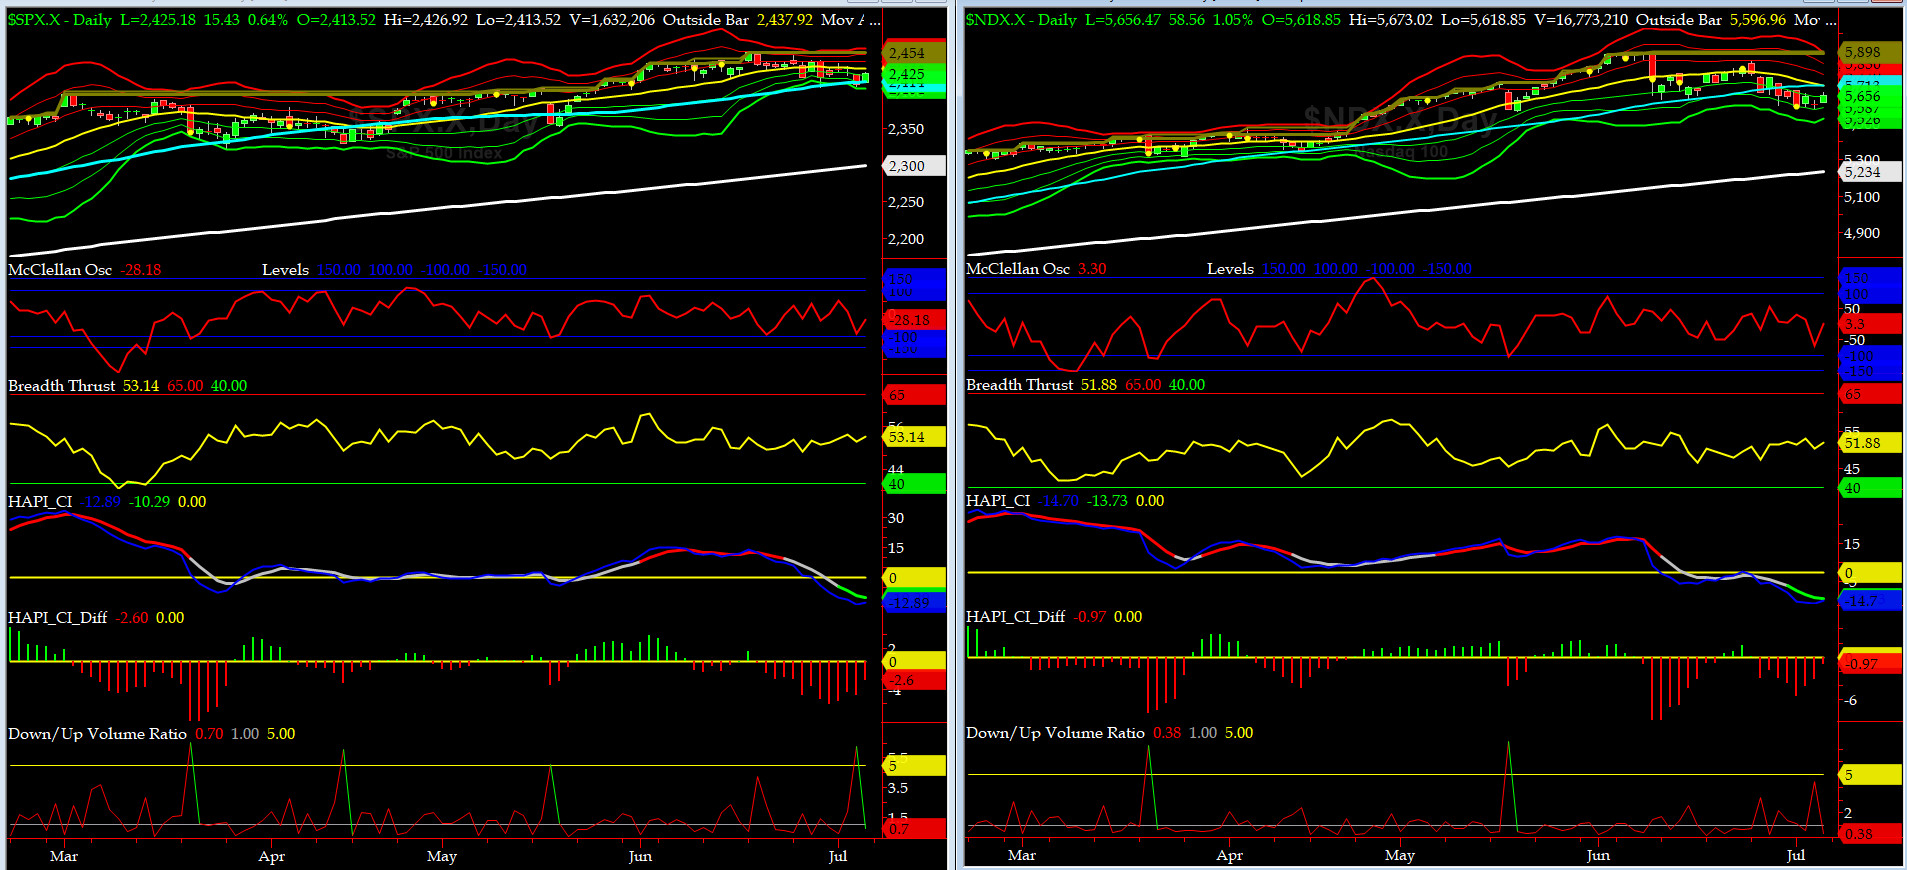
NYSE McClellan Oscillator = -28 (-150 is start of the O/S area; around -275 to -300 area or lower, we go into the �launch-pad� mode, over +150, we are in O/B area)
NYSE Breadth Thrust = 53.1 (40 is considered as oversold and 65 as overbought)
On Thursday, we may have witnessed a local minima (tradable low) and with a strong June NFP (plus positive prior month revisions), we are changing our bias ahead of Q2 Earnings Season. This is brought to a movie theater near you, courtesy of Don Grumpino. ROFLMTO!!
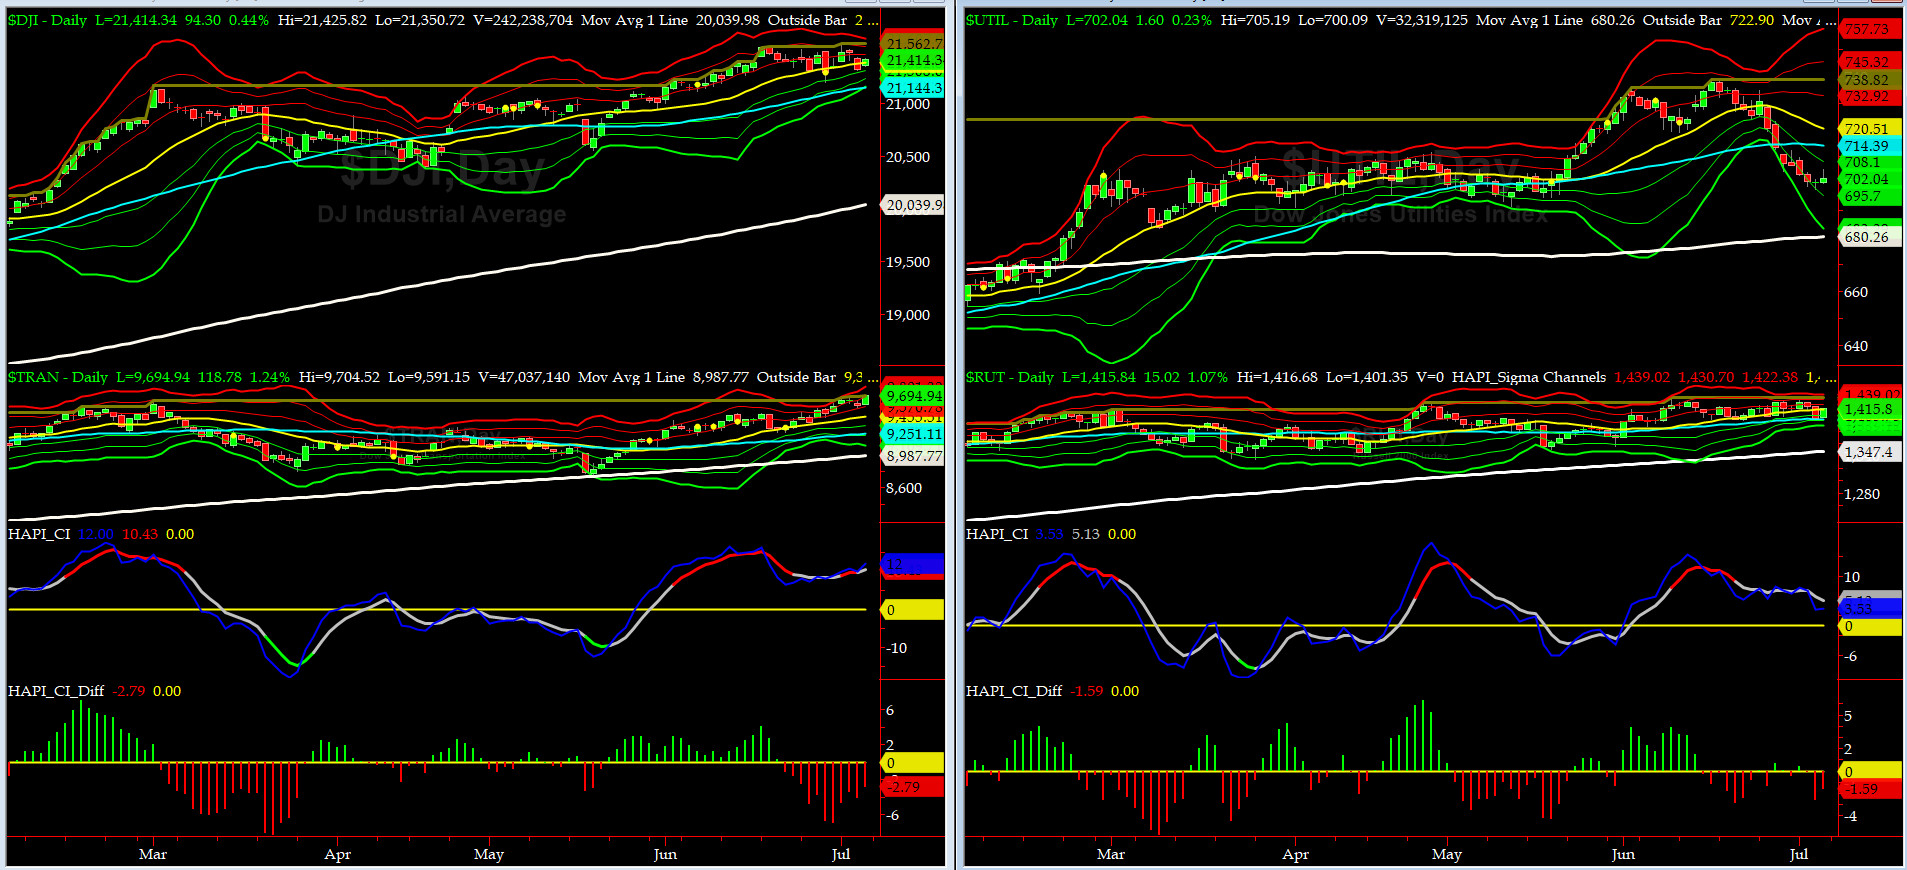
Canaries [in the Coal Mine] Chart for DJ TRAN & RUT Indices
200-Day MA DJ TRAN = 8987 or 7.9% below DJ TRAN (max observed in last 7 yrs = 20.2%, min = -20.3%)
200-Day MA RUT = 1347 or 5.1% below RUT (max observed in last 7 yrs = 21.3%, min = -22.6%)
DJ Transportation Index (proxy for economic conditions 6 to 9 months hence) accelerated higher this past week, making a new ATH. Russell 2000 Small Caps Index (proxy for Risk ON/OFF) managed a marginal move higher. RISK is still ON.
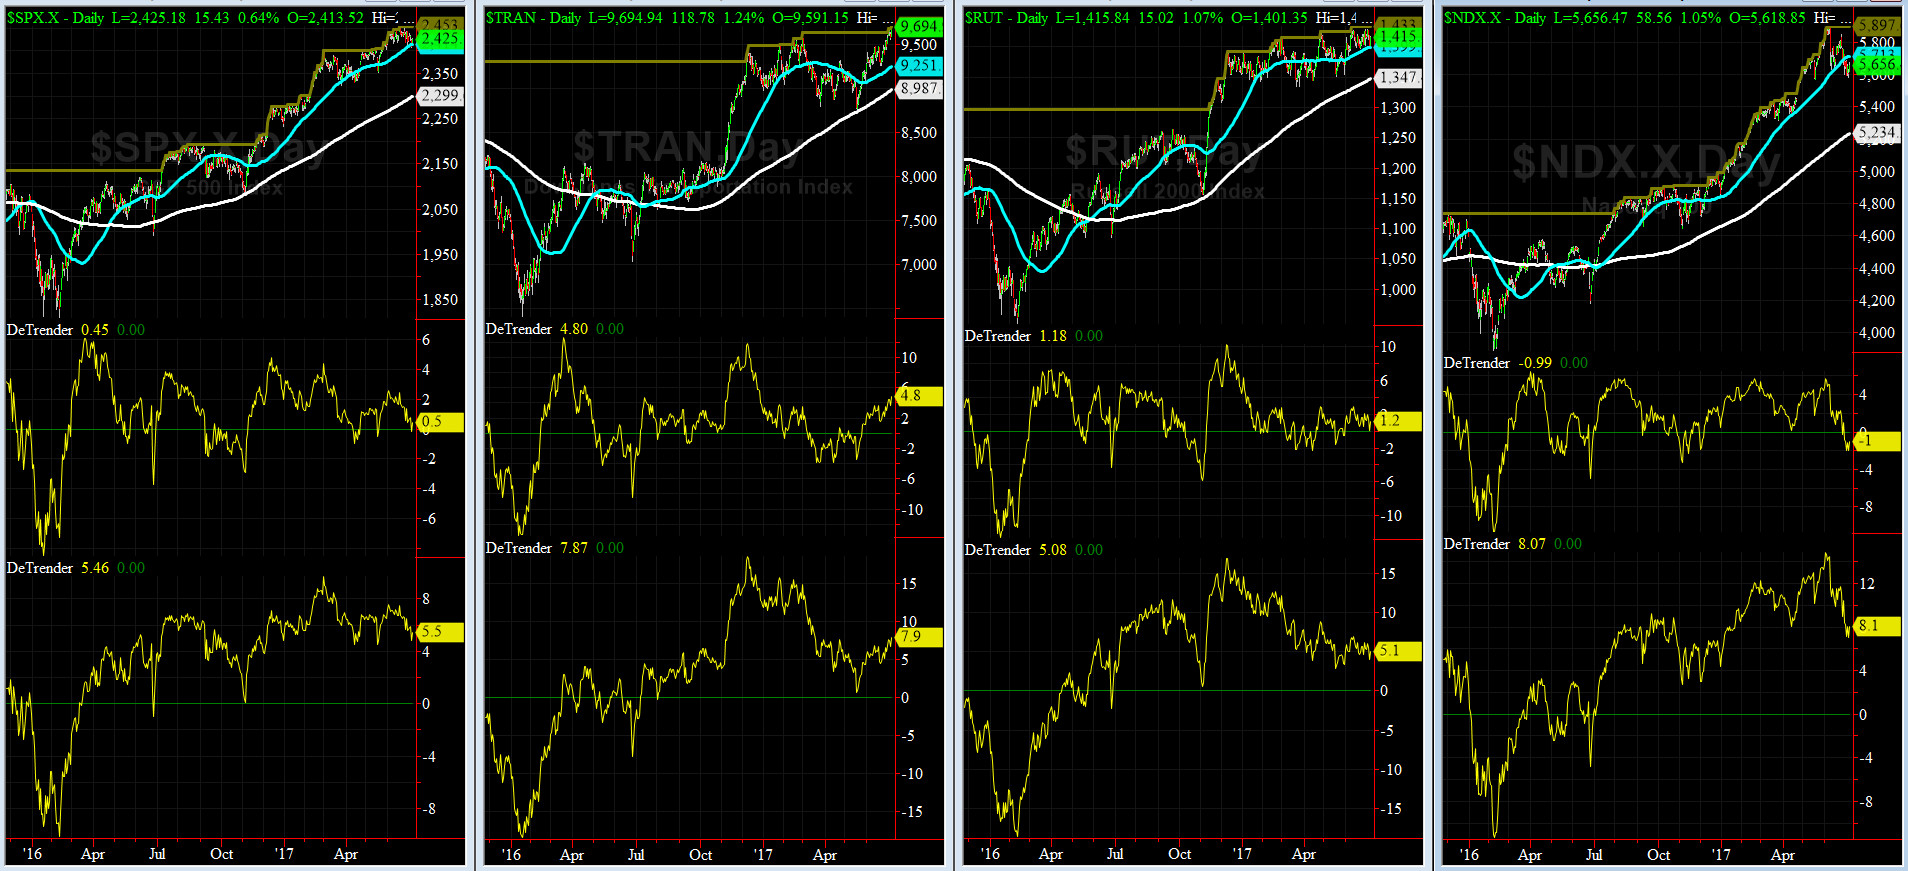
DeTrenders Charts for SPX, NDX, TRAN & RUT Indices
50-Day MA SPX = 2414 or 0.5% below SPX close of Friday (max observed in last 5 yrs = +8.6%, min = -9.3%)
200-Day MA SPX = 2299 or 5.5% below SPX (max observed in last 5 yrs = 15.2%, min = -14%)
Again, SEVEN of our EIGHT DeTrenders are POSITIVE now (NDX 50DT is neg) while the DeTrenders for DJ Tran & RUT will continue to be harbingers of future price behavior in broad indices.
HA_SP1_Momo Chart
WEEKLY Timing Model = on a BUY Signal since Friday 12/16/16 CLOSE at 2258
DAILY Timing Model = on a SELL Signal since Tuesday 6/27/17 CLOSE at 2419
Max SPX 52wk-highs reading last week = 26 (over 120-140, the local maxima is in)
Max SPX 52wk-Lows reading last week = 17 (over 40-60, the local minima is in)
HA_SP1 closed at just about its zero sigma channels
HA_Momo = -1.6 (reversals most likely occur above +10 or below -10)
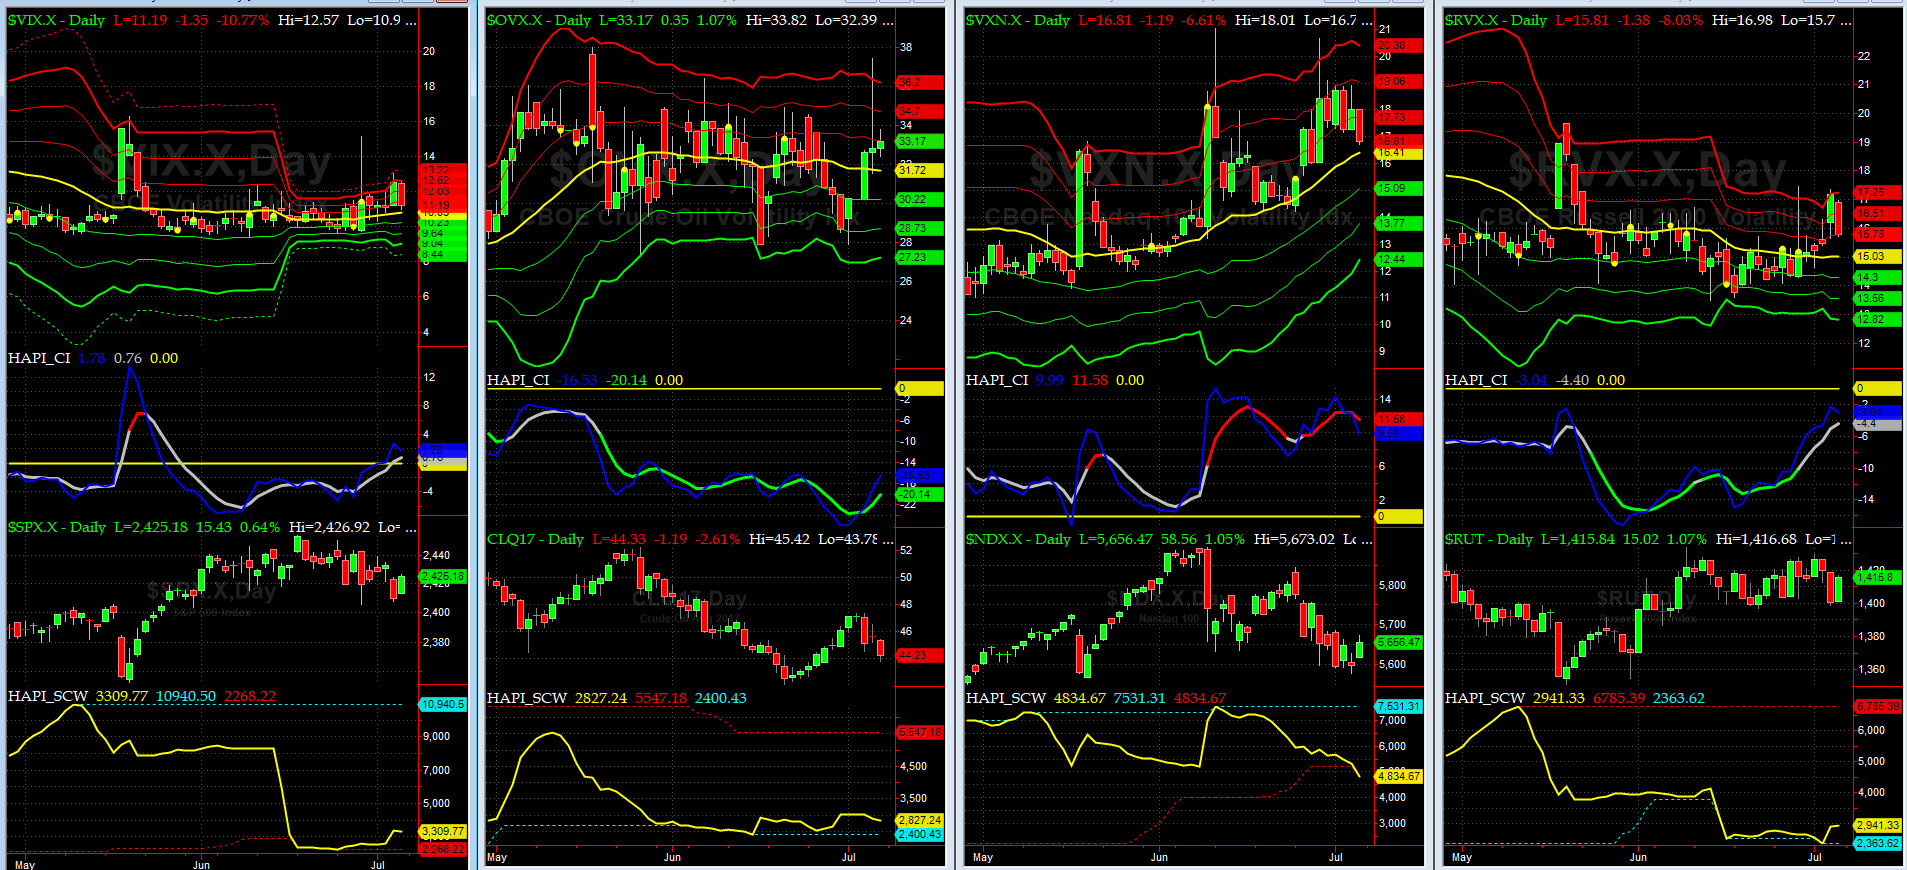
Vol of the Vols Chart
VIX currently stands at 11.2, or just at its +1 sigma (remember it's the VIX volatility pattern ( its sigma channels) that matters, and not the level of VIX itself ( this is per Dr. Robert Whaley, a great mentor and inventor of original VIX, now called VXO ). VIX usually peaks around a test of its +4 sigma).
Vol Indices remained muted this past week, with the exception of WTI crude.
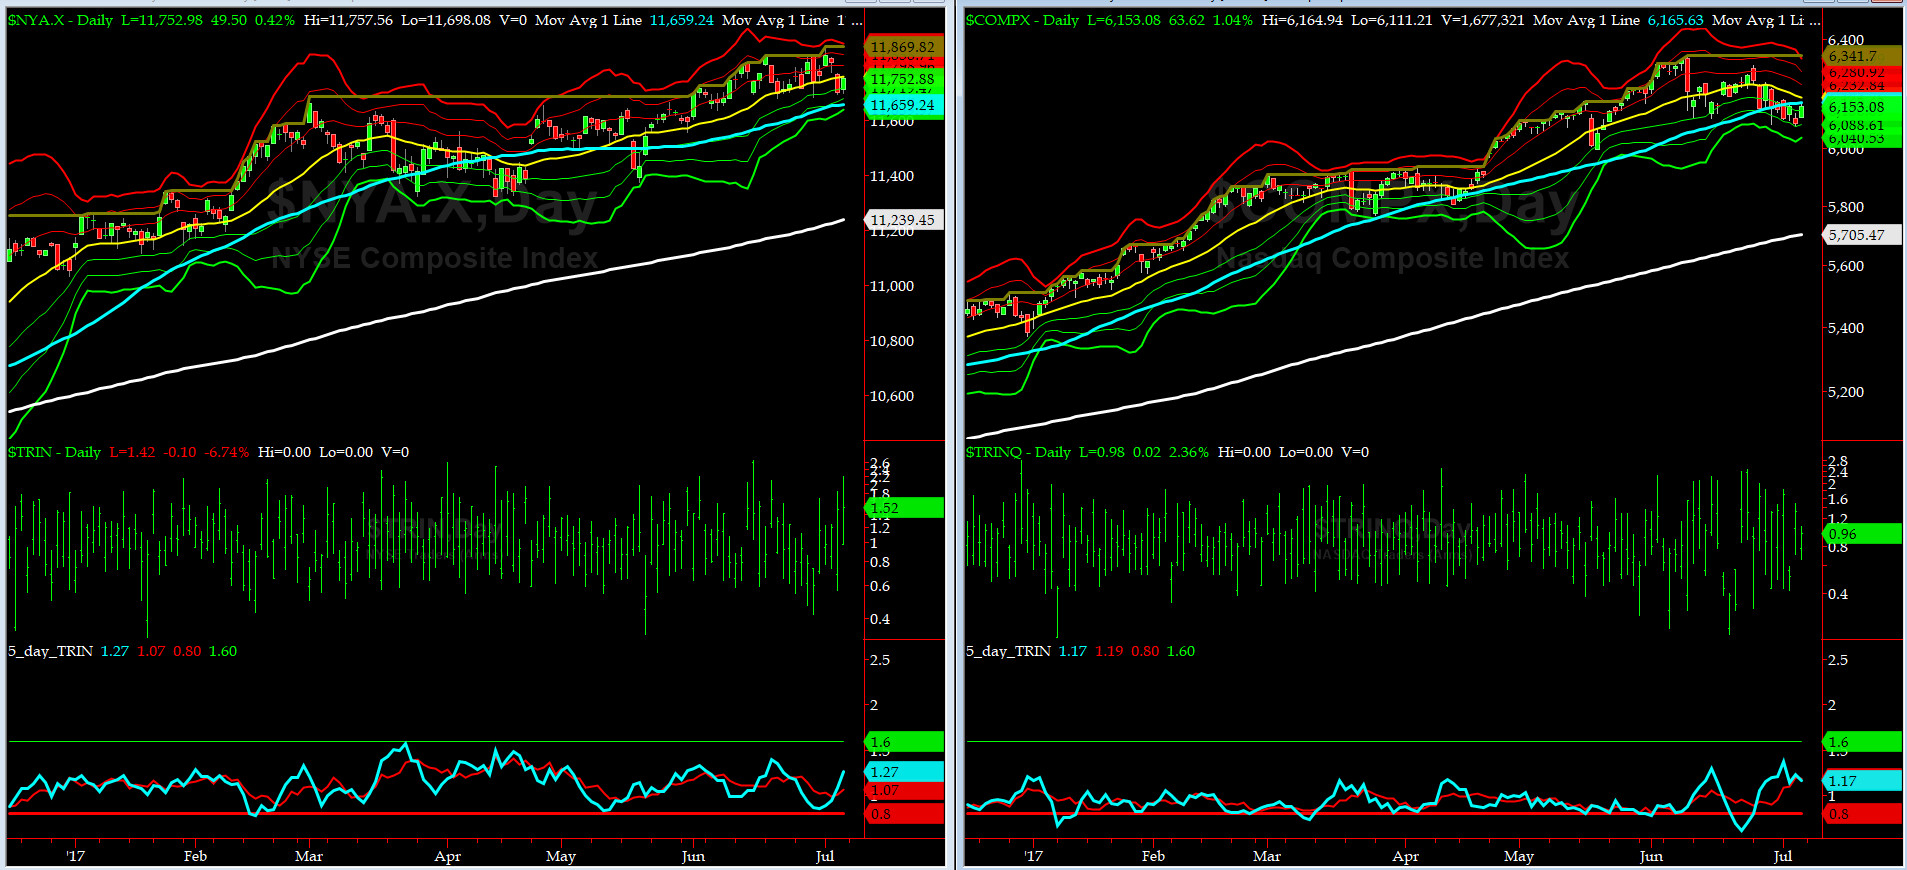
5-day TRIN & TRINQ Charts
The NYSE 5-day TRIN SELL signal was spot-on but with a strong June NFP + revisions on Friday, we are now heading a BUY Signal. Again, fasten your harness (as we say in the NAVY).
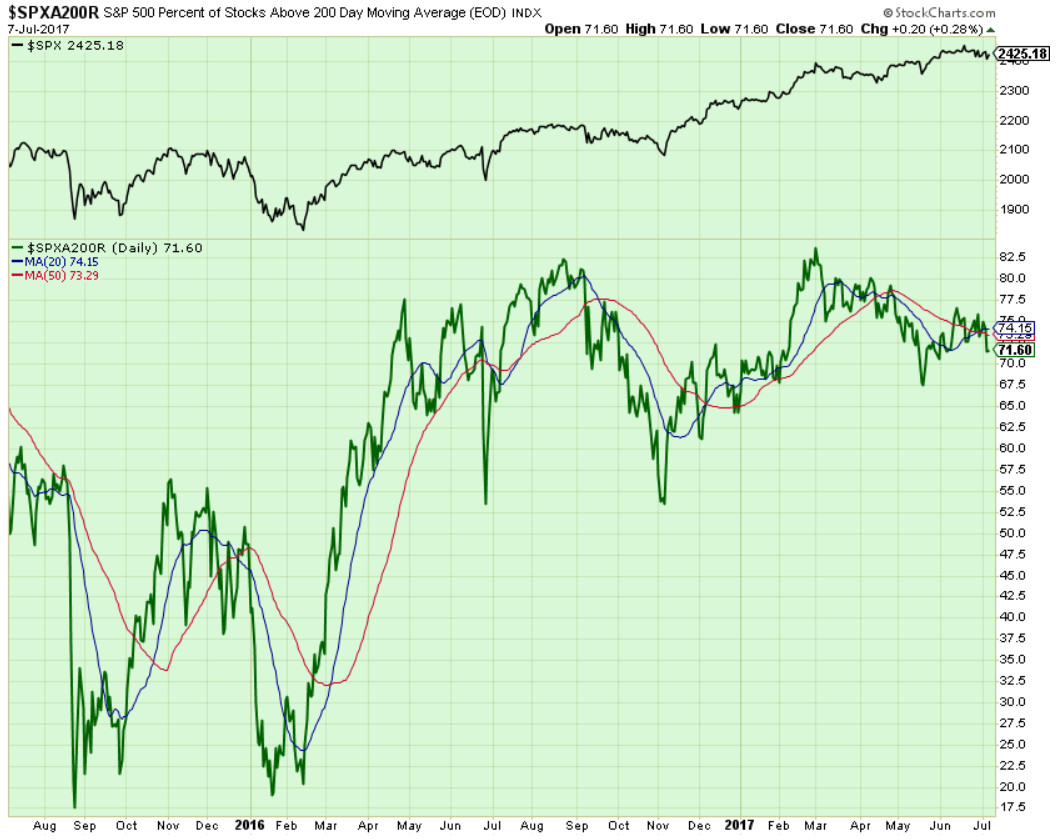
Components of SPX above their respective 200day MA Chart
This scoring indicator continues to exhibit divergences with SPX. Closed at 71%. We could see a test of 67%.
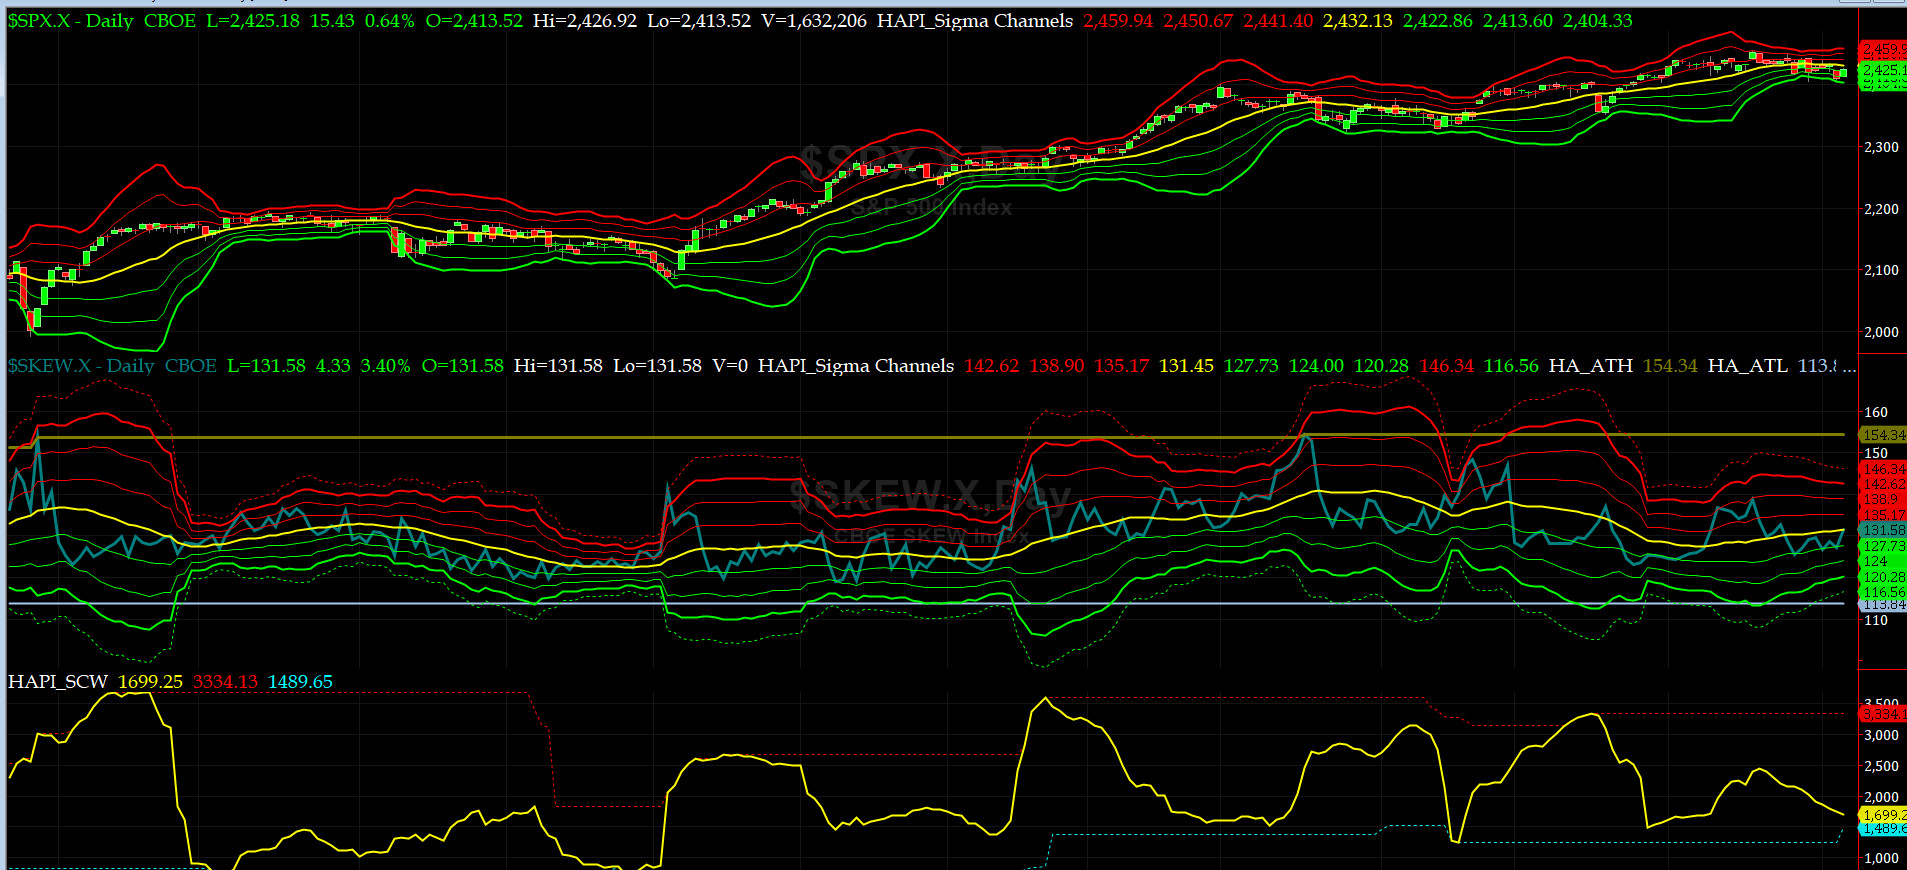
SPX SKEW (Tail Risk) Chart
Last week SPX SKEW (Tail Risk) spent most of the week near is -1 sigma, or about 127, and then closed at 131.5 its zero sigma (normal = 120-125, range 100-150).
Is all quiet on the Eastern & Mid-Western Fronts? Of course NOT. This ain't over till the Fat Lady sings.
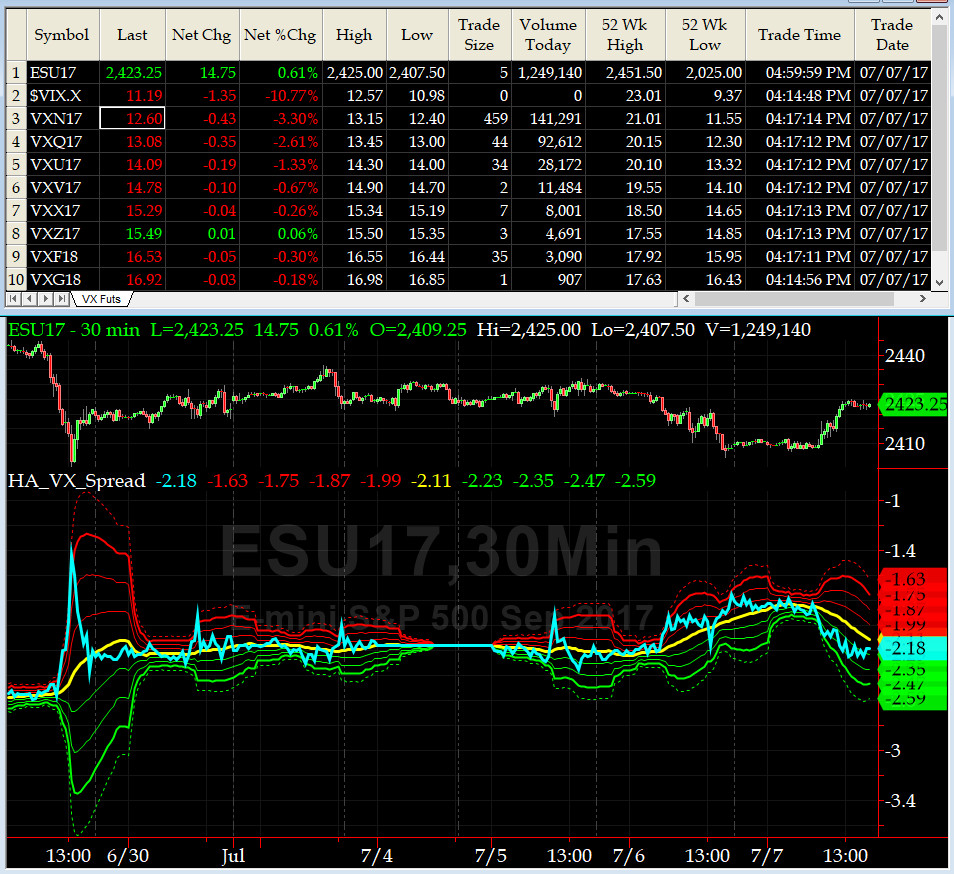
3-month VIX Futures Spread(VX) Chart
With the risk of sounding like a broken record, we must state that this indicator again went no nowhere fast during the past week with exception of one quick spike to -1.75 on Thursday. No signal here, as of now.

HA_SP2 Chart
HA_SP2 = 49 (Buy signal <= 25, Sell Signal >= 75)
On Thursday we hit 31 -- not quite at oversold level of 25, but close enough for gov work.
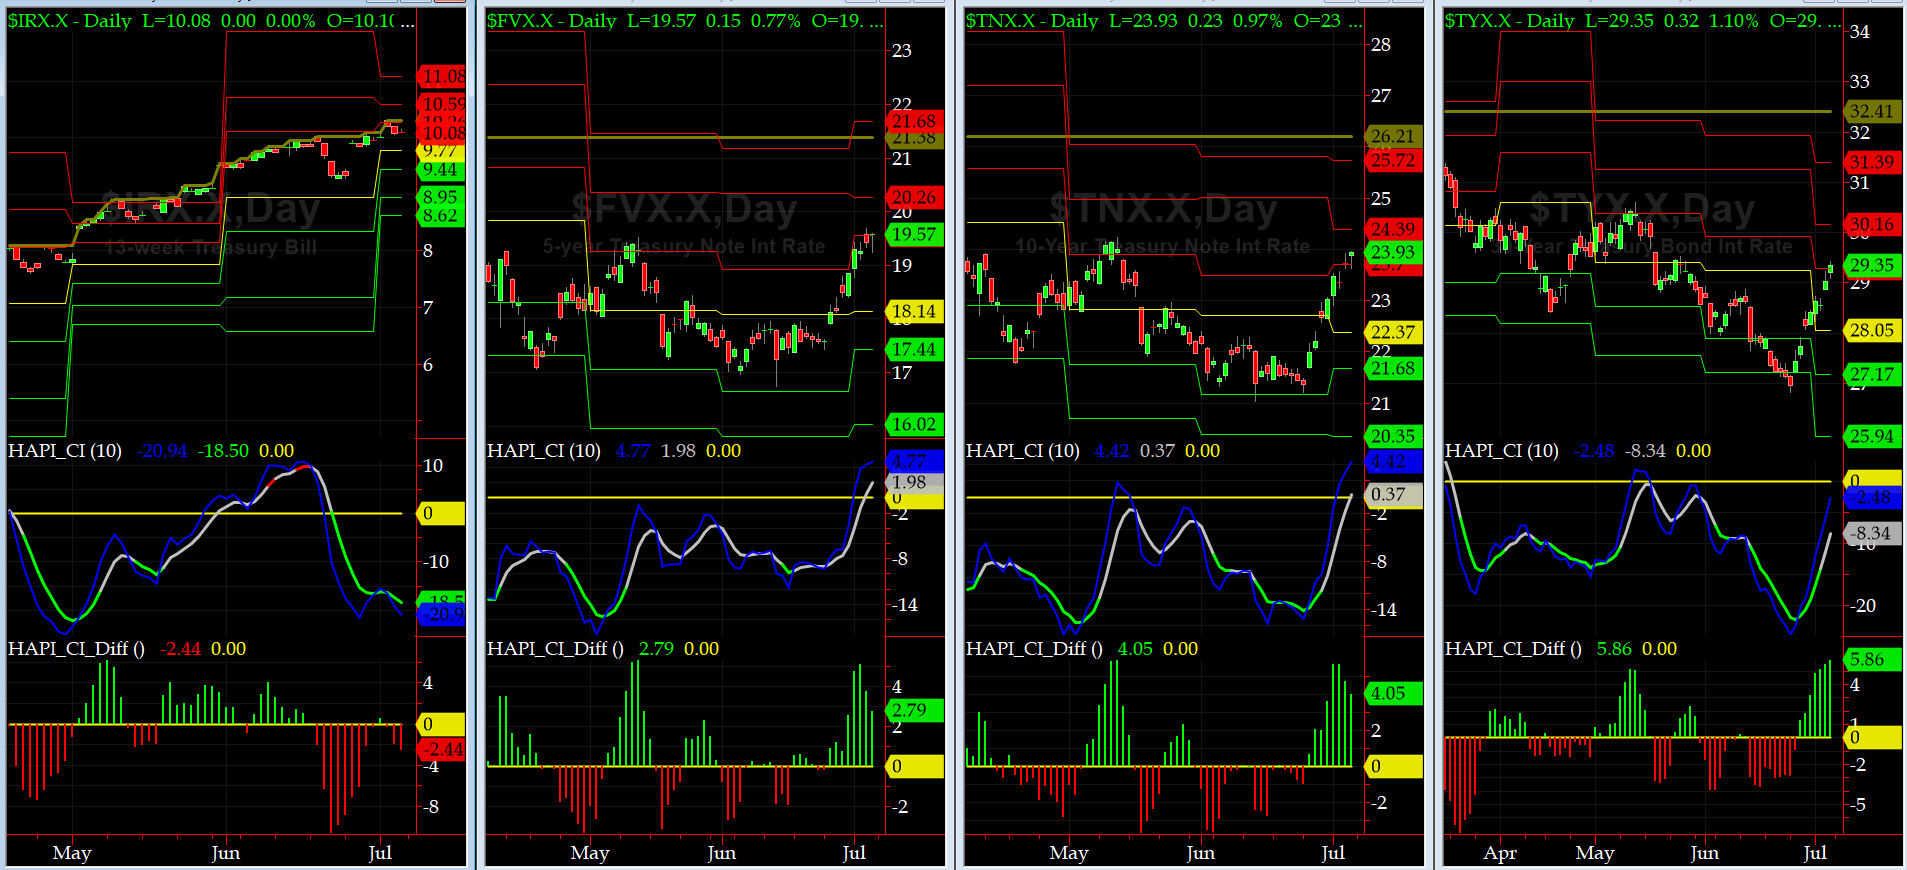
US Treasury T-Notes & T-Bonds Yields Chart
The fast rise in rates that we have witnessed in the last two weeks is a concern to us but who is listening? As Pink Floyd asks: Is anybody out there?
Fari Hamzei
|


 Proactive Market Timing