|
Sunday, August 13, 2017, 2330ET
Market Timing Charts, Analysis & Commentary for Issue #205
Timer Charts of S&P-500 Cash Index (SPX) + NASDAQ-100 Cash Index (NDX)
Most recent S&P-500 Cash Index (SPX): 2441.32 down -35.61 (down -1.44%) for the week ending Friday, August 11, 2017, which closed just about its -2.5 sigma.
SPX ALL TIME INTRADAY HIGH = 2484.04 (reached on Thursday, July 27, 2017)
SPX ALL TIME CLOSING HIGH = 2477.83 (reached on Tuesday, July 25, 2017)
Current DAILY +2 Sigma SPX = 2492 with WEEKLY +2 Sigma = 2499
Current DAILY 0 Sigma (20 day MA) SPX = 2470 with WEEKLY 0 Sigma = 2414
Current DAILY -2 Sigma SPX = 2447 with WEEKLY -2 Sigma = 2329
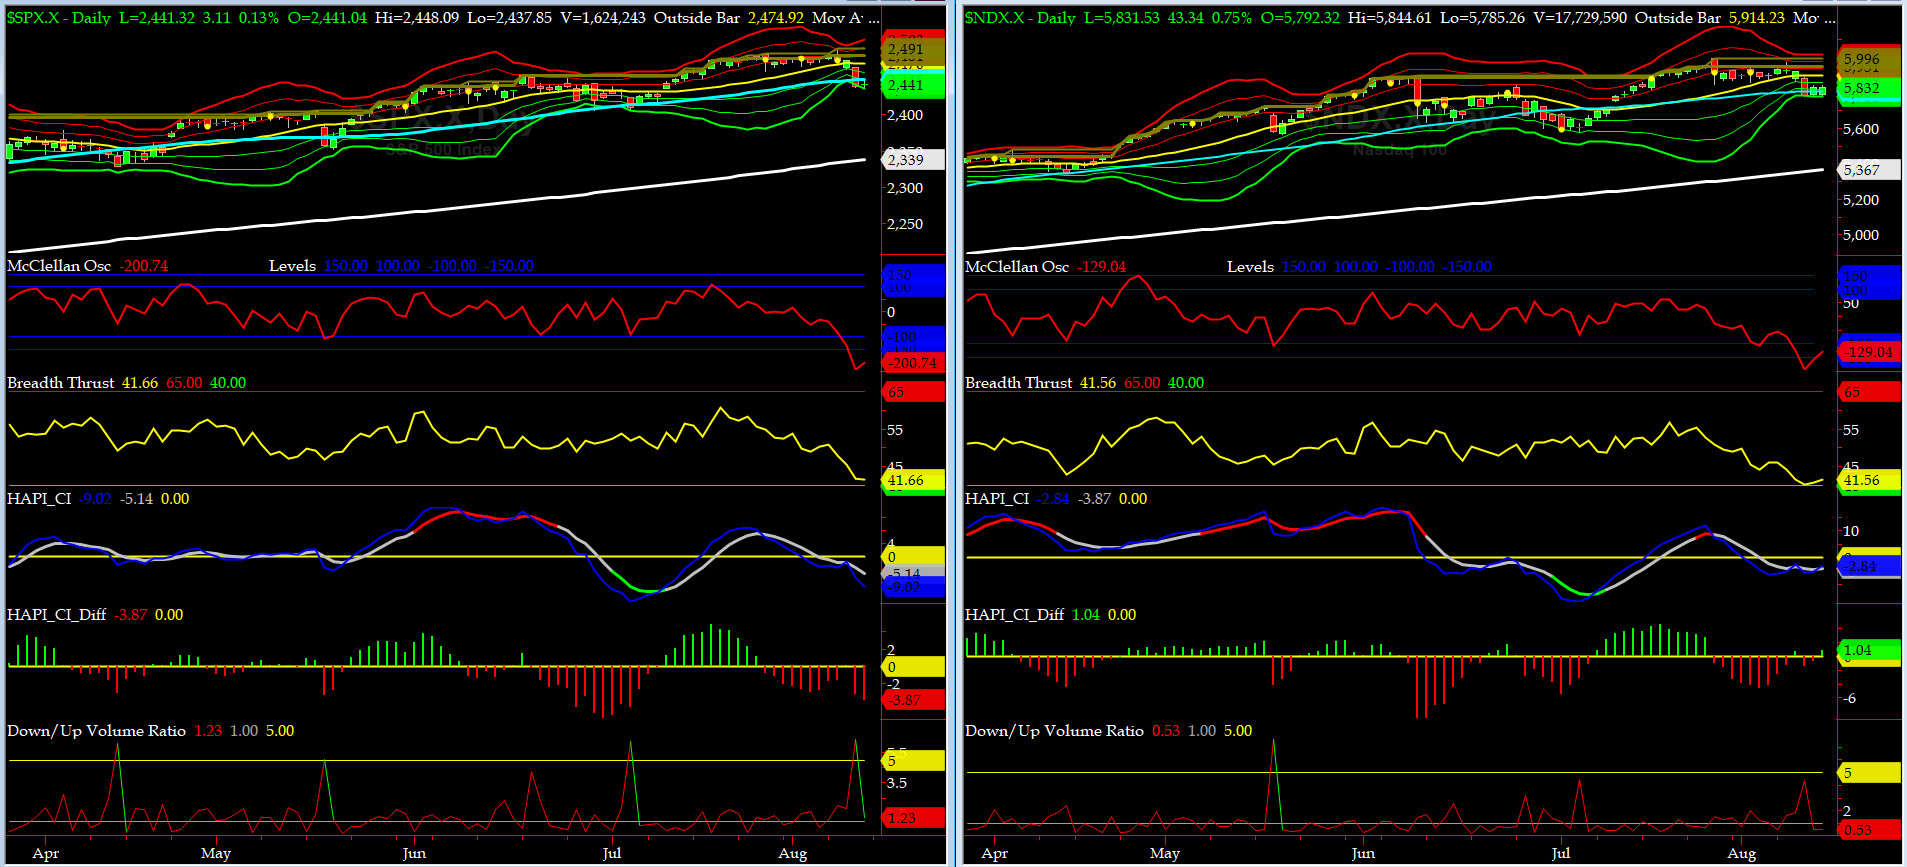
NYSE McClellan Oscillator = -201 (-150 is start of the O/S area; around -275 to -300 area or lower, we go into the �launch-pad� mode, over +150, we are in O/B area)
NYSE Breadth Thrust = 41.7 (40 is considered as oversold and 65 as overbought)
Most of our indicators showed that Thursday was a low and we had confirmation overnight into Friday open.
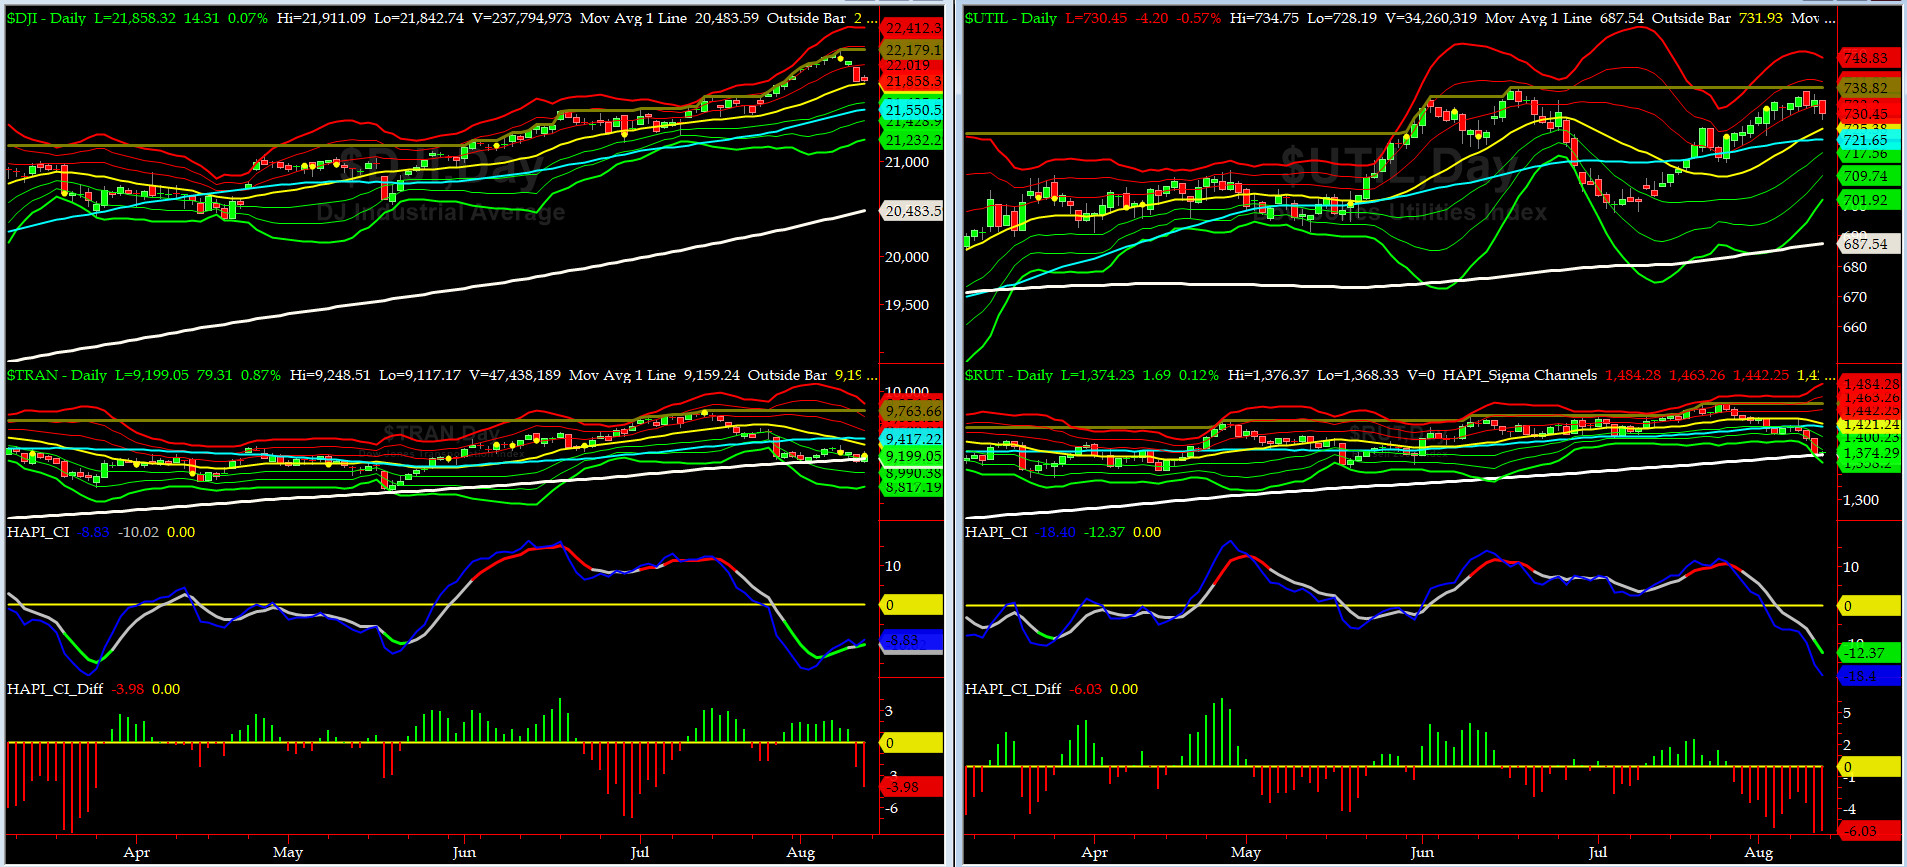
Canaries [in the Coal Mine] Chart for DJ TRAN & RUT Indices
200-Day MA DJ TRAN = 9159 or 0.4% below DJ TRAN (max observed in last 7 yrs = 20.2%, min = -20.3%)
200-Day MA RUT = 1370 or 0.3% below RUT (max observed in last 7 yrs = 21.3%, min = -22.6%)
DJ Transportation Index (proxy for economic conditions 6 to 9 months hence) has been retesting its 200 bar MA. Its early sell off into its 50day and then its 200day MA turned out to be a big tell (while SPX went up to new ATHs).
Russell 2000 Small Caps Index (proxy for Risk ON/OFF) had its worst week since Don Grumpino became the new Don (Nov 16). is RISK still ON? Don't ask and we won't tell.....lol
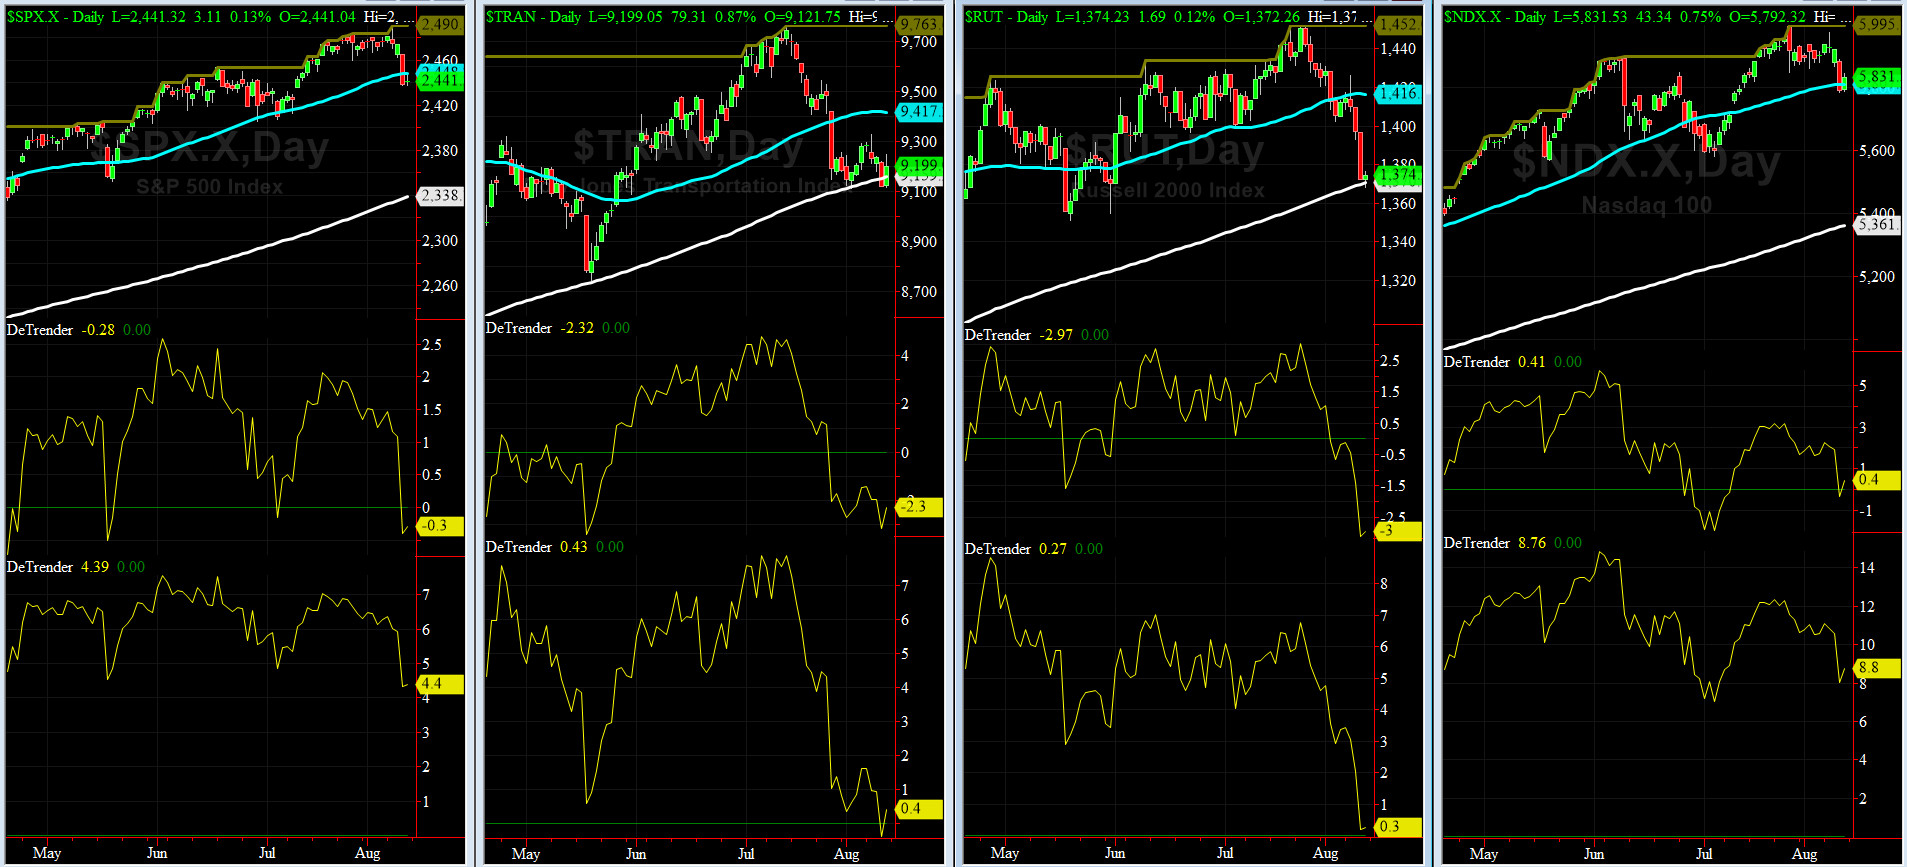
DeTrenders Charts for SPX, NDX, TRAN & RUT Indices
50-Day MA SPX = 2448 or 0.3% above SPX close of Friday (max observed in last 7 yrs = +8.6%, min = -9.3%)
200-Day MA SPX = 2338 or 4.4% below SPX (max observed in last 7 yrs = 15.2%, min = -14%)
Only FIVE of our EIGHT DeTrenders are POSITIVE while the DeTrenders for DJ Tran & RUT will continue to be harbingers of future price behavior in broad indices.
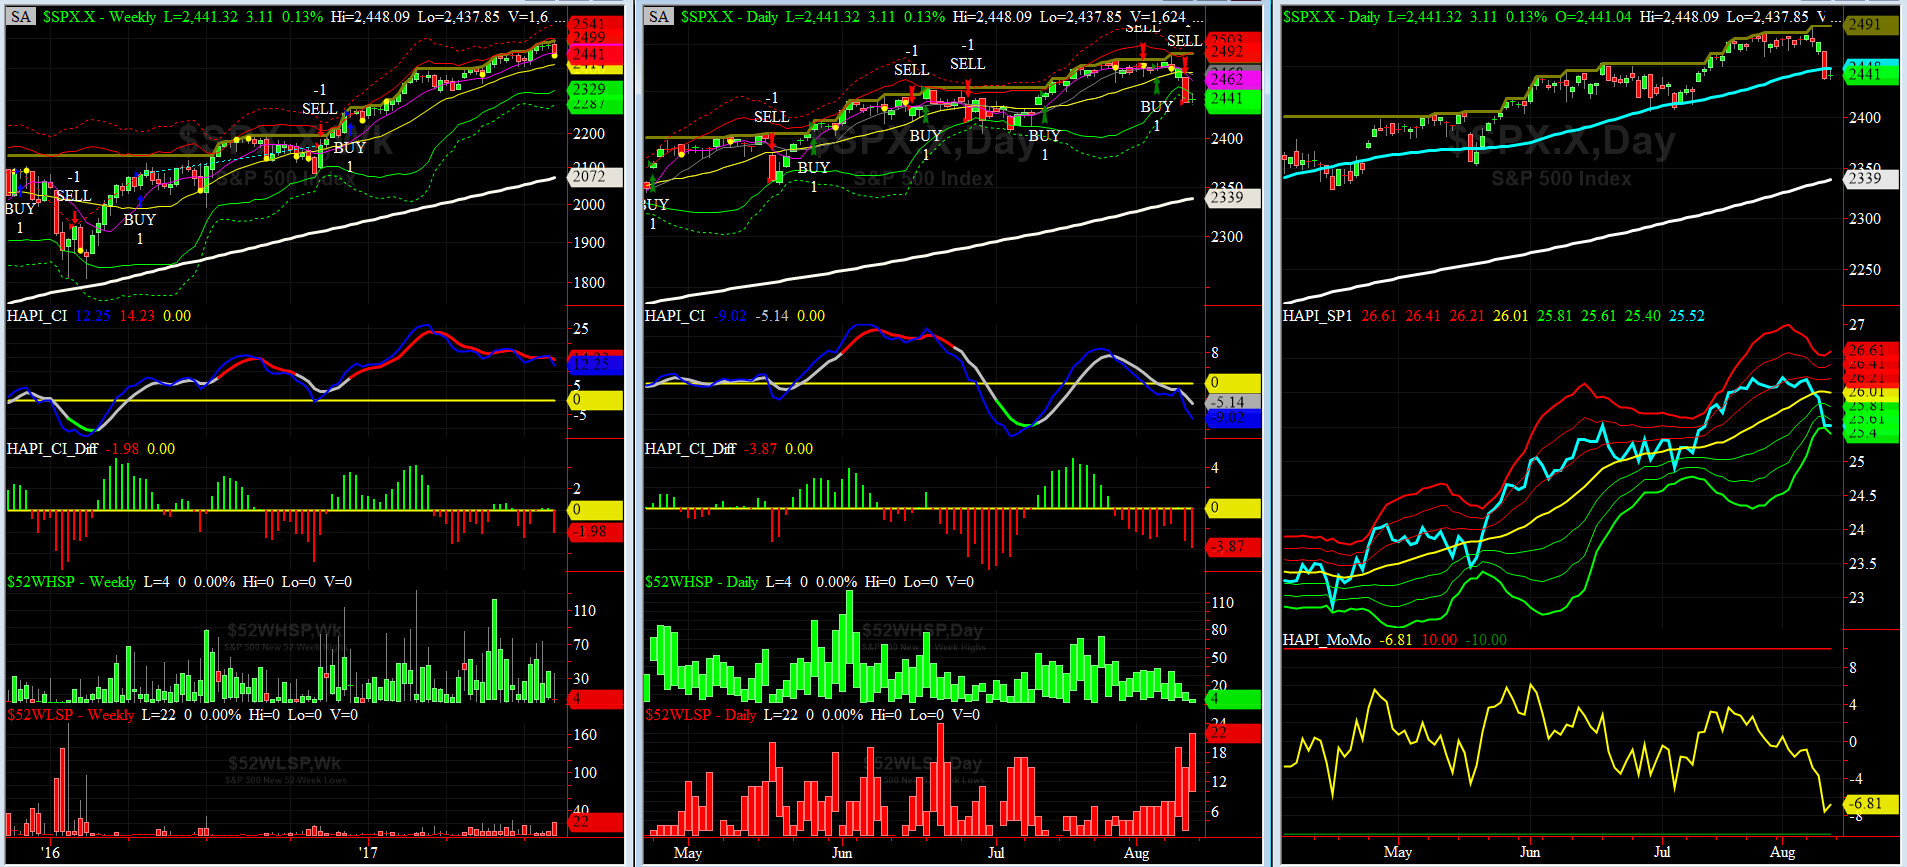
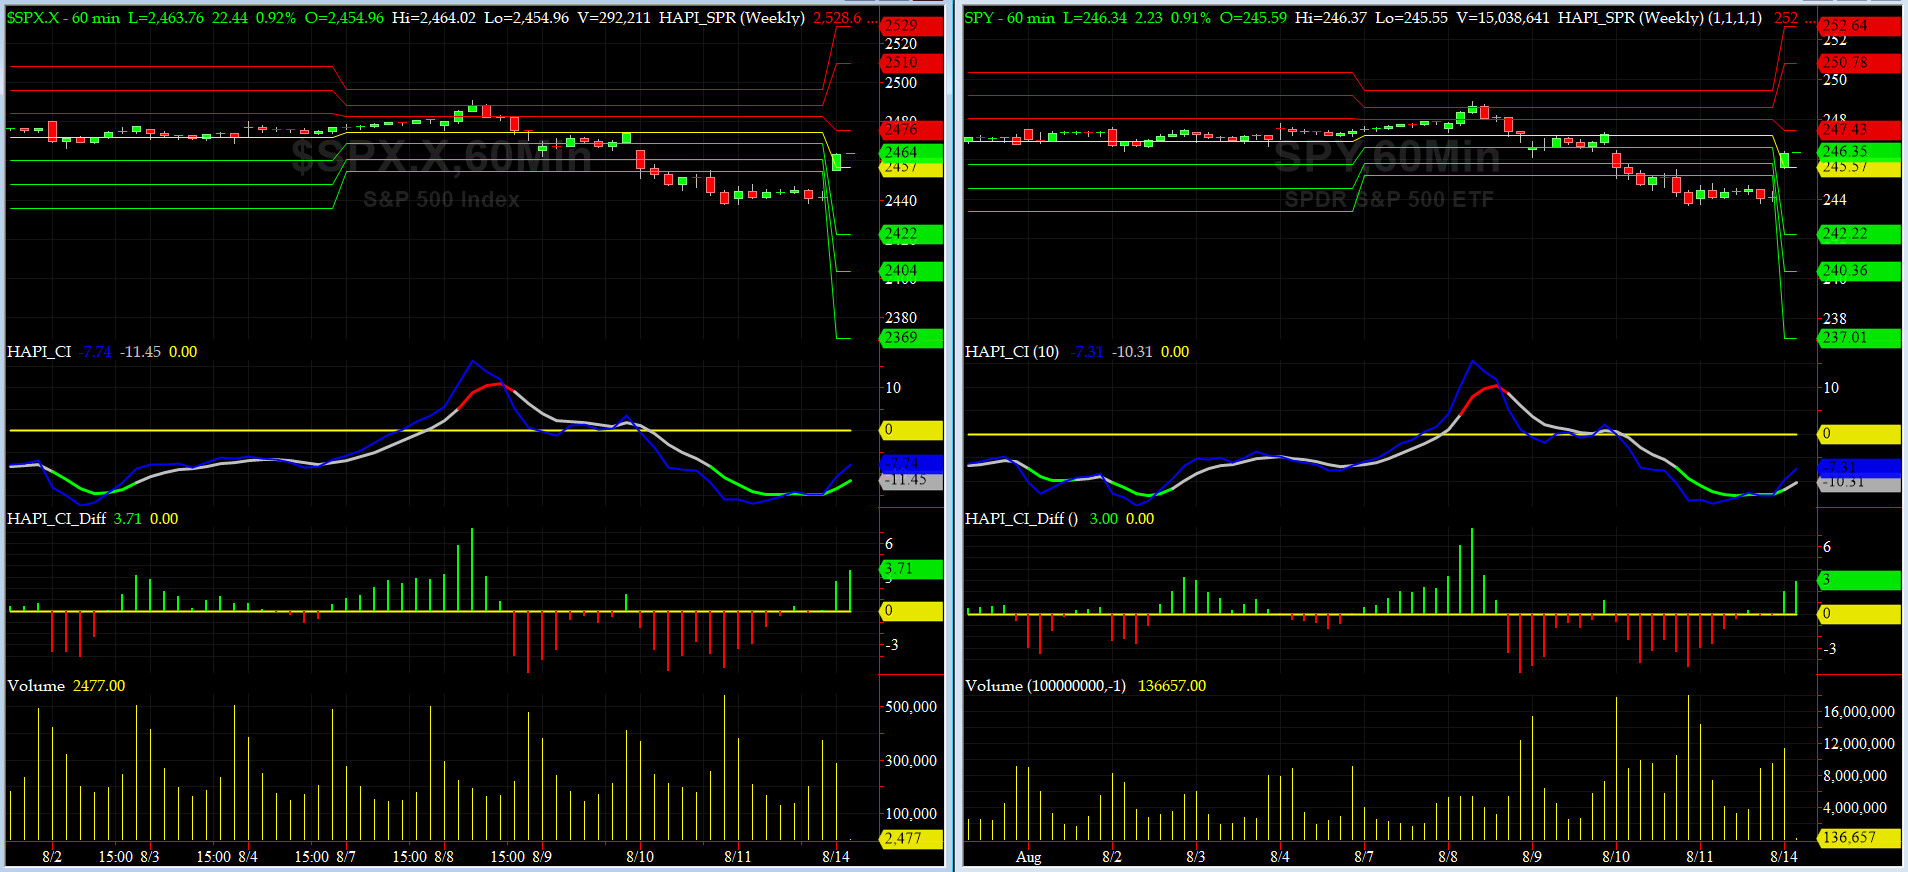
HA_SP1_Momo Chart
WEEKLY Timing Model = on a BUY Signal since Friday 12/16/16 CLOSE at 2258
DAILY Timing Model = on a SELL Signal since Thursday 8/10/17 CLOSE at 2438
Max SPX 52wk-highs reading last week = 35 (over 120-140, the local maxima is in)
Max SPX 52wk-Lows reading last week = 22 (over 40-60, the local minima is in)
HA_SP1 closed below its -3 sigma channels
HA_Momo = -6.8 (reversals most likely occur above +10 or below -10)
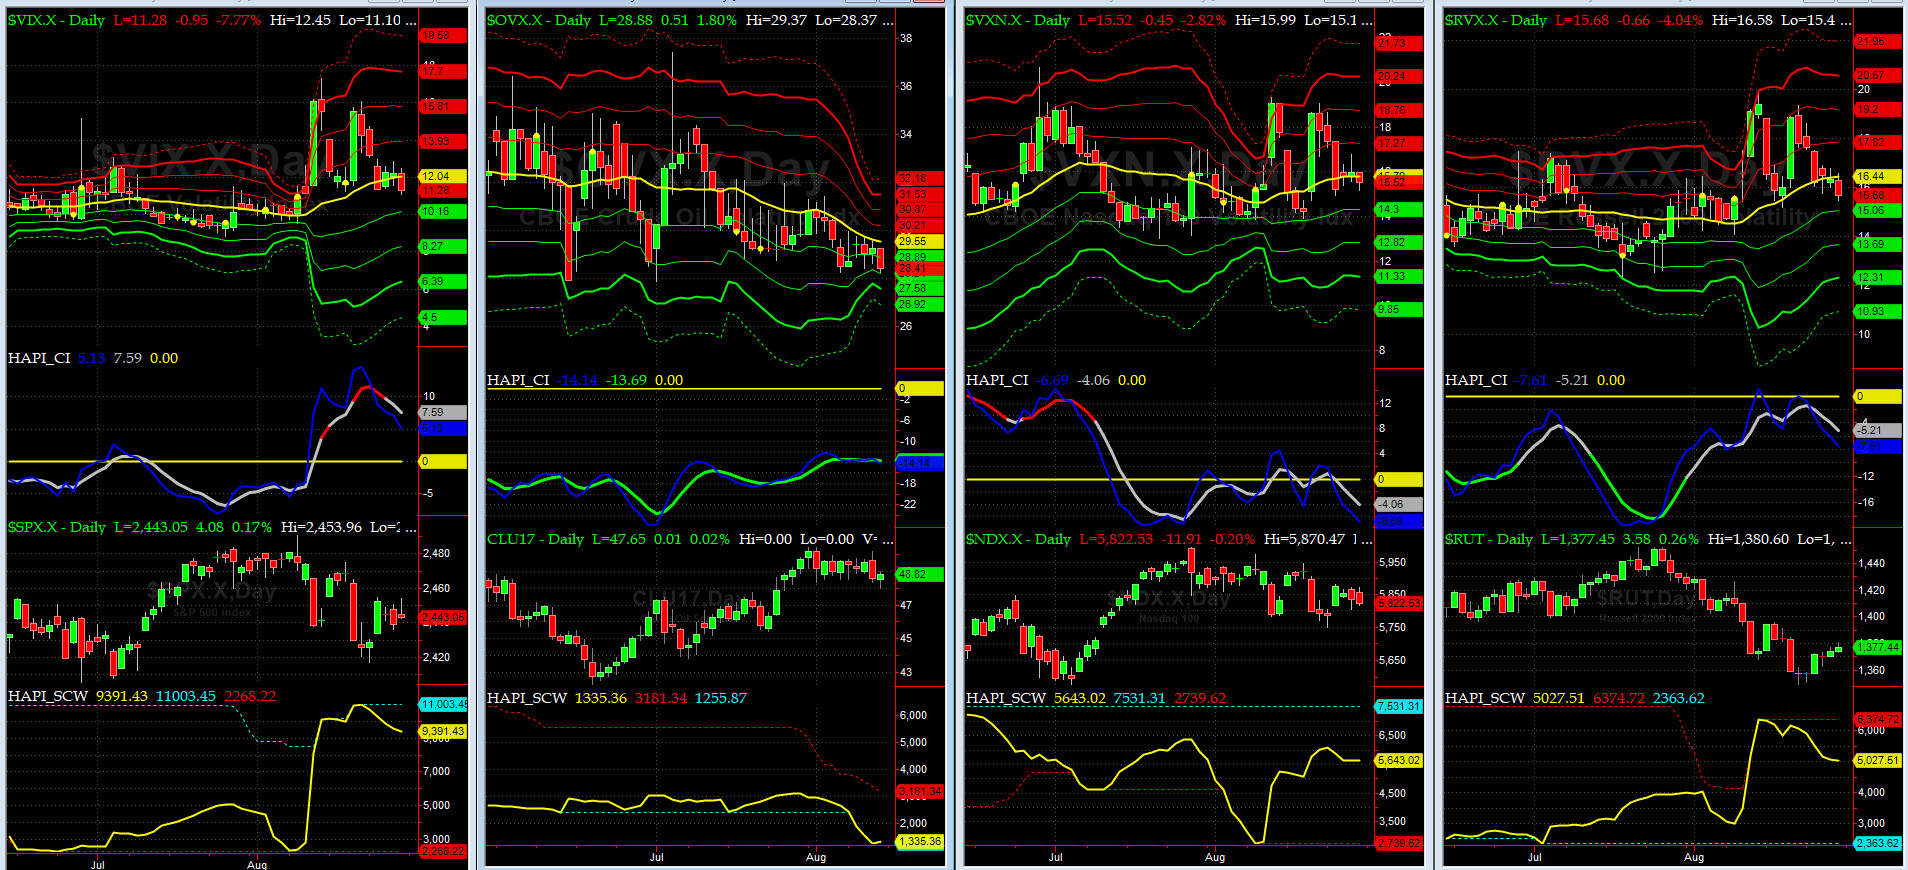
Vol of the Vols Chart
VIX currently stands at 15.51, or just at its +3 sigma (remember it's the VIX volatility pattern ( its sigma channels) that matters, and not the level of VIX itself ( this is per Dr. Robert Whaley, a great mentor and inventor of original VIX, now called VXO ). VIX usually peaks around a test of its +4 sigma).
In the last three trading sessions, VIX hits is +4 sigma, this normally says this shockwave is over....at least for now.... we would love to see a retest.
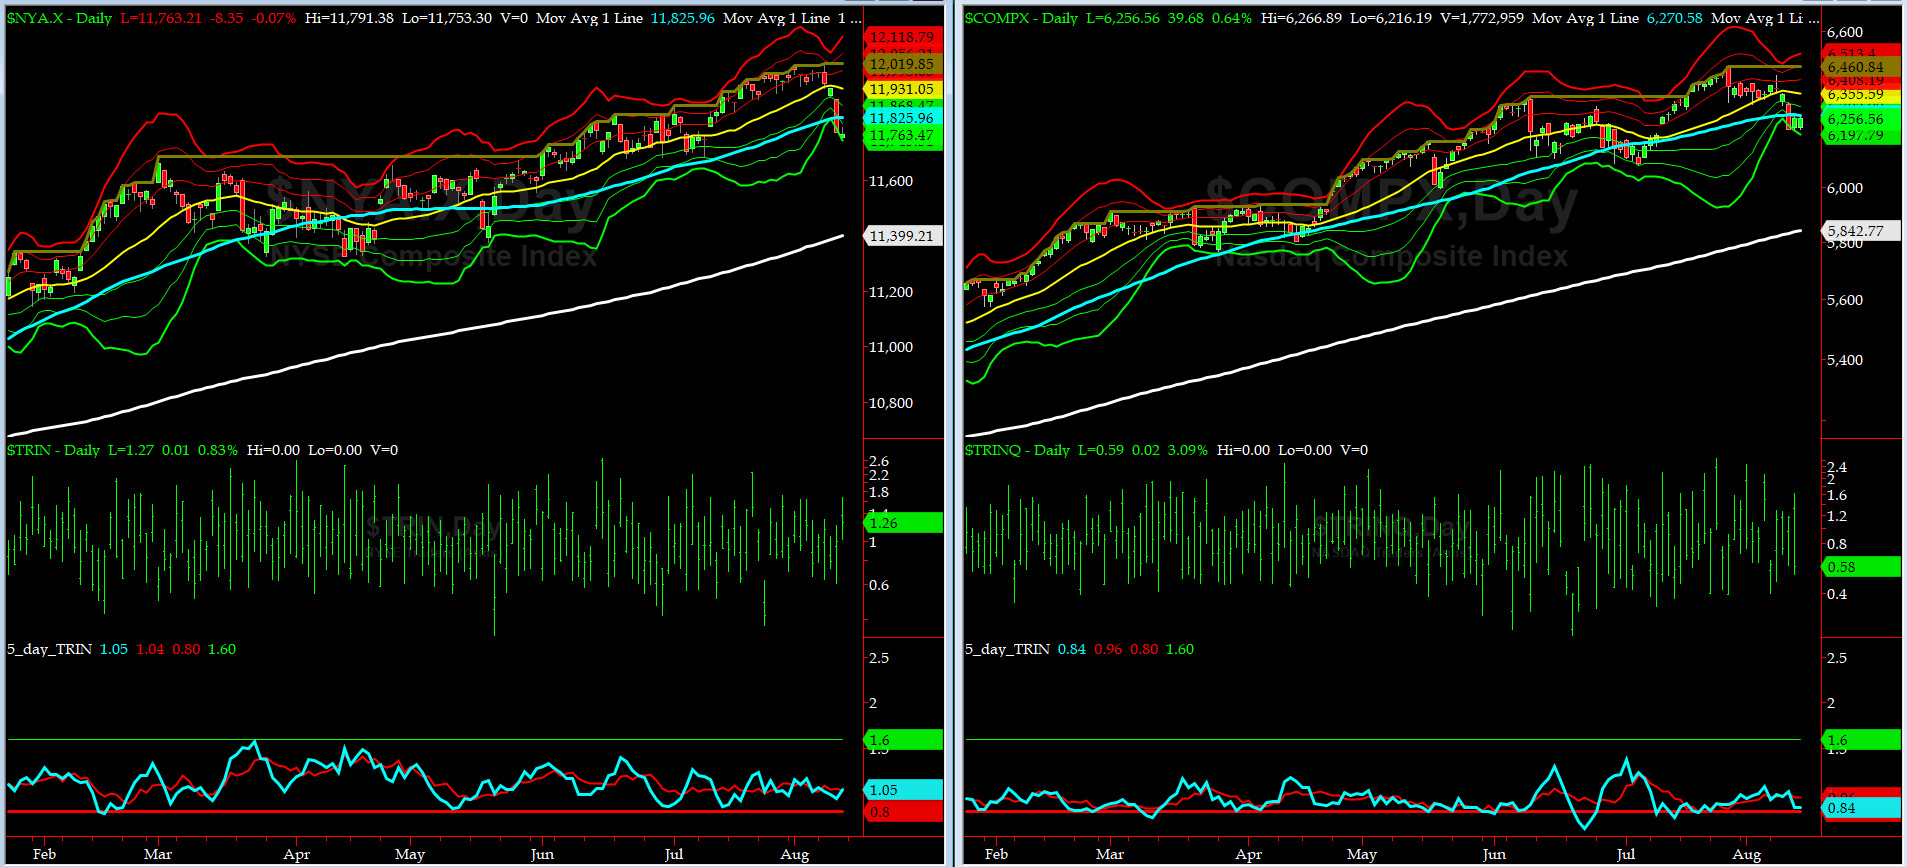
5-day TRIN & TRINQ Charts
NYSE 5-day TRIN is NEUTRAL while its NASDAQ brethren is in SELL zone.
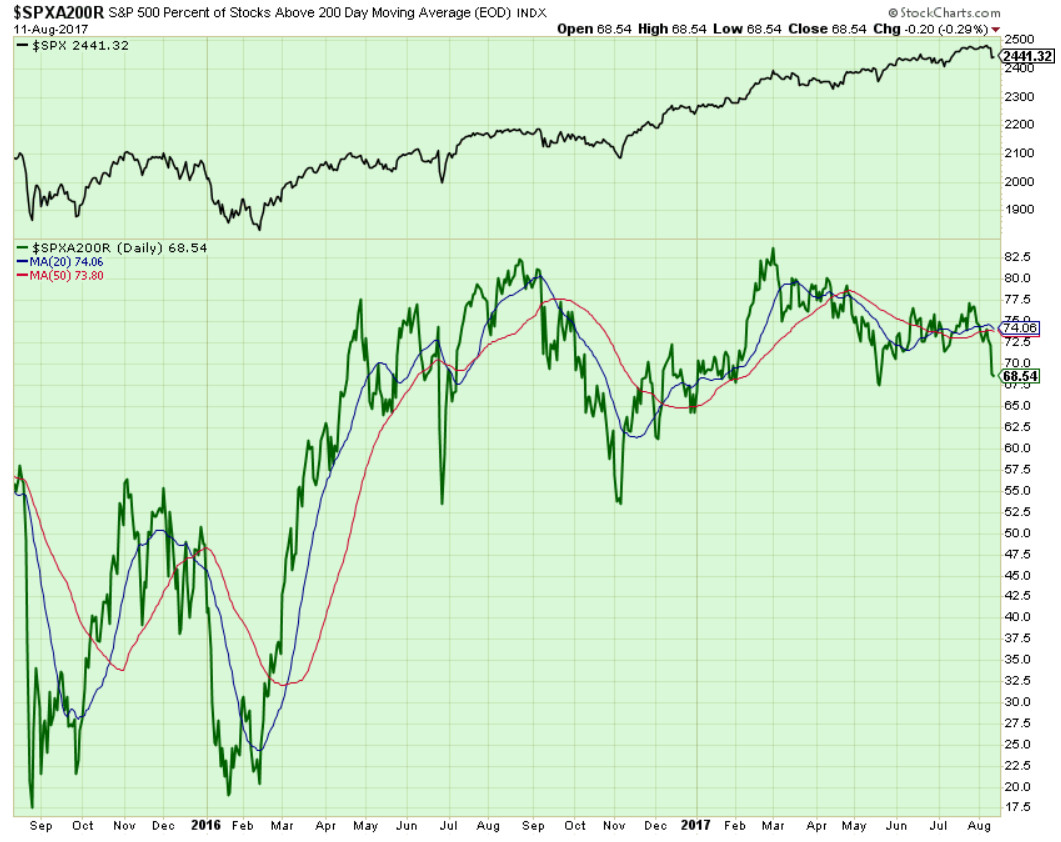
Components of SPX above their respective 200day MA Chart
As mentioned here, this scoring indicator gave us a great HEADS UP last week !!!
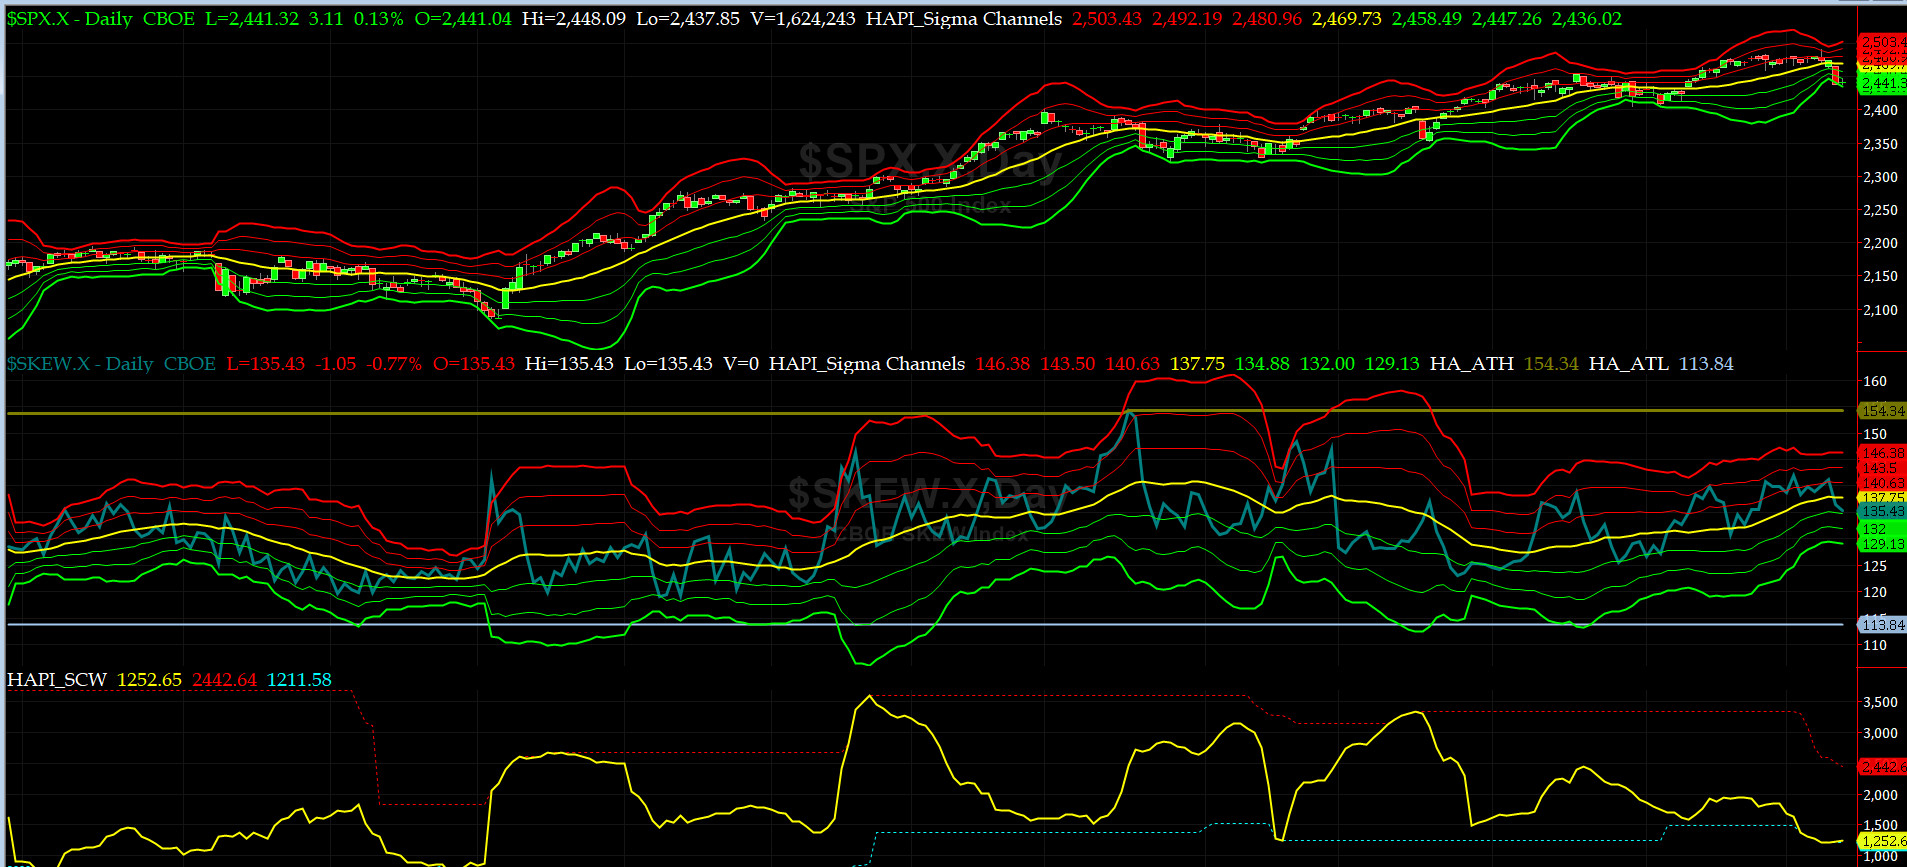
SPX SKEW (Tail Risk) Chart
Last week SPX SKEW (Tail Risk) went up fairly slowly till Wednesday then sank both on Thursday and Friday and close at 135.4 near its -1 sigma (normal = 120-125, range 100-150).
Is all quiet on the Eastern & Mid-Western Fronts? Smart Money thinks YES.
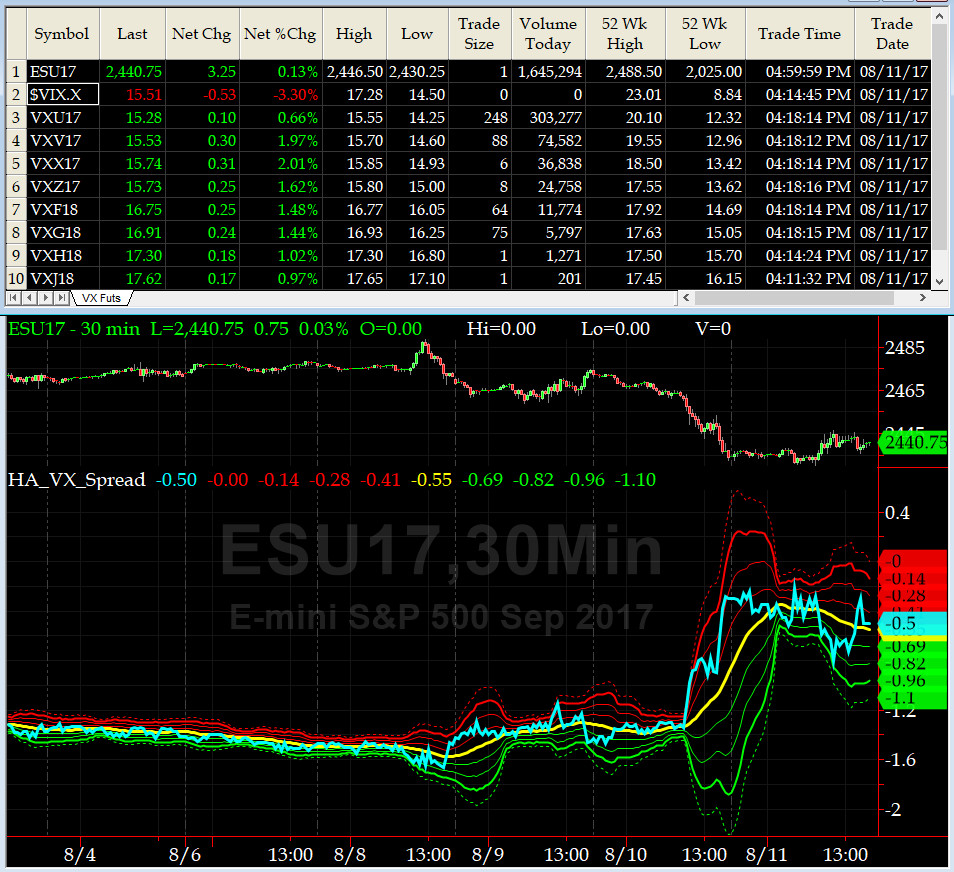
3-month VIX Futures Spread(VX) Chart
The Long SEP, Short DEEZ Spread again worked like a charm and went almost positive (confirming local minima is in) around 0400 ET on Friday as London Cash Market opened. Another BULLS-EYE signal.

HA_SP2 Chart
HA_SP2 = 20.1 (Buy signal <= 25, Sell Signal >= 75)
Our favorite prop indicator sank to 14.01 on Thursday close - that was the low for this leg. STAY ALERT SAILORS......
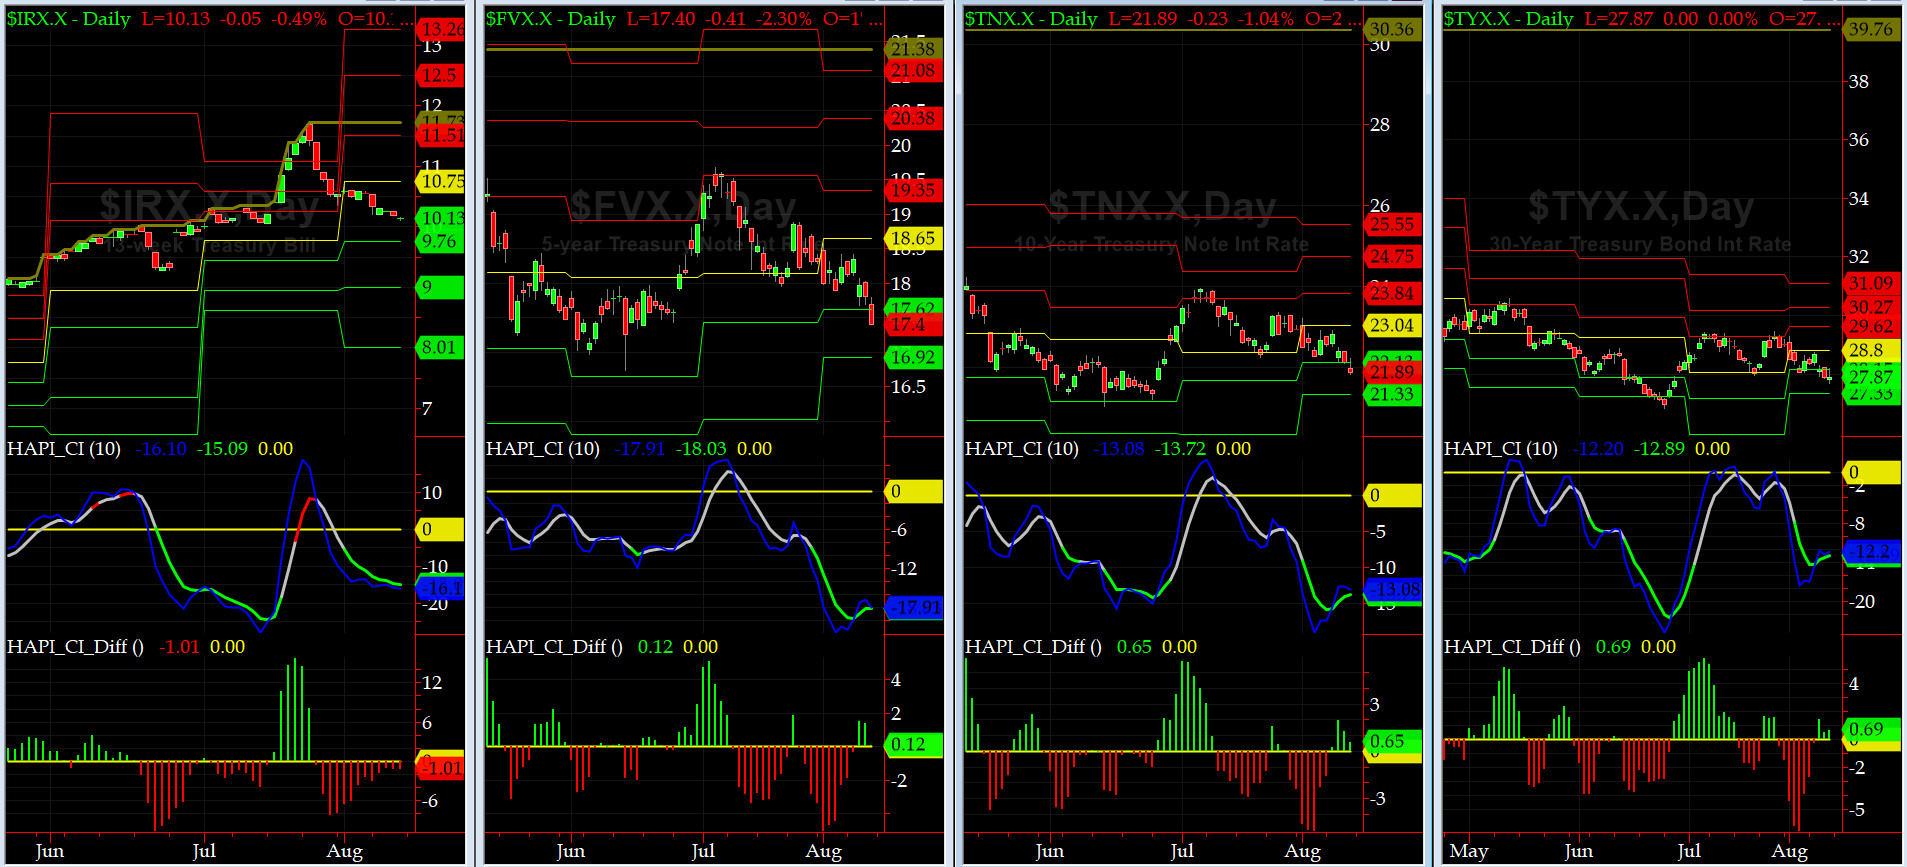
US Treasury T-Notes & T-Bonds Yields Chart
The Treasury Market rallied hard this week as YTM sank across the Yield Curve, thanks to Don Grumpino's uber hot air.
Fari Hamzei
|


 Proactive Market Timing