|
Monday, August 21, 2017, 2345ET
Market Timing Charts, Analysis & Commentary for Issue #206
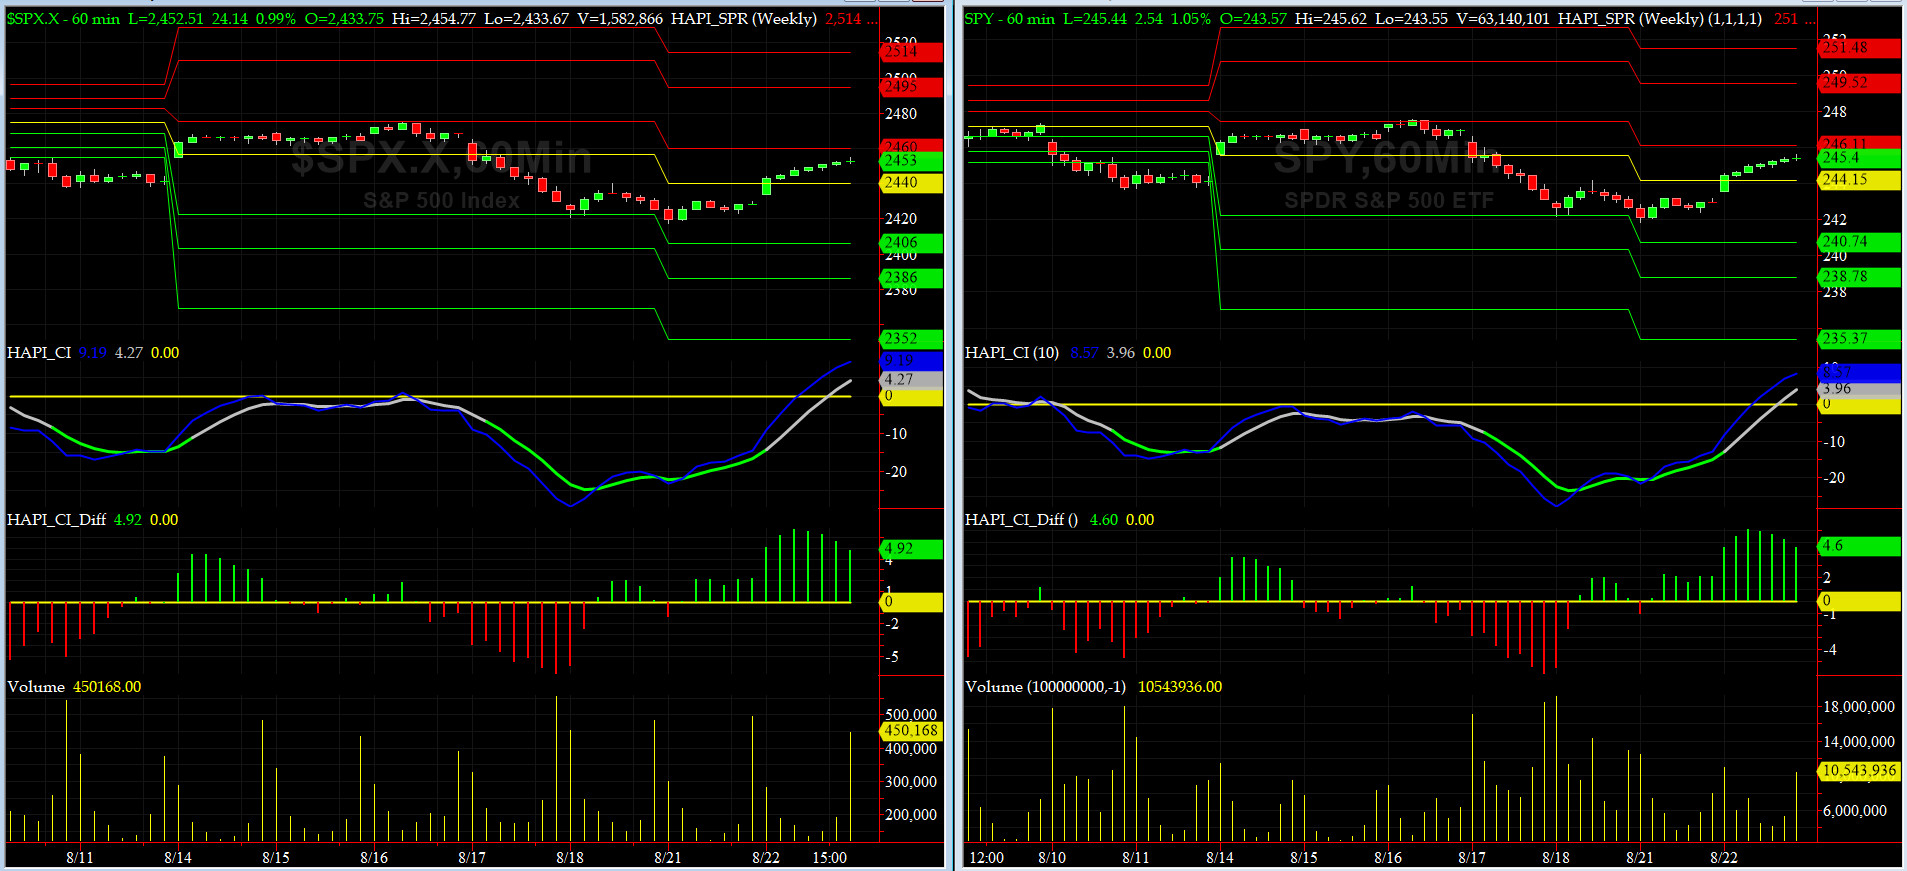
Timer Charts of S&P-500 Cash Index (SPX) + NASDAQ-100 Cash Index (NDX)
Most recent S&P-500 Cash Index (SPX): 2428.37 down -12.95 (down -0.53%) for six trading days ending on Monday, August 21, 2017, which closed just about its -2 sigma.
SPX ALL TIME INTRADAY HIGH = 2490.87 (reached on Tuesday, Aug 8, 2017)
SPX ALL TIME CLOSING HIGH = 2480.91 (reached on Monday, Aug 7, 2017)
Current DAILY +2 Sigma SPX = 2500 with WEEKLY +2 Sigma = 2497
Current DAILY 0 Sigma (20 day MA) SPX = 2463 with WEEKLY 0 Sigma = 2421
Current DAILY -2 Sigma SPX = 2427 with WEEKLY -2 Sigma = 2344
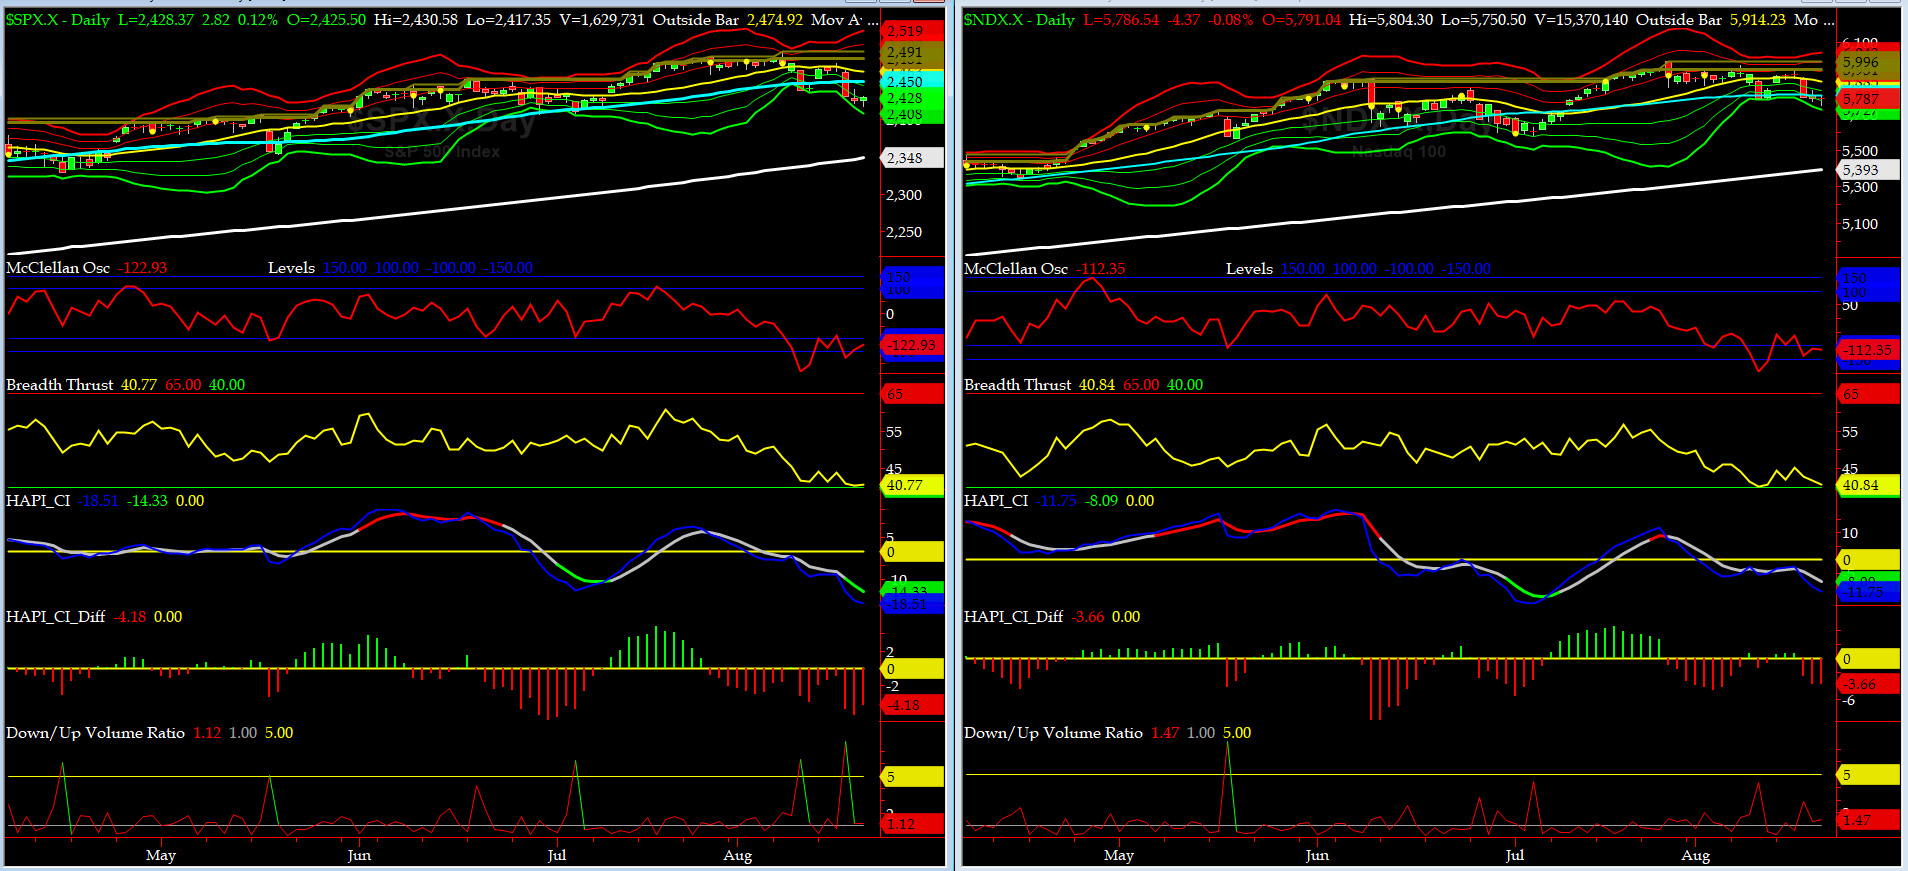
NYSE McClellan Oscillator = -123 (-150 is start of the O/S area; around -275 to -300 area or lower, we go into the �launch-pad� mode, over +150, we are in O/B area)
NYSE Breadth Thrust = 40.8 (40 is considered as oversold and 65 as overbought)
Last Thursday, US Markets were nervous after a number of key CEO bolted from Don Grumpino's Manufacturing & Policy Councils. By early Friday, Steven Bannon was ousted. Finally the Generals were in control. But the epic battle for the heart & soul of Nationalists is yet to be declared over.
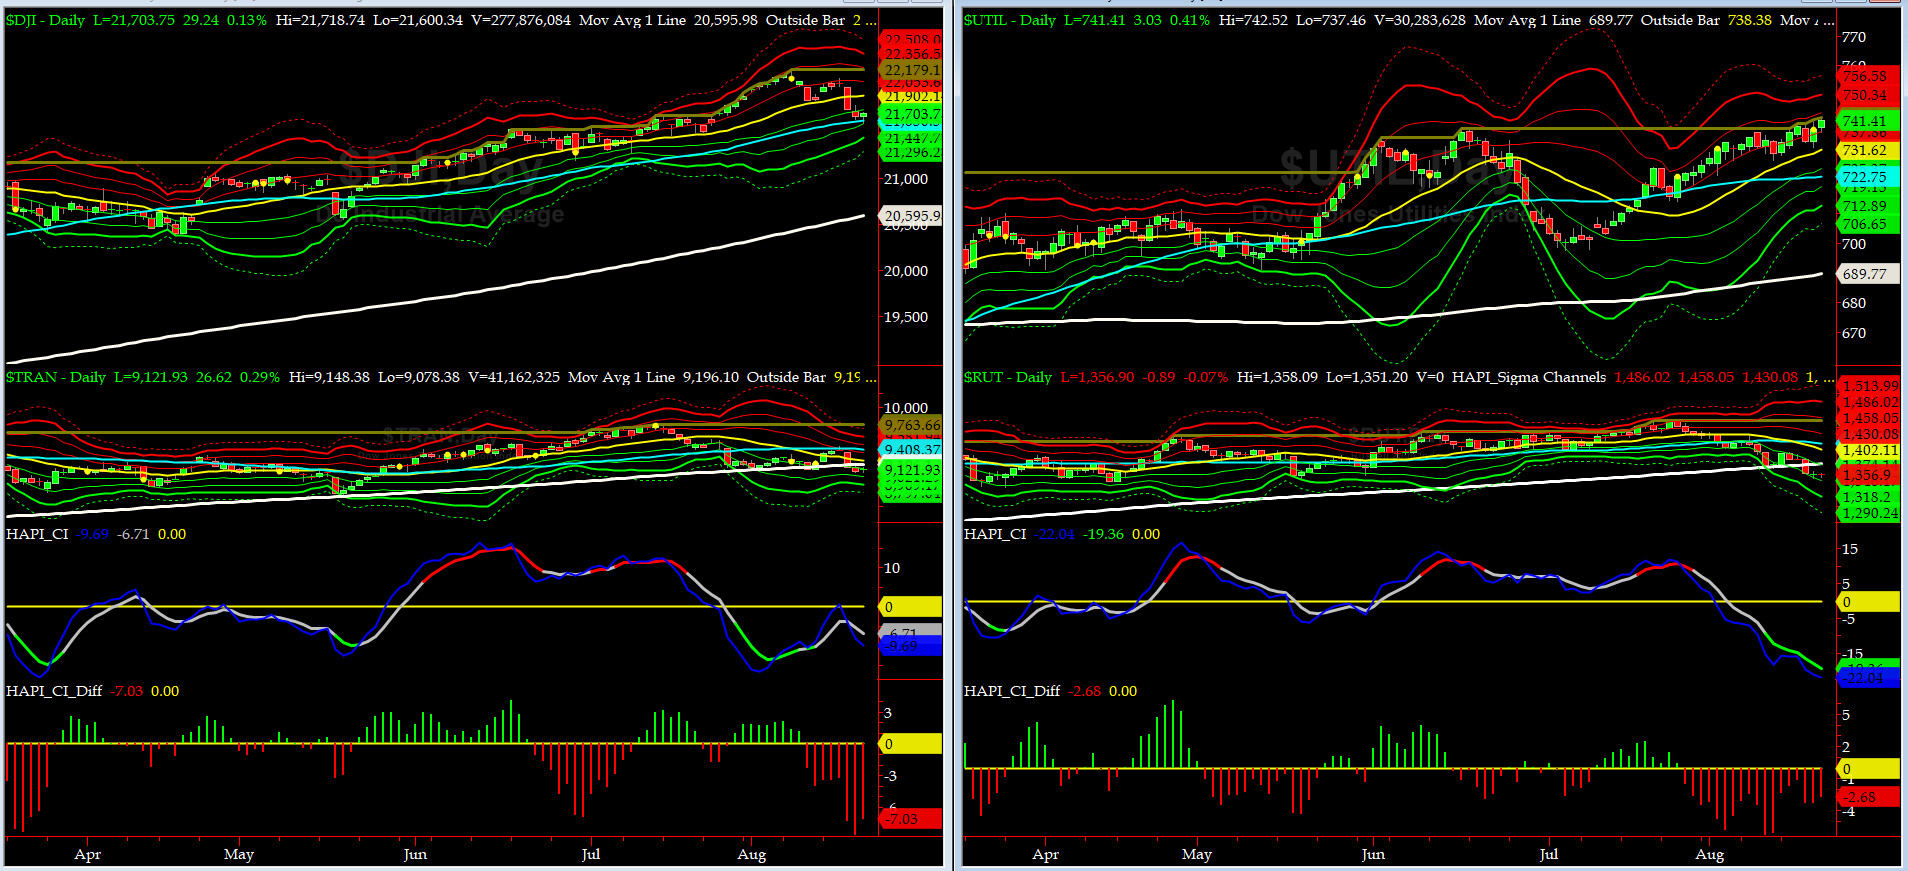
Canaries [in the Coal Mine] Chart for DJ TRAN & RUT Indices
200-Day MA DJ TRAN = 9196 or 0.8% above DJ TRAN (max observed in last 7 yrs = 20.2%, min = -20.3%)
200-Day MA RUT = 1376 or 1.4% above RUT (max observed in last 7 yrs = 21.3%, min = -22.6%)
DJ Transportation Index (proxy for economic conditions 6 to 9 months hence) had a tough day on Thursday and closed below its 200 day MA.
Russell 2000 Small Caps Index (proxy for Risk ON/OFF) has had two rough weeks, back to back, since Don Grumpino 45 took over the White House. Is RISK still ON? No Mas....
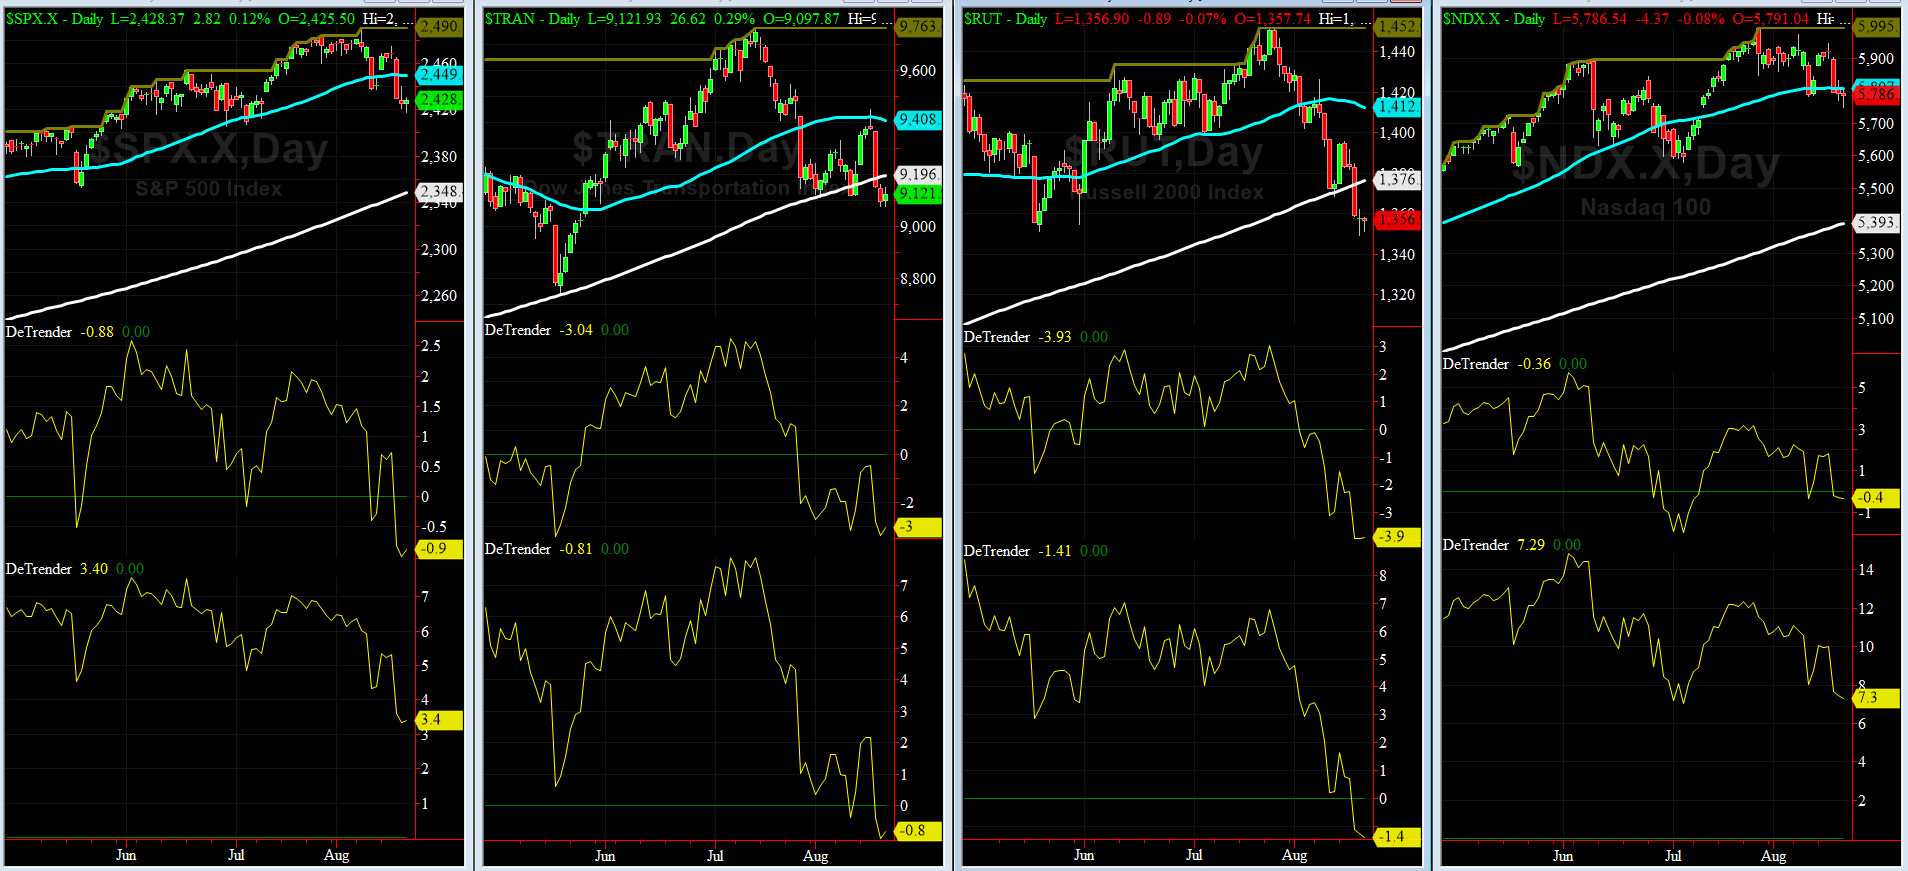
DeTrenders Charts for SPX, NDX, TRAN & RUT Indices
50-Day MA SPX = 2449 or 0.9% above SPX (max observed in last 7 yrs = +8.6%, min = -9.3%)
200-Day MA SPX = 2348 or 3.4% below SPX (max observed in last 7 yrs = 15.2%, min = -14%)
Only TWO of our EIGHT DeTrenders are POSITIVE while the DeTrenders for DJ Tran & RUT will continue to be harbingers of future price behavior in broad indices.
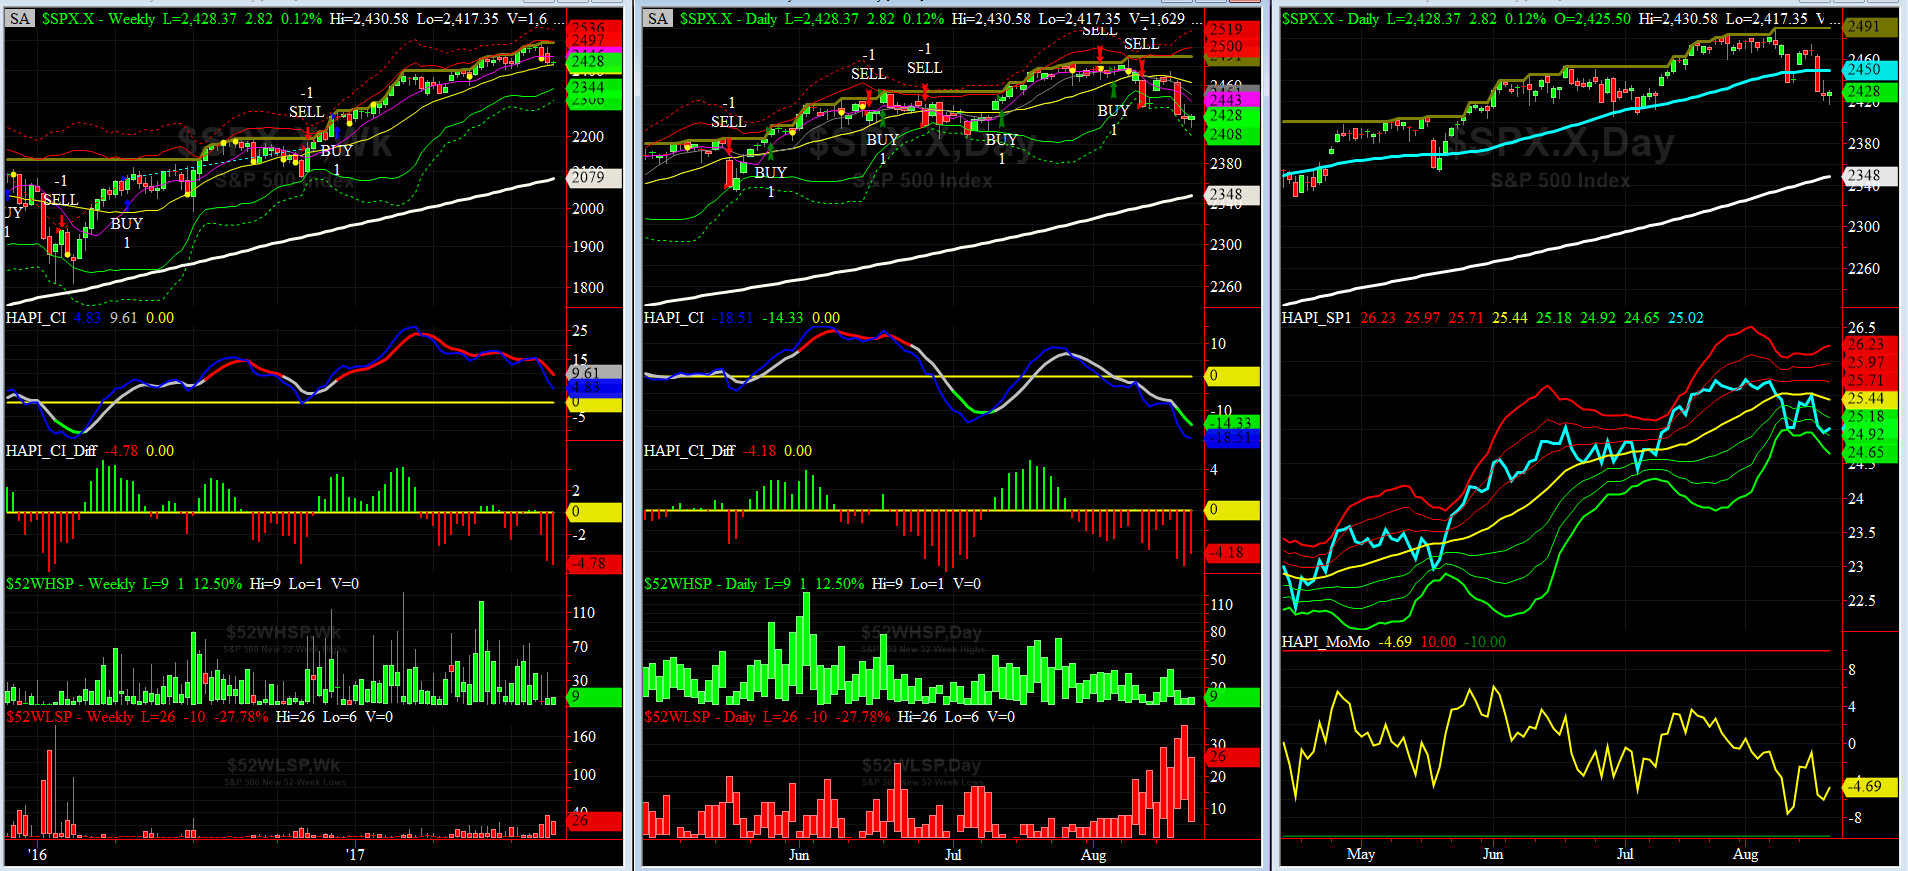
HA_SP1_Momo Chart
WEEKLY Timing Model = on a BUY Signal since Friday 12/16/16 CLOSE at 2258
DAILY Timing Model = on a SELL Signal since Thursday 8/10/17 CLOSE at 2438
Max SPX 52wk-highs reading last week = 39 (over 120-140, the local maxima is in)
Max SPX 52wk-Lows reading last week = 36 (over 40-60, the local minima is in)
HA_SP1 closed near its -2 sigma channels
HA_Momo = -4.7 (reversals most likely occur above +10 or below -10)
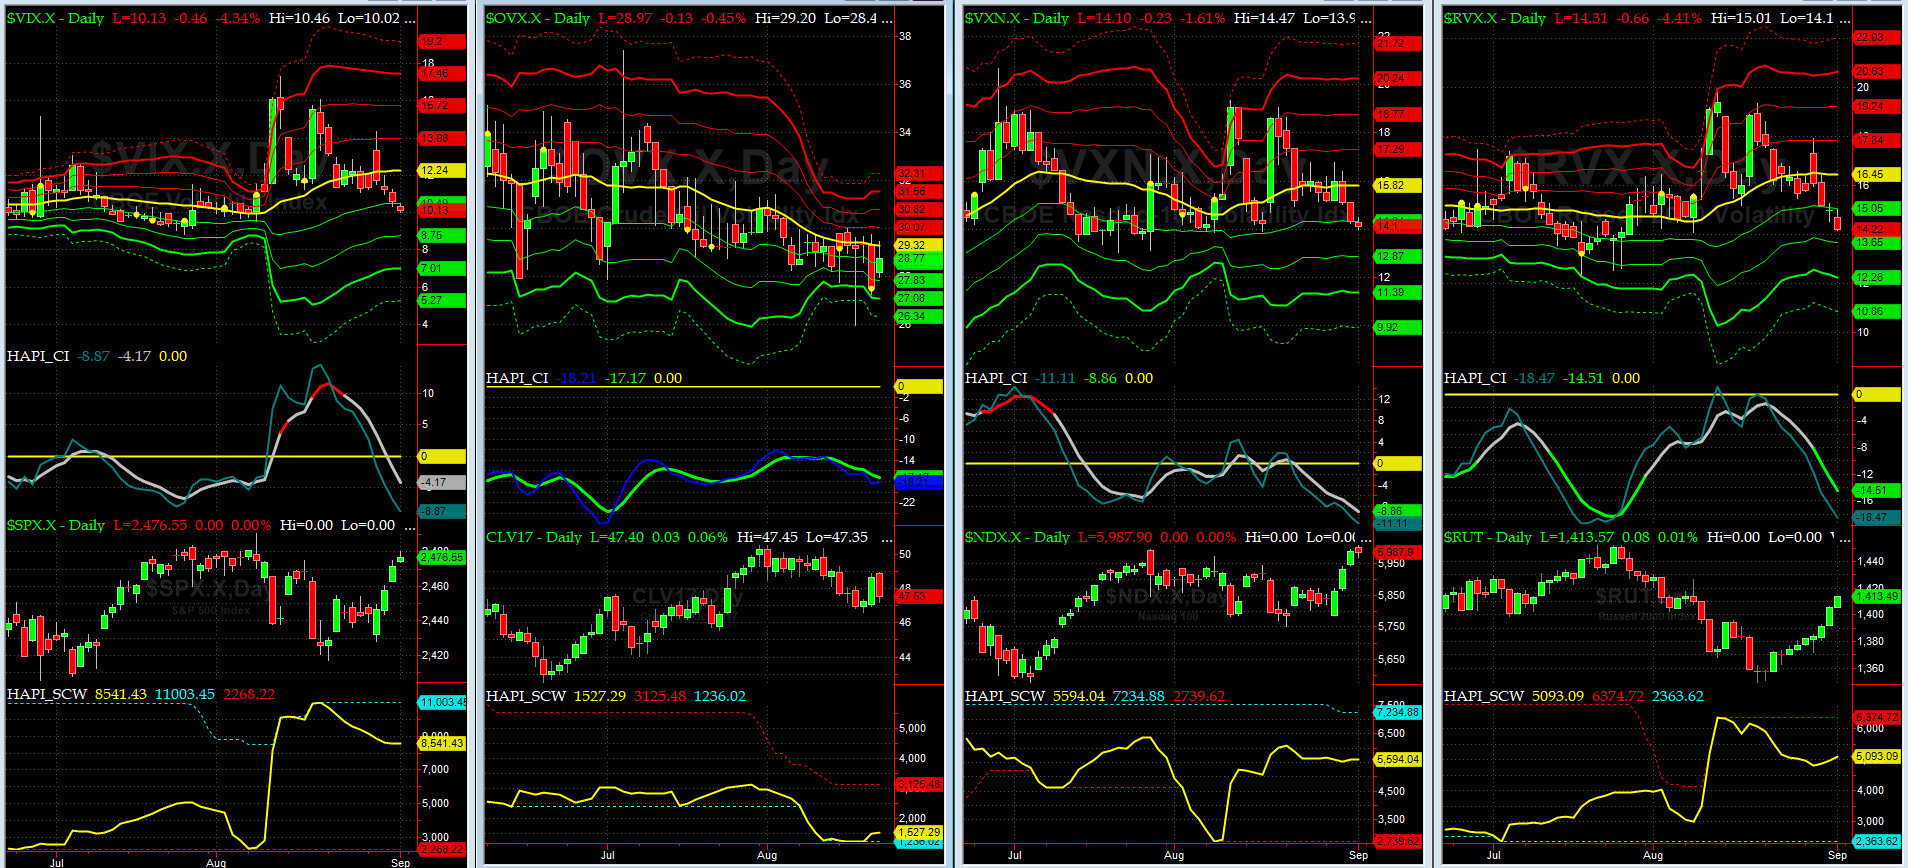
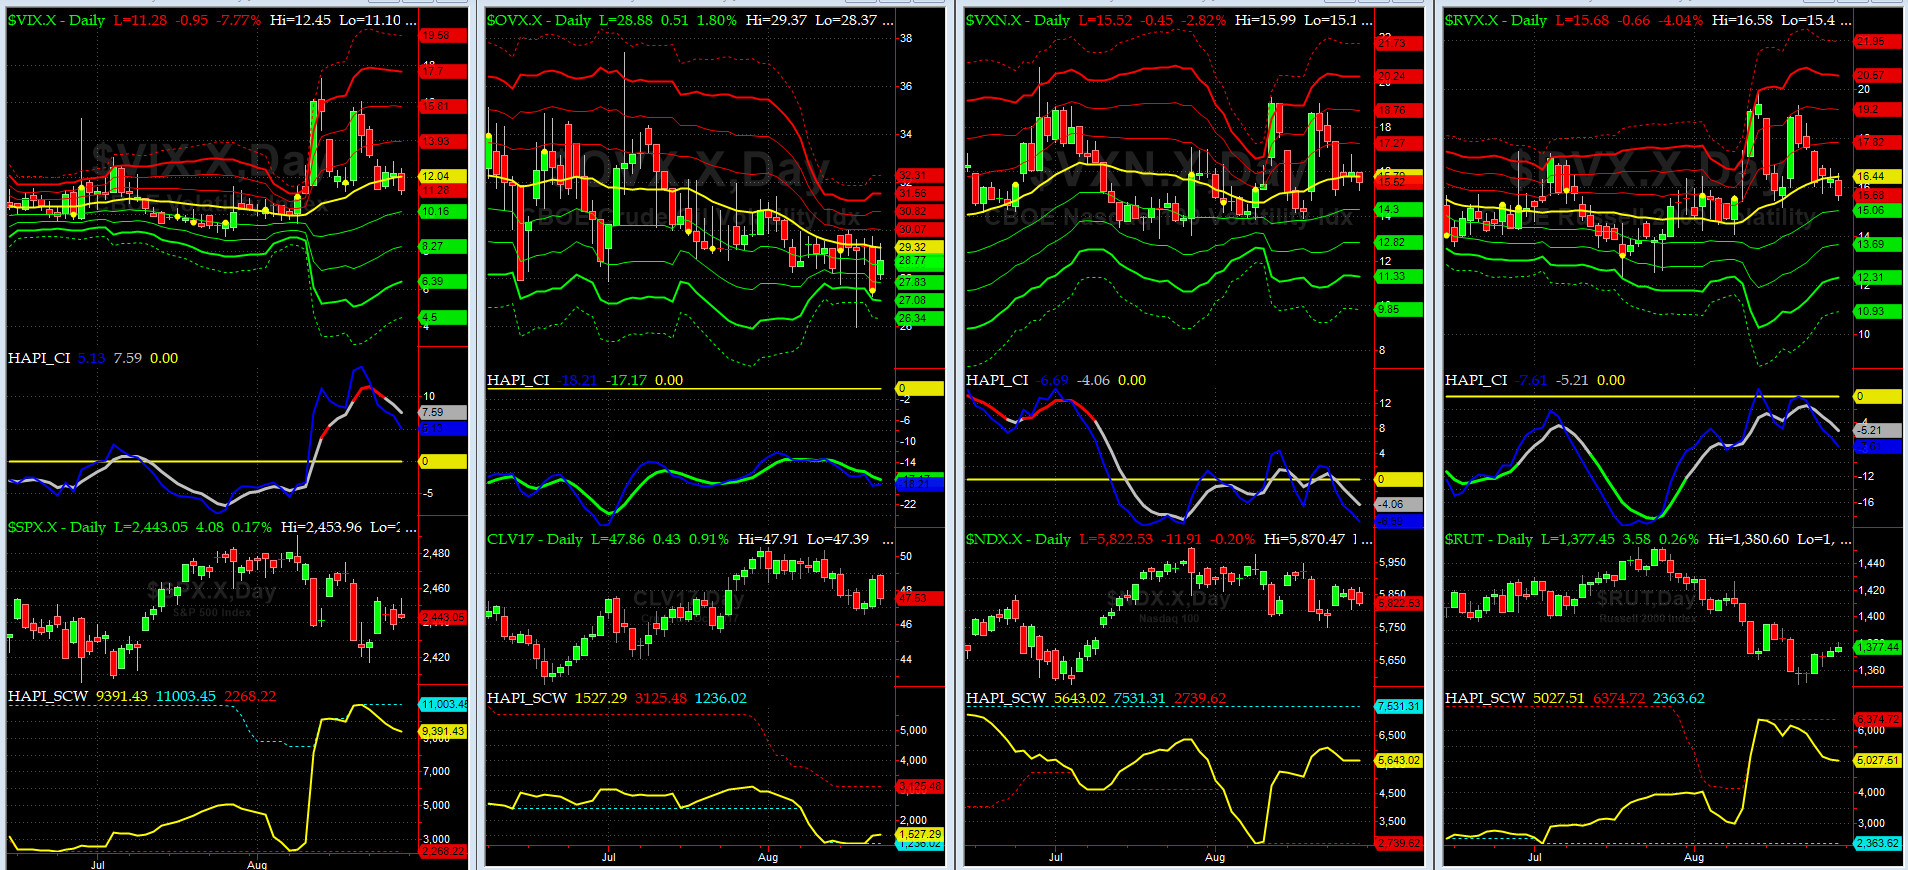
Vol of the Vols Chart
VIX currently stands at 13.2, or just at its +1 sigma (remember it's the VIX volatility pattern ( its sigma channels) that matters, and not the level of VIX itself (this is per Dr. Robert Whaley, a great mentor and inventor of original VIX, now called VXO ). VIX usually peaks around a test of its +4 sigma).
Last Thursday we saw the retest we talked about a week ago..... Vols should subside for now, ioho.
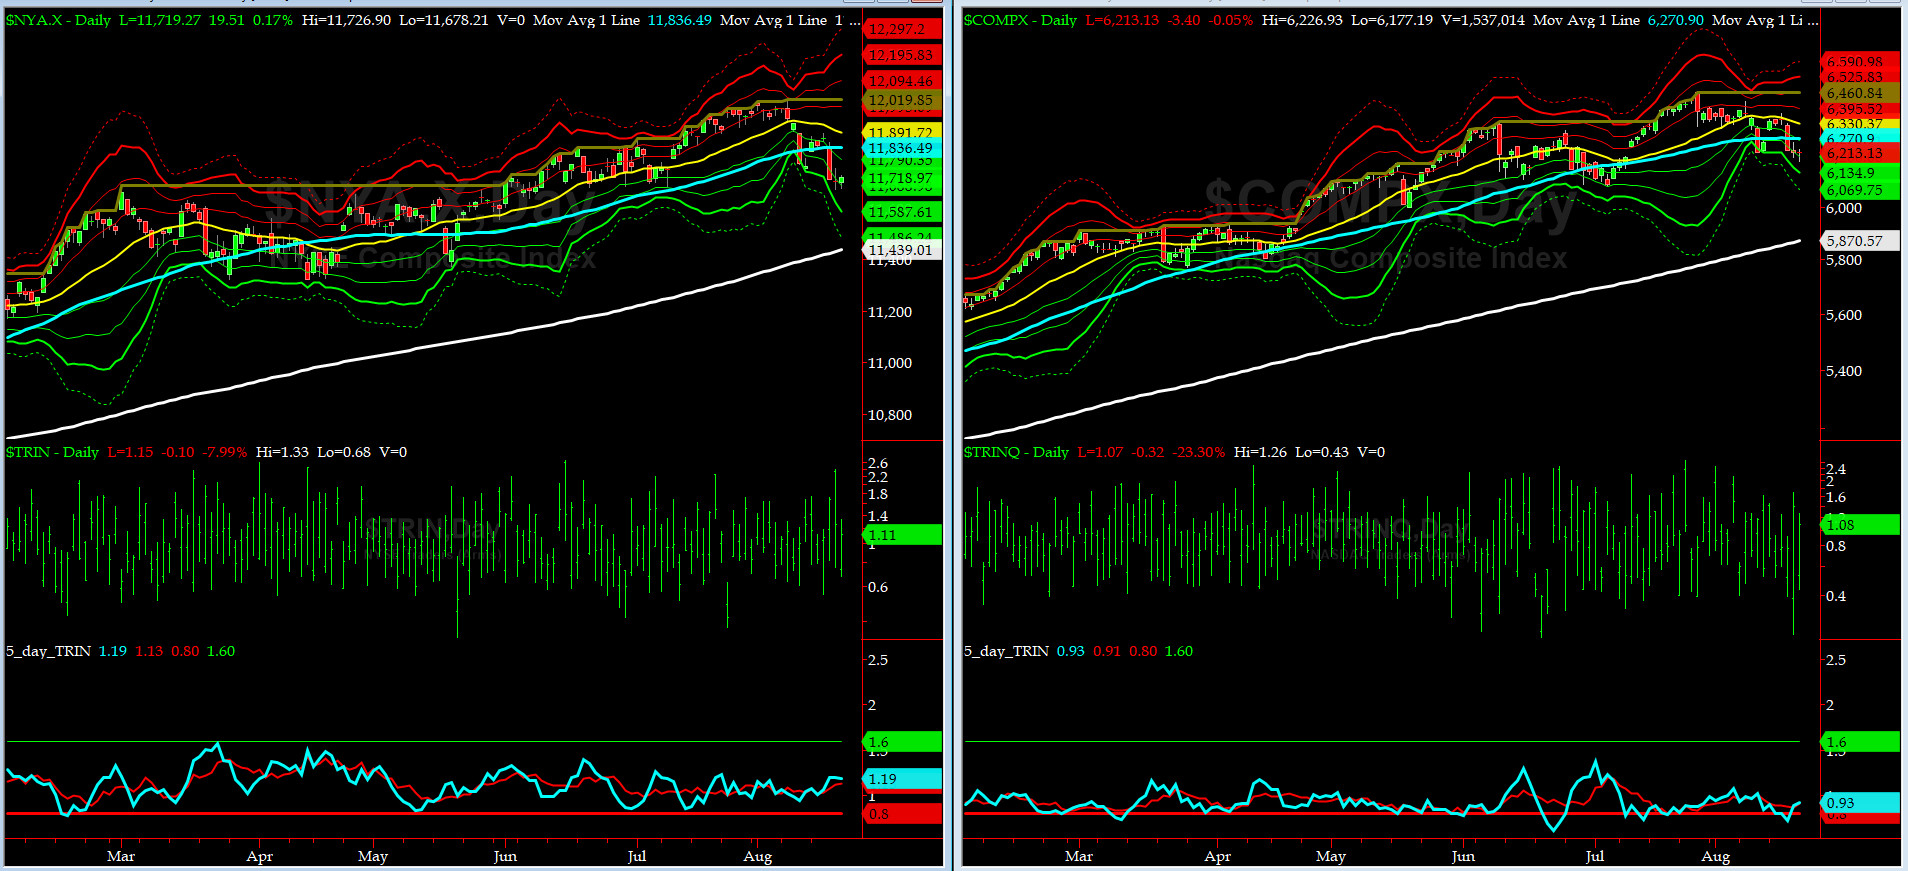
5-day TRIN & TRINQ Charts
Both NYSE & NASDAQ 5-day TRINs are in NEUTRAL Zone. No Signal here.....
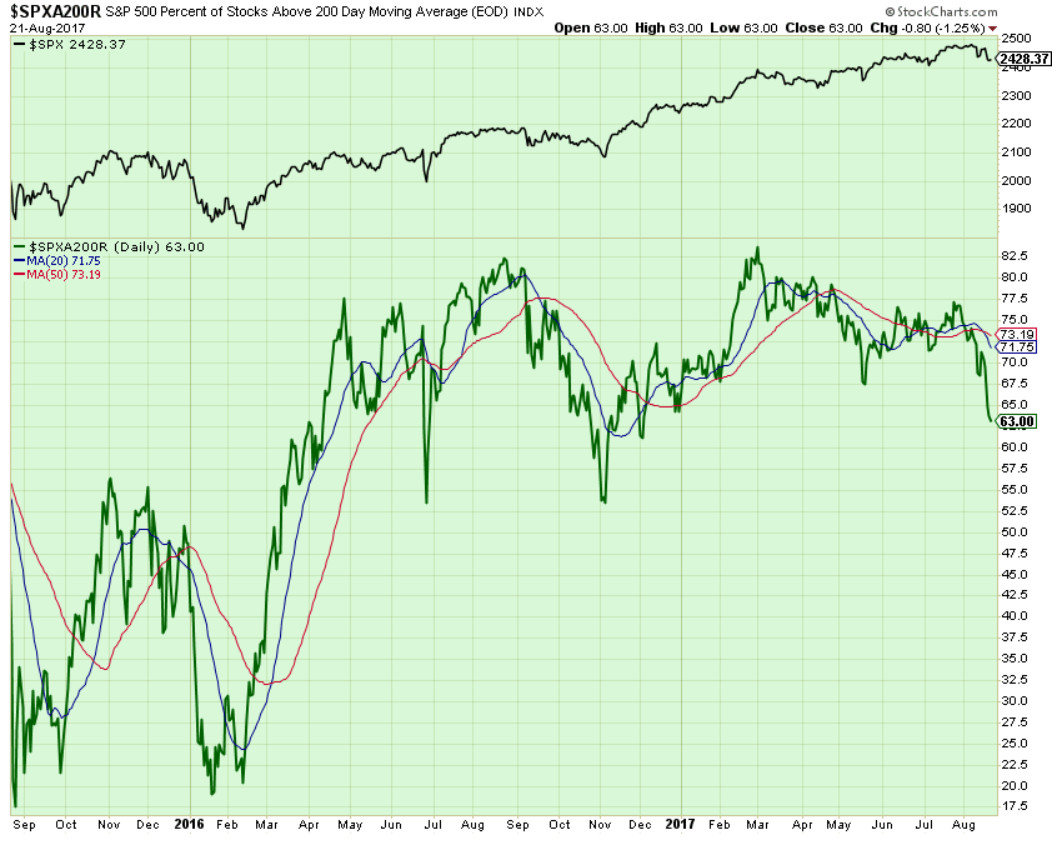
Components of SPX above their respective 200day MA Chart
A failure at 55% - 60% for this scoring indicator would make it pretty rough for this market to crawl back up.
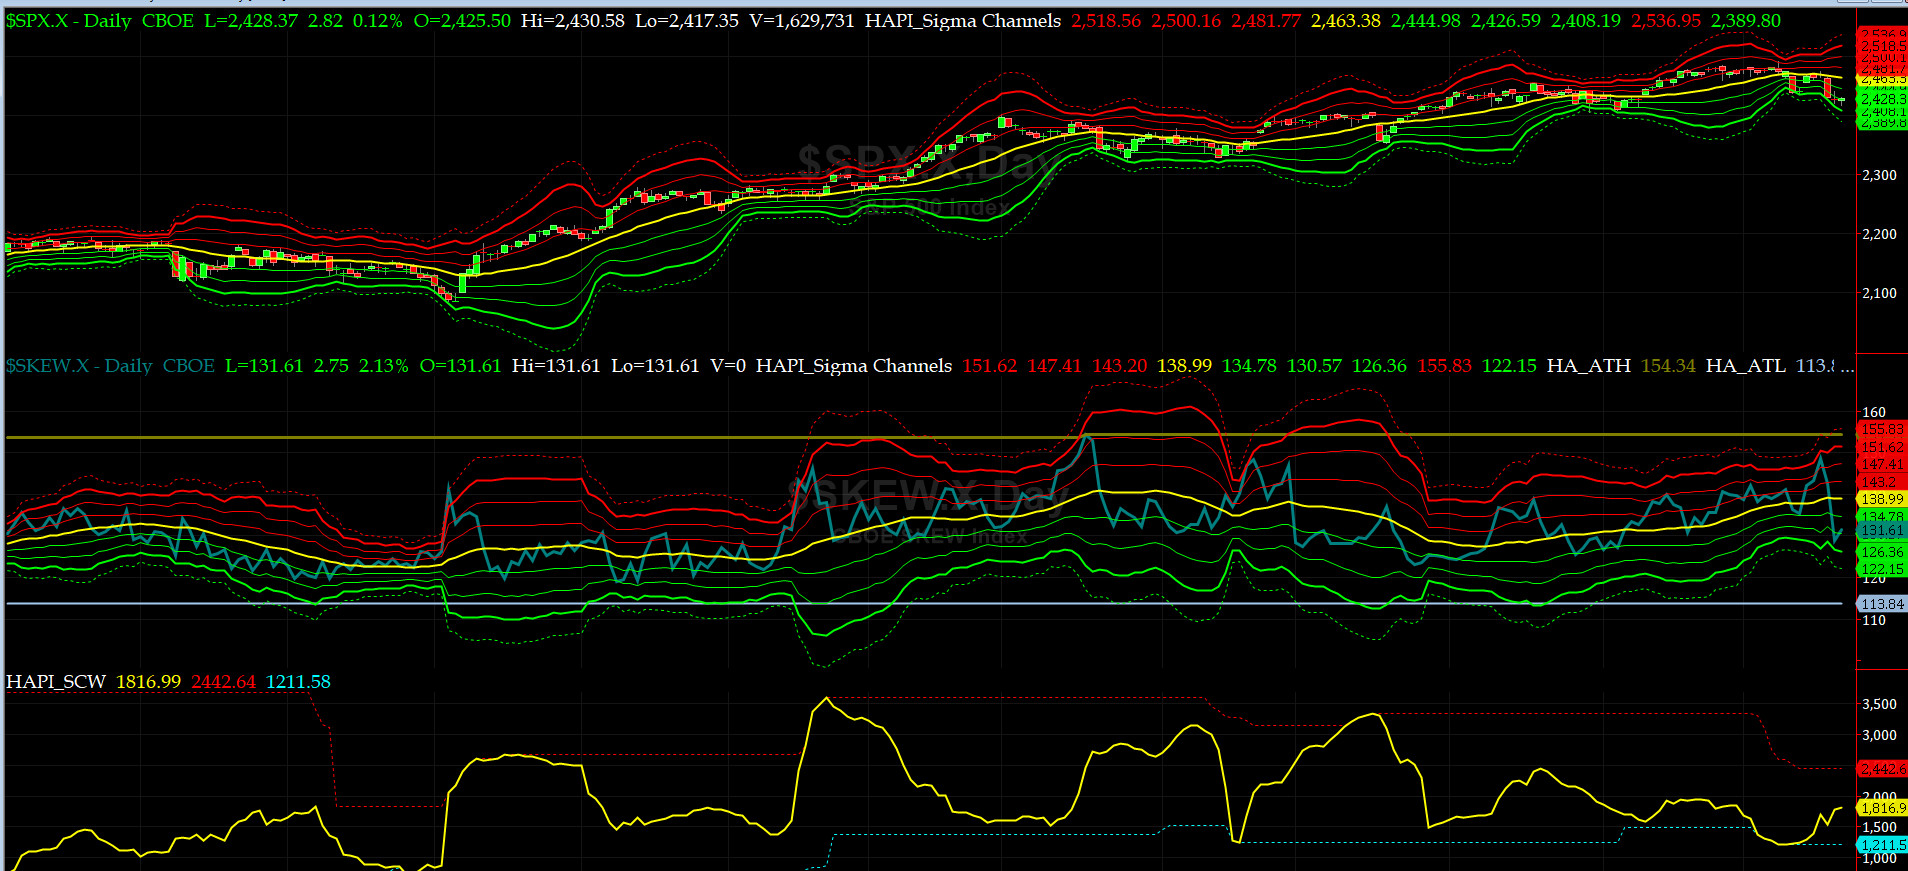
SPX SKEW (Tail Risk) Chart
Last week SPX SKEW (Tail Risk) ratcheted up to 148.6, or its +3 sigma, on Wednesday (ahead of Thrusday bloodbath) but then came back down on Thursday & Friday and closed on Monday at 131.6 near its -2 sigma (normal = 120-125, range 100-150).
Is all quiet on the Eastern & Mid-Western Fronts? Smart Money thinks YES.
3-month VIX Futures Spread(VX) Chart
The Long SEP, Short DEEZ Spread has a negative slope. SPX should head higher.

HA_SP2 Chart
HA_SP2 = 28.4 (Buy signal <= 25, Sell Signal >= 75)
Our favorite prop indicator put in a bullish divergence last week. Expect higher SPX prices in the next 5 to 7 sessions.
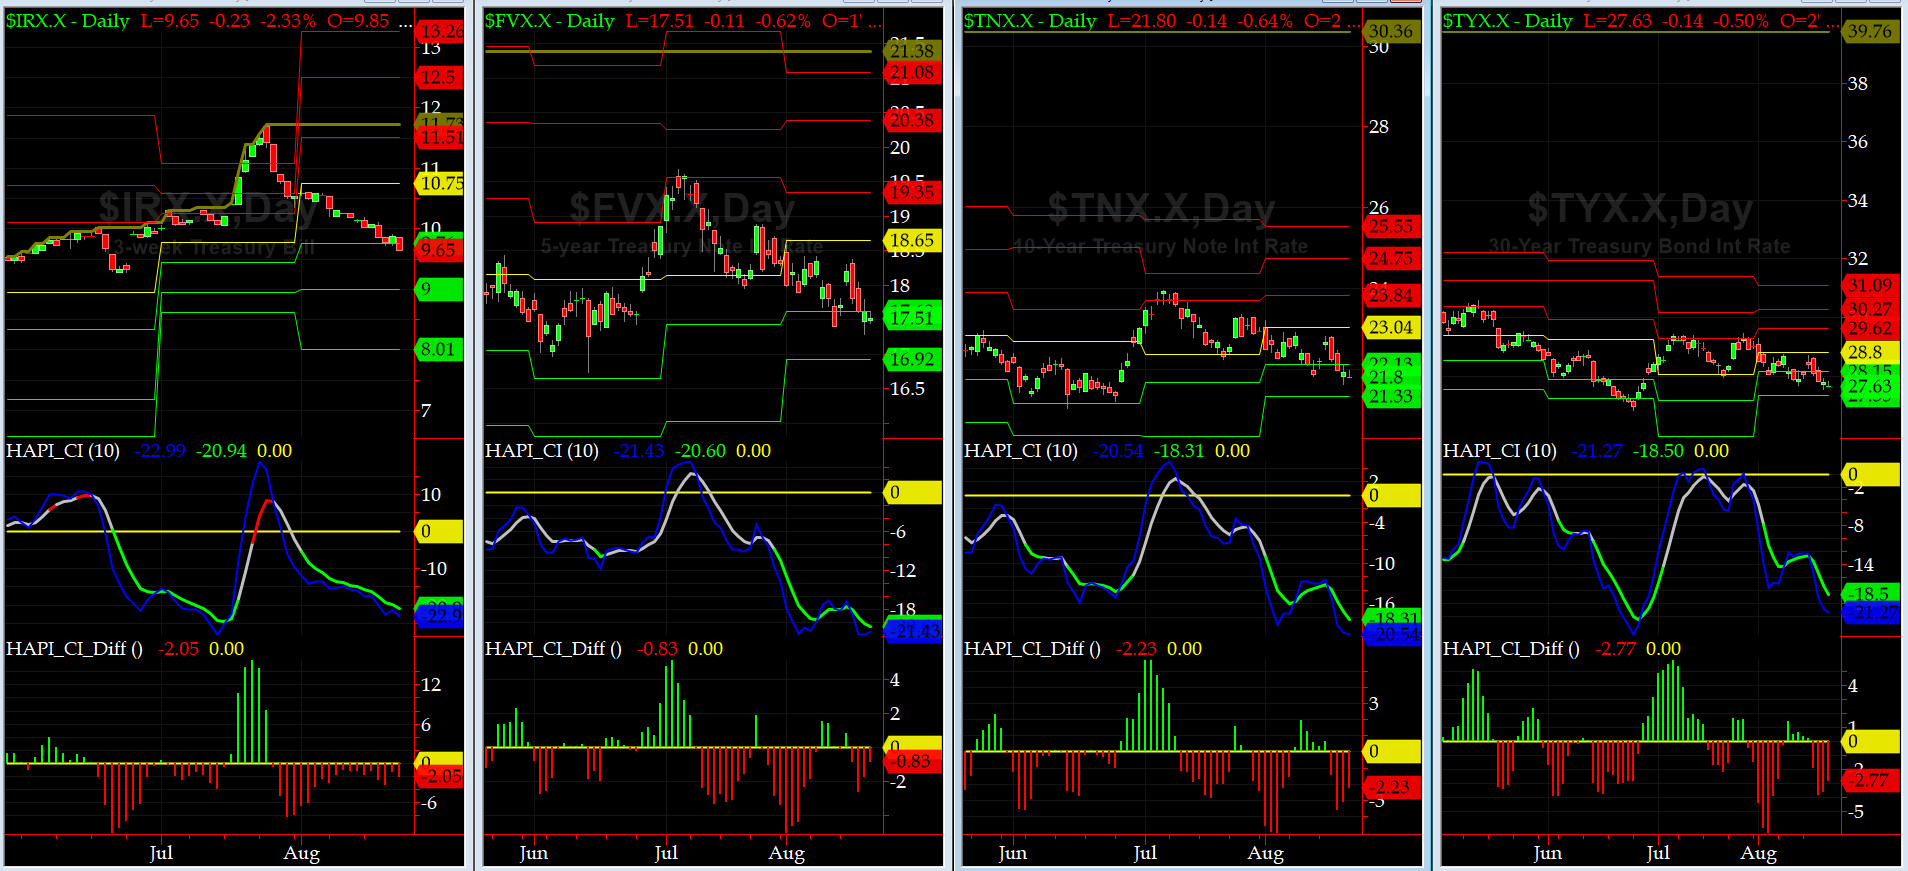
US Treasury T-Notes & T-Bonds Yields Chart
The Treasury Market rallied hard for second week in a row as YTMs sank across the Yield Curve.
Fari Hamzei
|


 Proactive Market Timing