|
Tuesday, September 5, 2017, 2315ET
Market Timing Charts, Analysis & Commentary for Issue #208
Timer Charts of S&P-500 Cash Index (SPX) + NASDAQ-100 Cash Index (NDX)
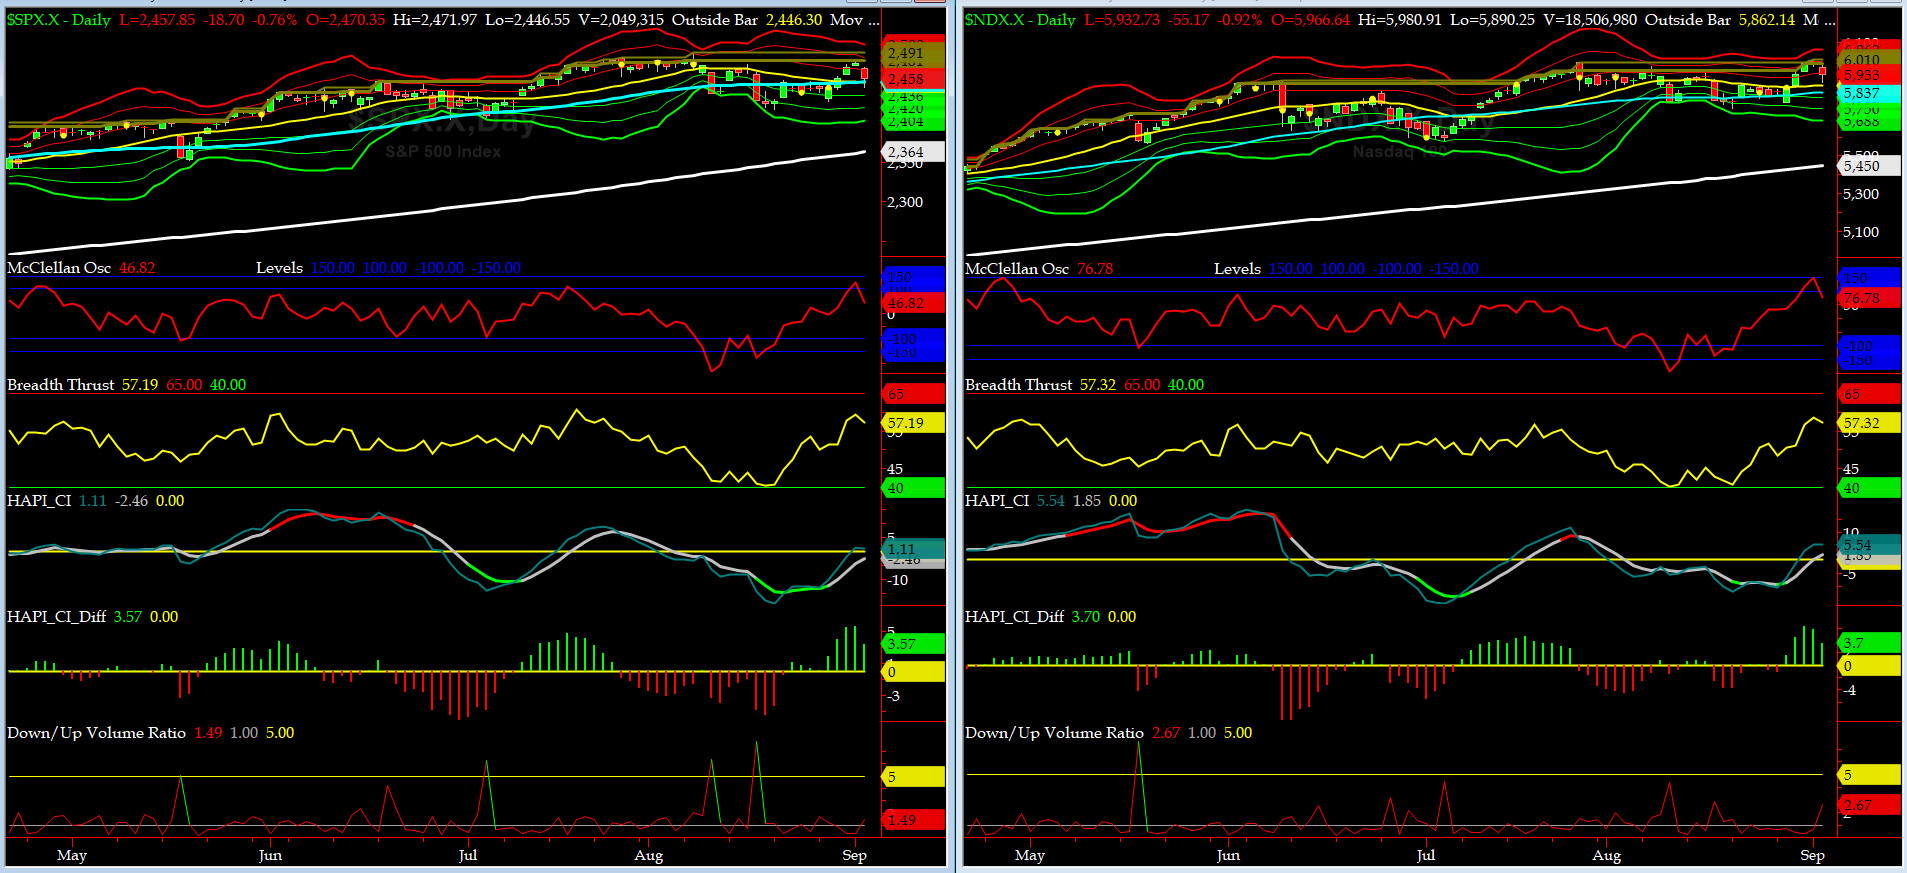
Most recent S&P-500 Cash Index (SPX): 2457.85 up +14.80 (up +0.6%) for the six trading days ending on Tuesday, September 5, 2017, which closed just about its -1 sigma & below its 50 day MA.
SPX ALL TIME INTRADAY HIGH = 2490.87 (reached on Tuesday, Aug 8, 2017)
SPX ALL TIME CLOSING HIGH = 2480.91 (reached on Monday, Aug 7, 2017)
Current DAILY +2 Sigma SPX = 2484 with WEEKLY +2 Sigma = 2492
Current DAILY 0 Sigma (20 day MA) SPX = 2452 with WEEKLY 0 Sigma = 2434
Current DAILY -2 Sigma SPX = 2420 with WEEKLY -2 Sigma = 2376
NYSE McClellan Oscillator = +47 (-150 is start of the O/S area; around -275 to -300 area or lower, we go into the �launch-pad� mode, over +150, we are in O/B area)
NYSE Breadth Thrust = 57 (40 is considered as oversold and 65 as overbought)
We saw a good rally last week specially in NDX and RUT. On Tuesday, news of DPRK's first nuke test durnig Don Grumpino's presidency rattled the US Markets.
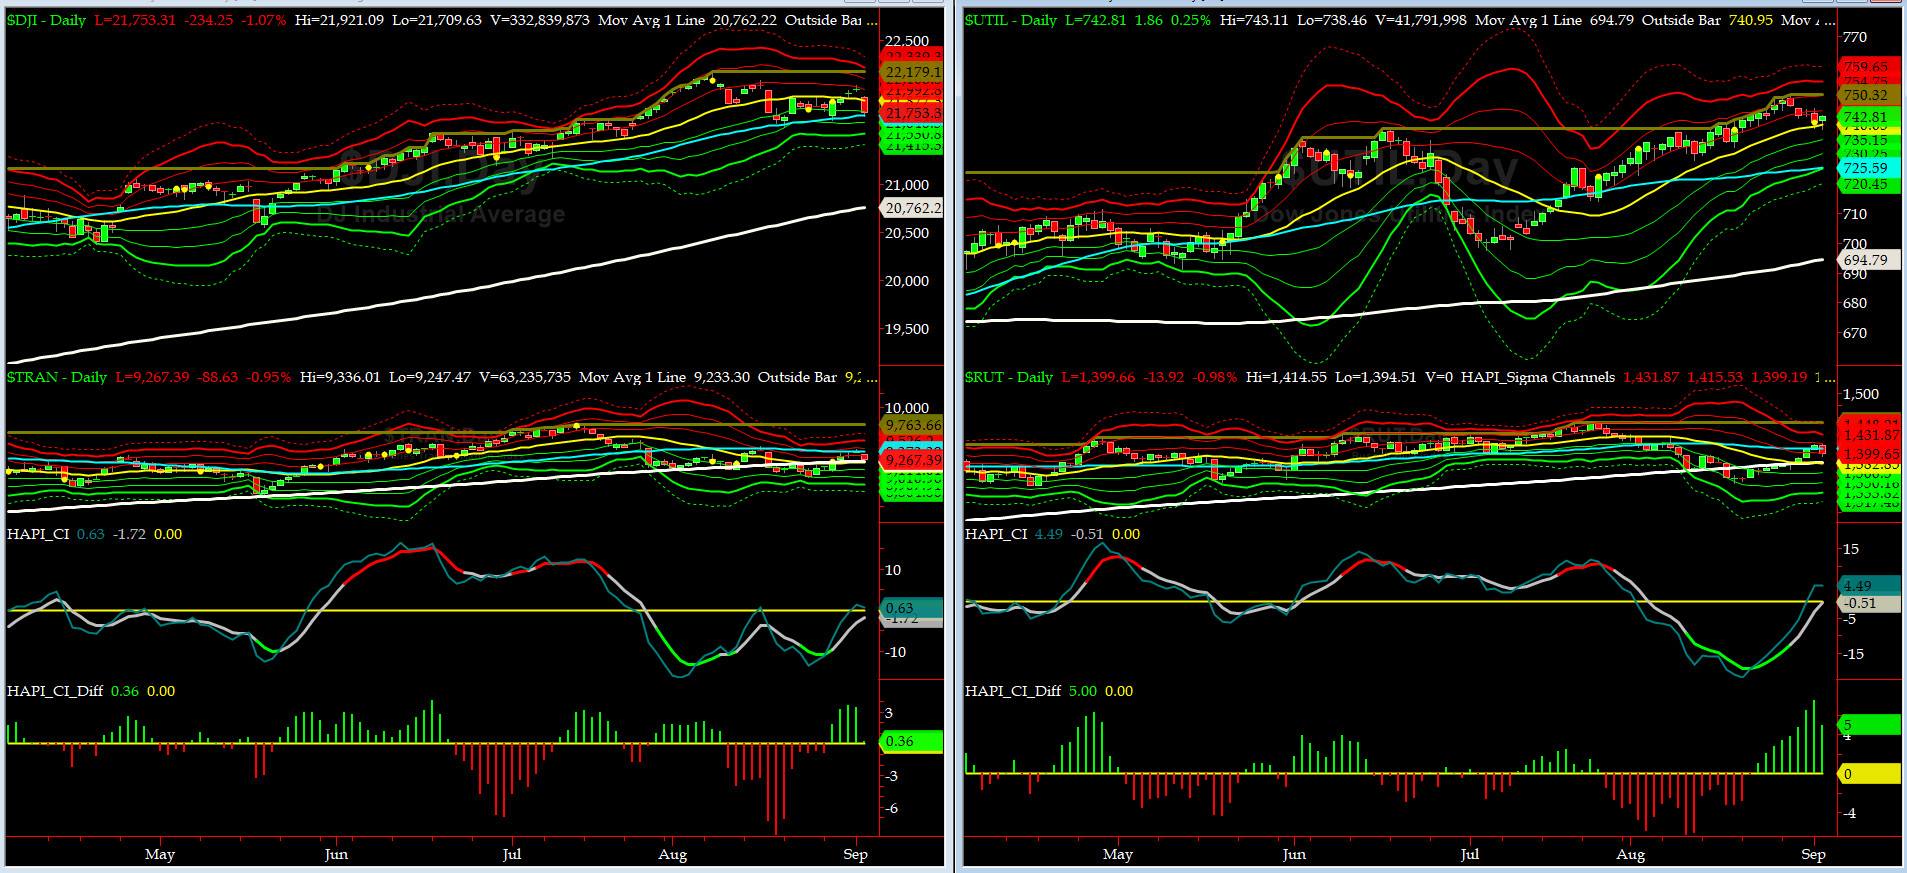
Canaries [in the Coal Mine] Chart for DJ TRAN & RUT Indices
200-Day MA DJ TRAN = 9233 or 0.4% above DJ TRAN (max observed in last 7 yrs = 20.2%, min = -20.3%)
200-Day MA RUT = 1383 or 0.2% above RUT (max observed in last 7 yrs = 21.3%, min = -22.6%)
DJ Transportation Index (proxy for economic conditions 6 to 9 months hence) came back strong last week, but sold off today.
Russell 2000 Small Caps Index (proxy for Risk ON/OFF) showed a renewal in its strenght by closing above its 50 day MA but gave that up today.
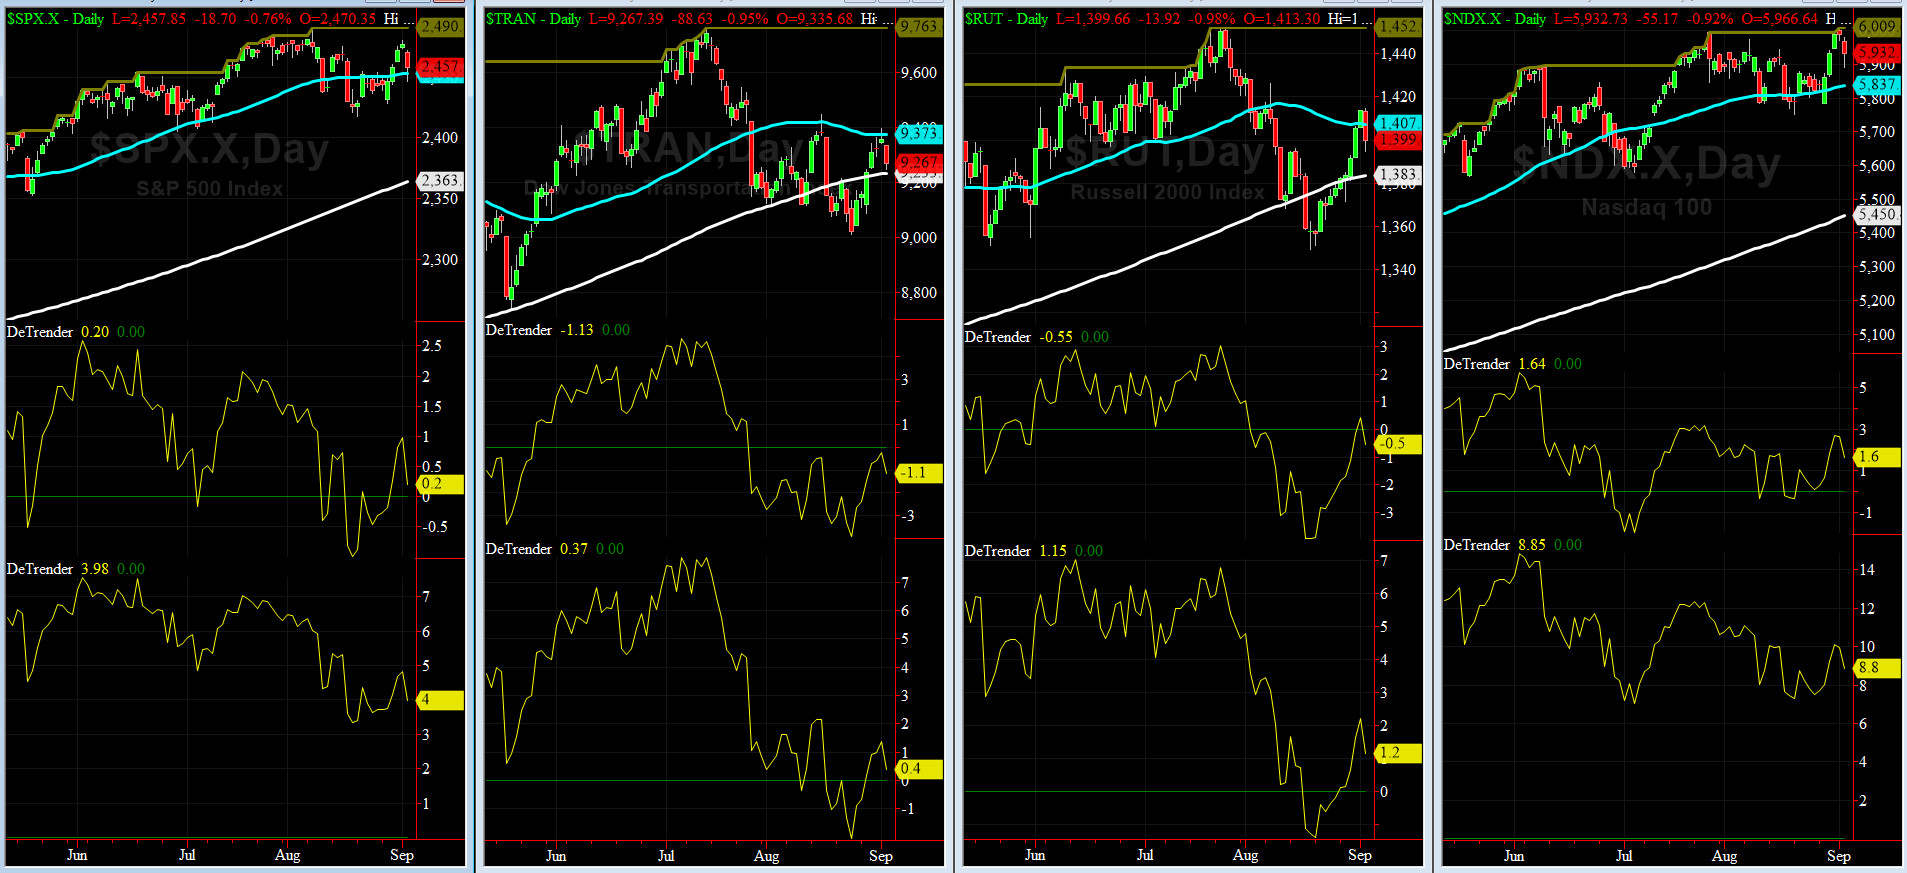
DeTrenders Charts for SPX, NDX, TRAN & RUT Indices
50-Day MA SPX = 2453 or 0.2% above SPX (max observed in last 7 yrs = +8.6%, min = -9.3%)
200-Day MA SPX = 2363 or 4% below SPX (max observed in last 7 yrs = 15.2%, min = -14%)
Only TWO of our EIGHT DeTrenders are NEGATIVE while the DeTrenders for DJ Tran & RUT will continue to be harbingers of future price behavior in broad indices.
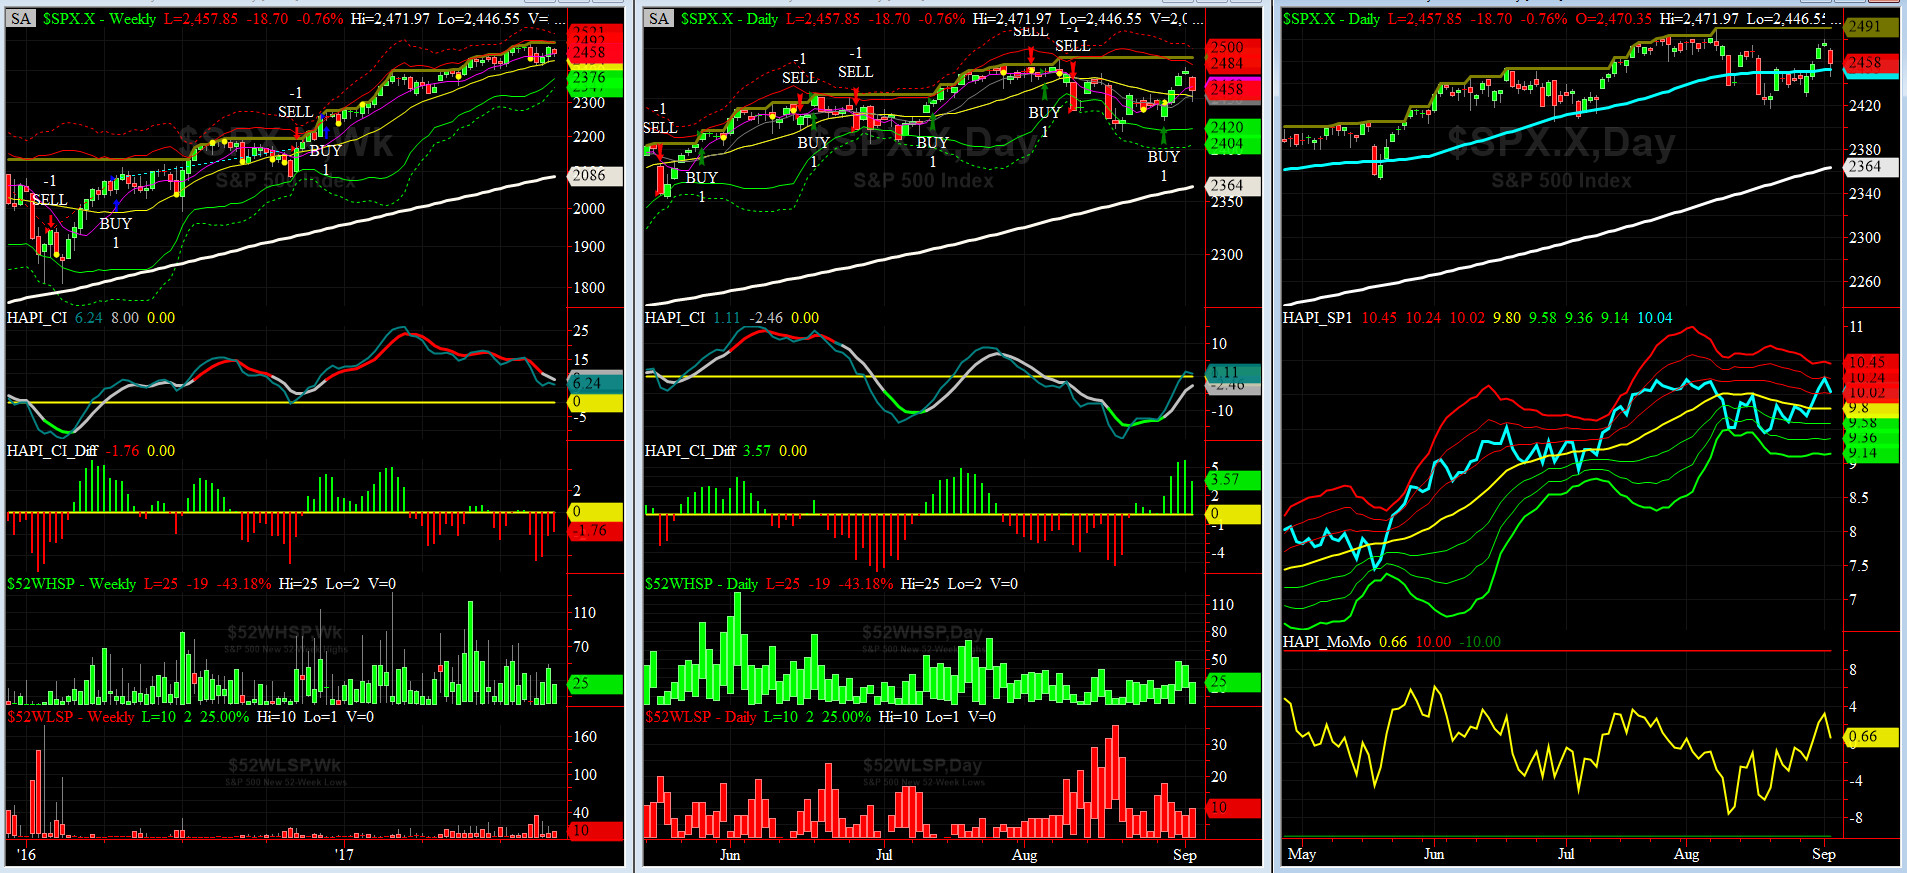
HA_SP1_Momo Chart
WEEKLY Timing Model = on a BUY Signal since Friday 12/16/16 CLOSE at 2258
DAILY Timing Model = on a BUY Signal since Tuesday 8/29/17 CLOSE at 2446
Max SPX 52wk-highs reading last week = 18 (over 120-140, the local maxima is in)
Max SPX 52wk-Lows reading last week = 18 (over 40-60, the local minima is in)
HA_SP1 closed near its +1 sigma channels
HA_Momo = +0.66 (reversals most likely occur above +10 or below -10)
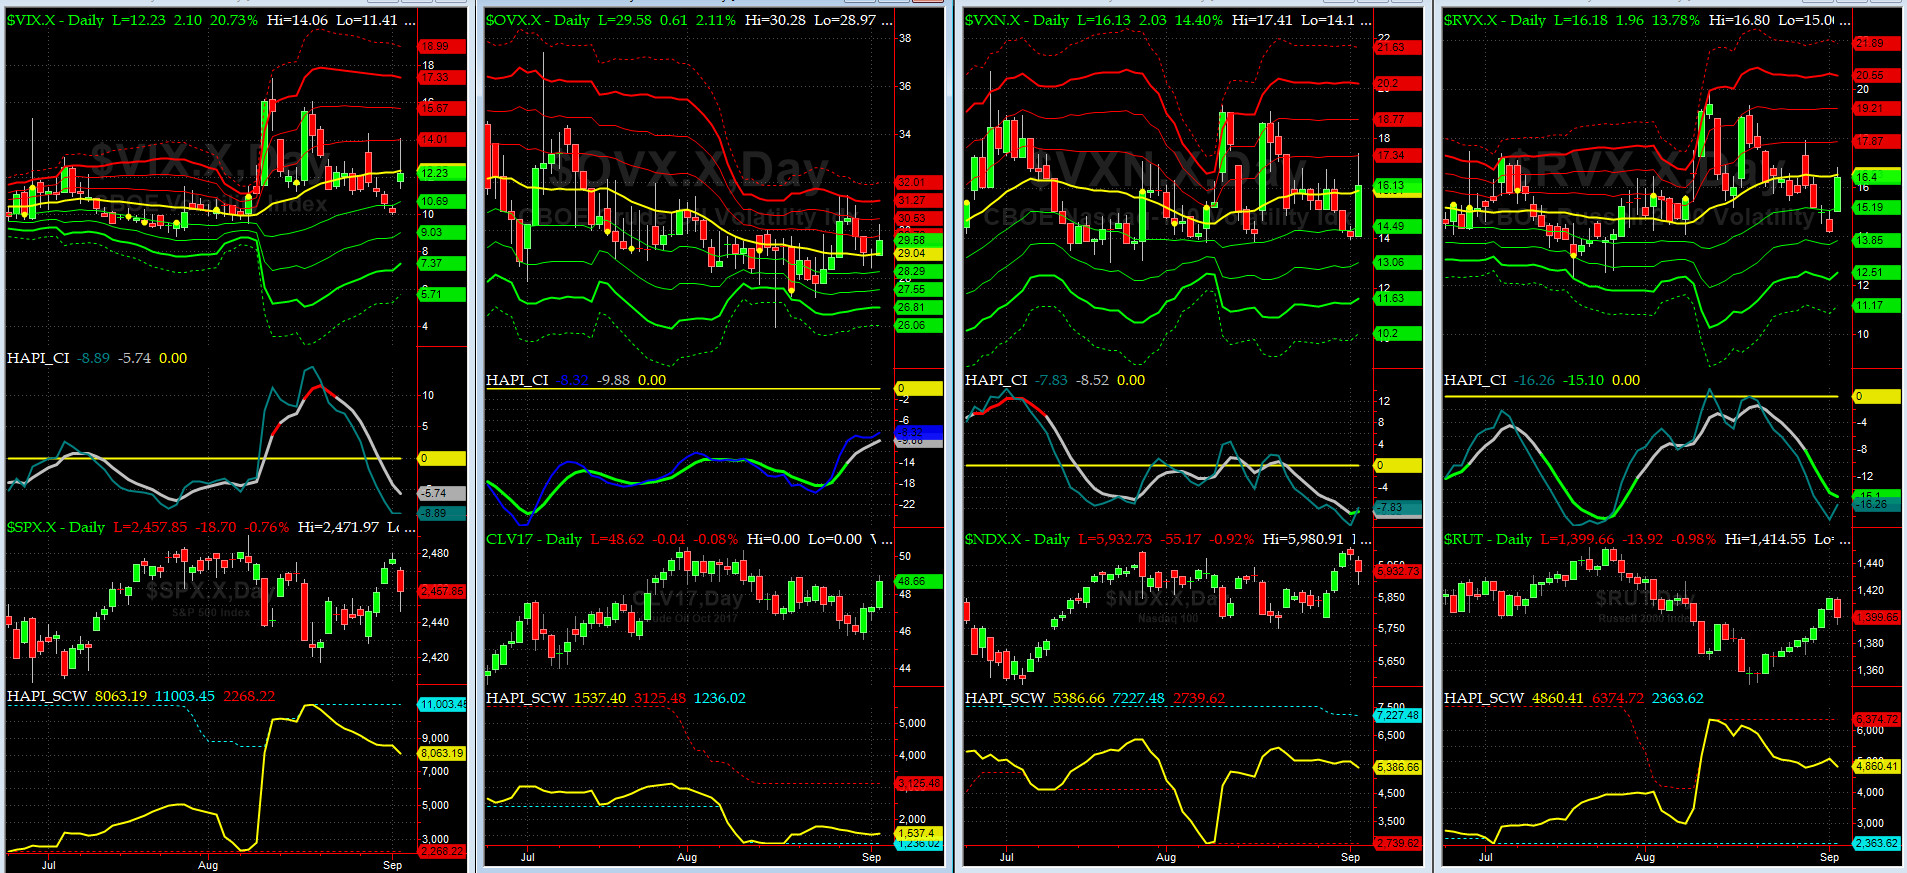
Vol of the Vols Chart
VIX currently stands at 12.23, or just about its zero sigma (remember it's the VIX volatility pattern ( its sigma channels) that matters, and not the level of VIX itself (this is per Dr. Robert Whaley, a great mentor and inventor of original VIX, now called VXO ). VIX usually peaks around a test of its +4 sigma).
Last week, VIX complex sold off but today it had a 20% gain. Still fairly quiet.
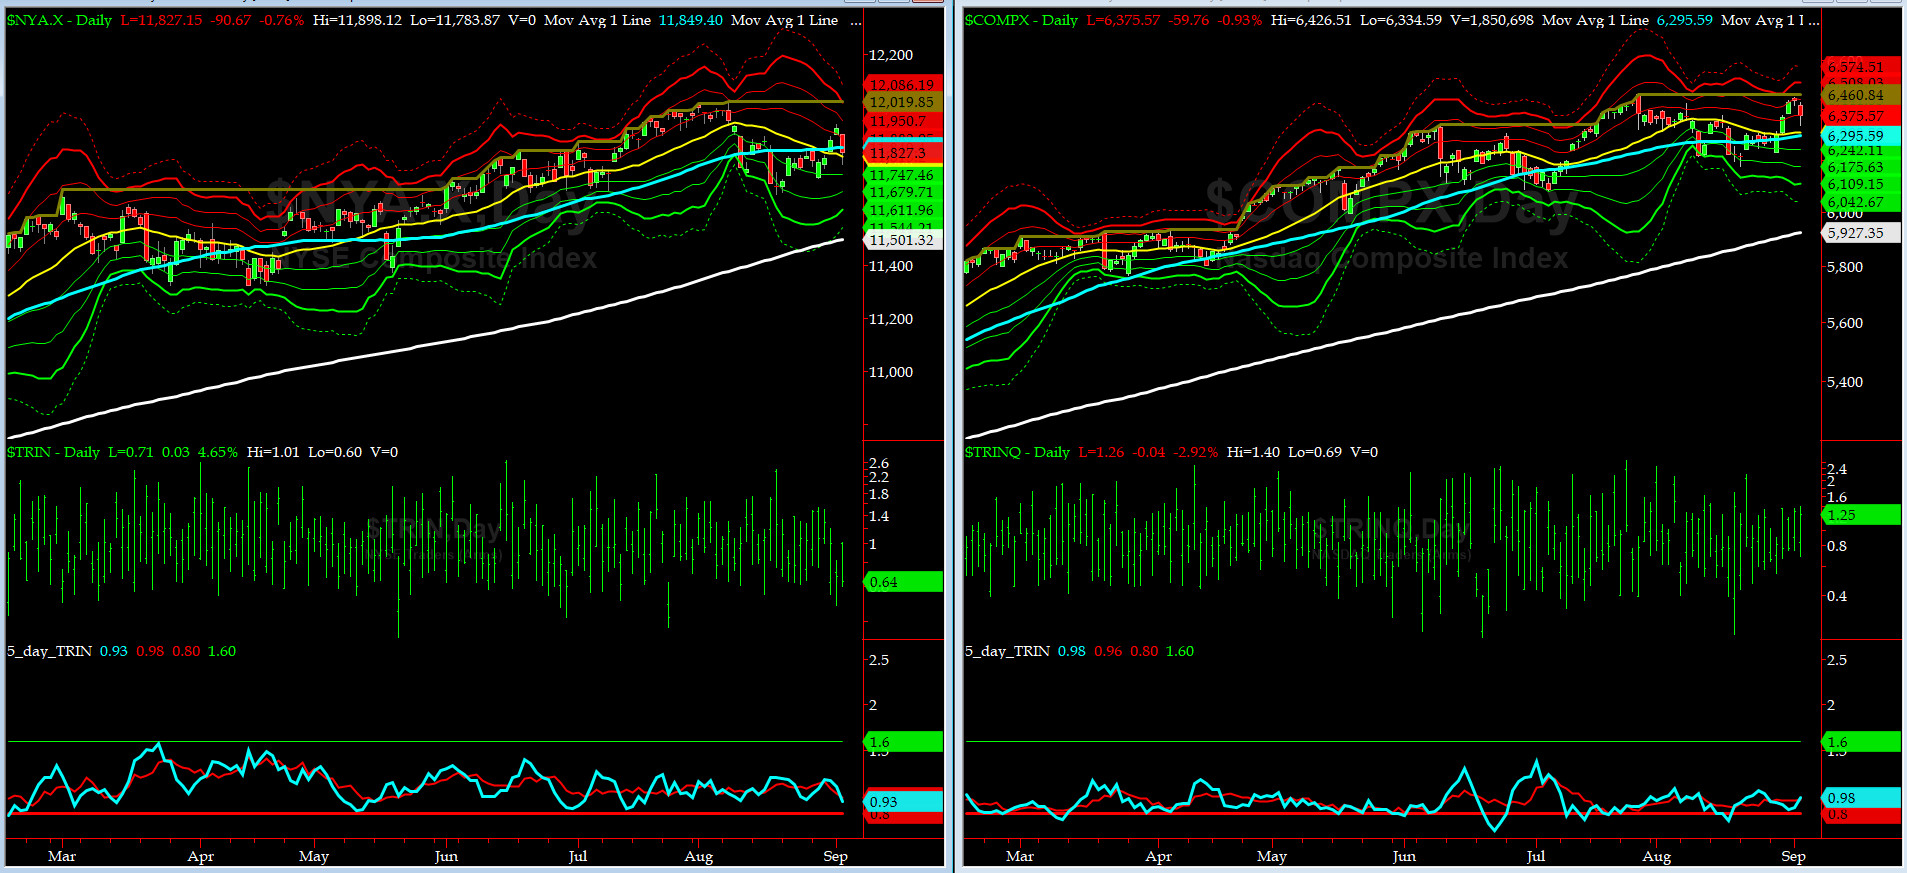
5-day TRIN & TRINQ Charts
Both NYSE & NASDAQ 5-day TRINs are in NEUTRAL Zone. No Signal here.....
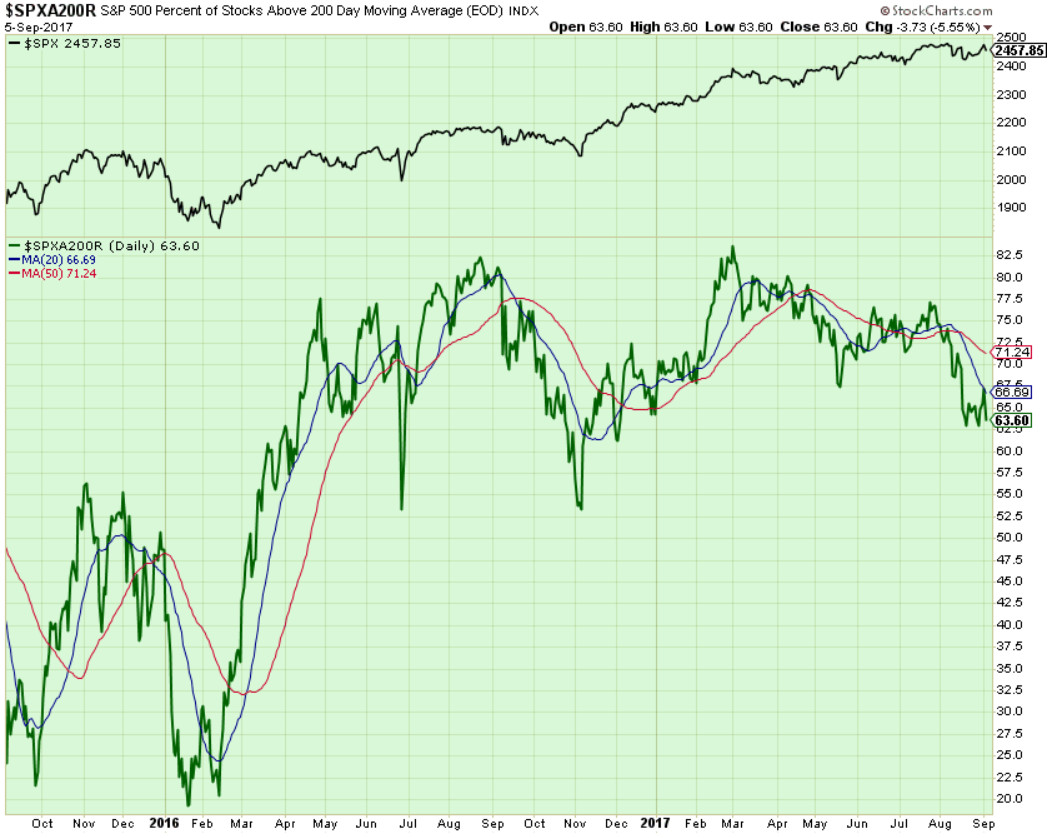
Components of SPX above their respective 200day MA Chart
During the past week, this scoring indicator AGAIN tested its 62.5% level. We are still watching 55% to 60% area carefully.
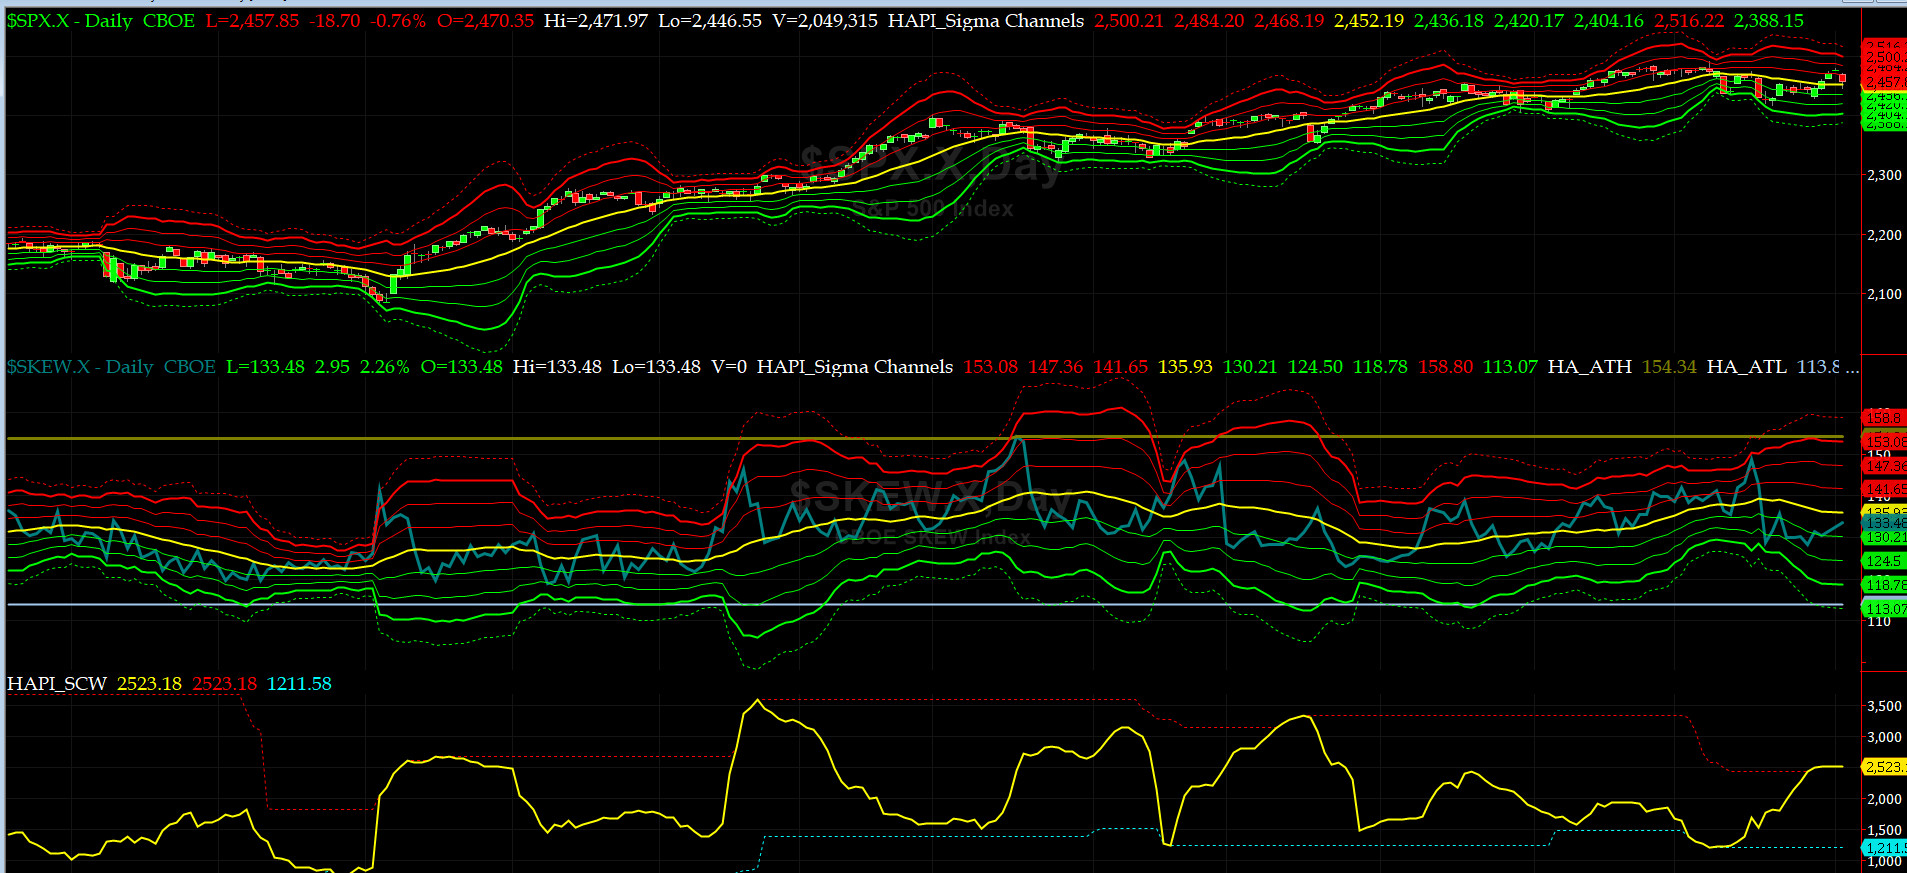
SPX SKEW (Tail Risk) Chart
Last week SPX SKEW (Tail Risk) rose a tad to 133, or its -0.5 sigma (normal = 120-125, range 100-150).
Is all quiet on the Eastern & Mid-Western Fronts? Smart Money still thinks YES.
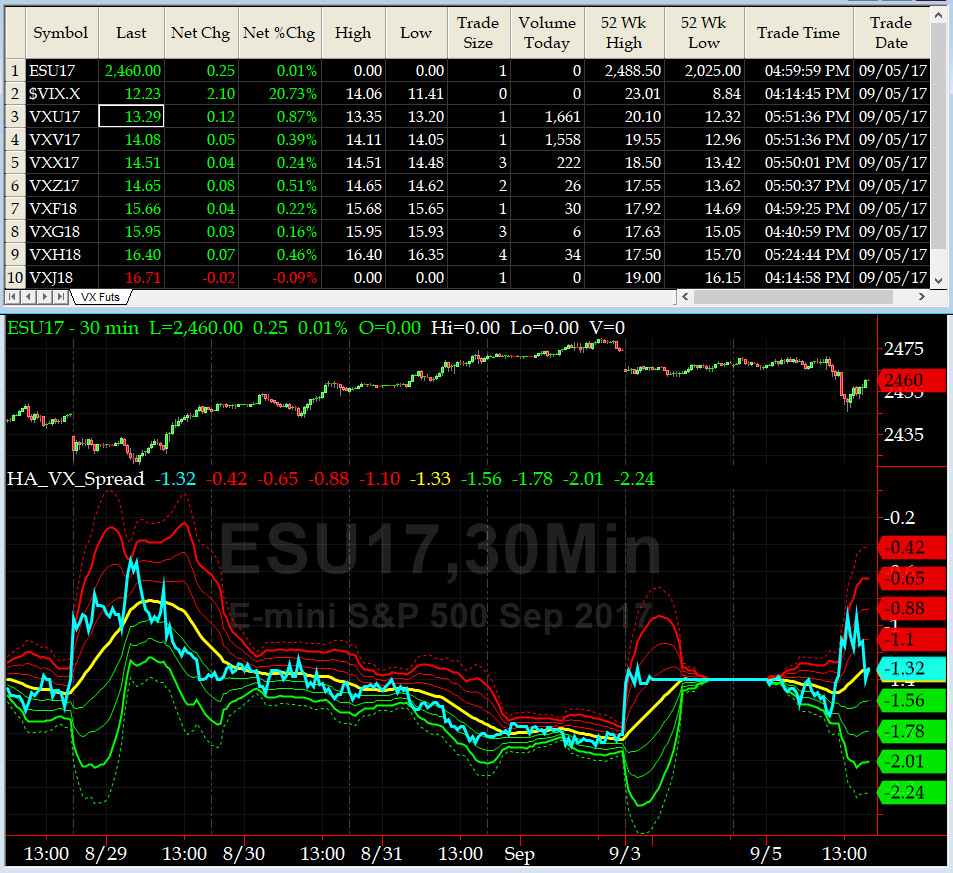
3-month VIX Futures Spread(VX) Chart
The Long SEP, Short DEEZ Spread exhibited a negative slope till Friday and reversed and hooked up. We should see at least one more down day.
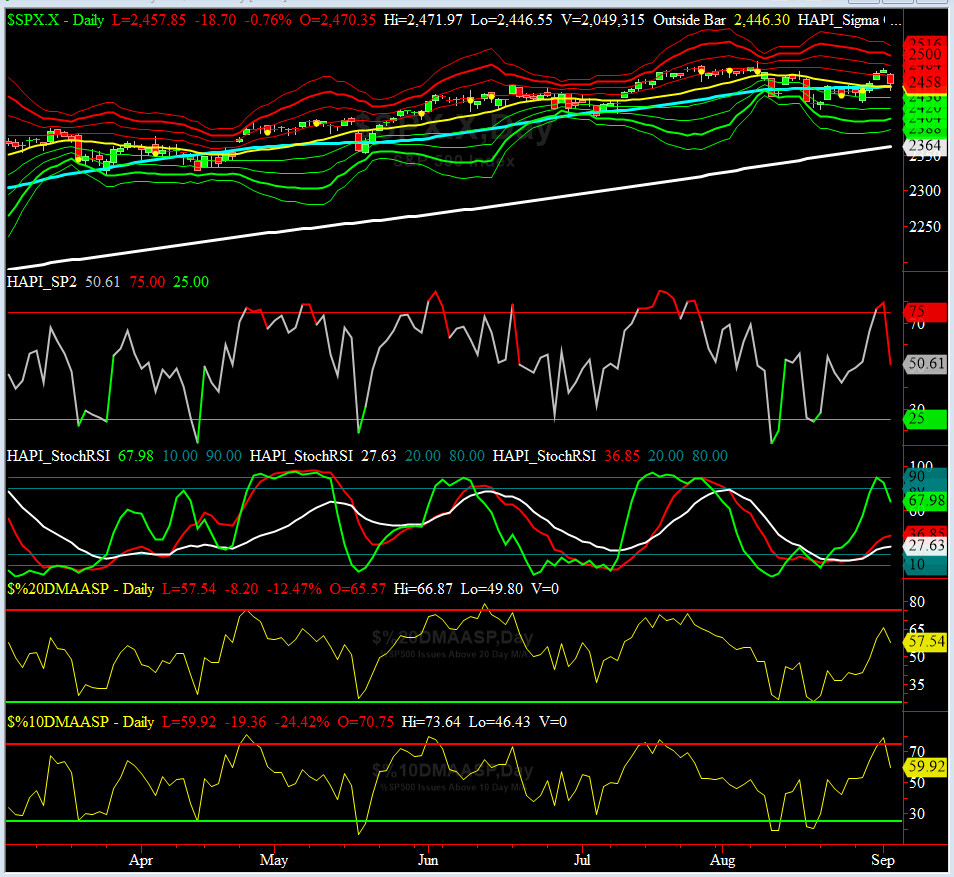
HA_SP2 Chart
HA_SP2 = 50.6 (Buy signal <= 25, Sell Signal >= 75)
Our favorite prop indicator again did what it does best. It rallied to 79.9 on Friday. That is when we closed our long positions. Viva HA_SP2.
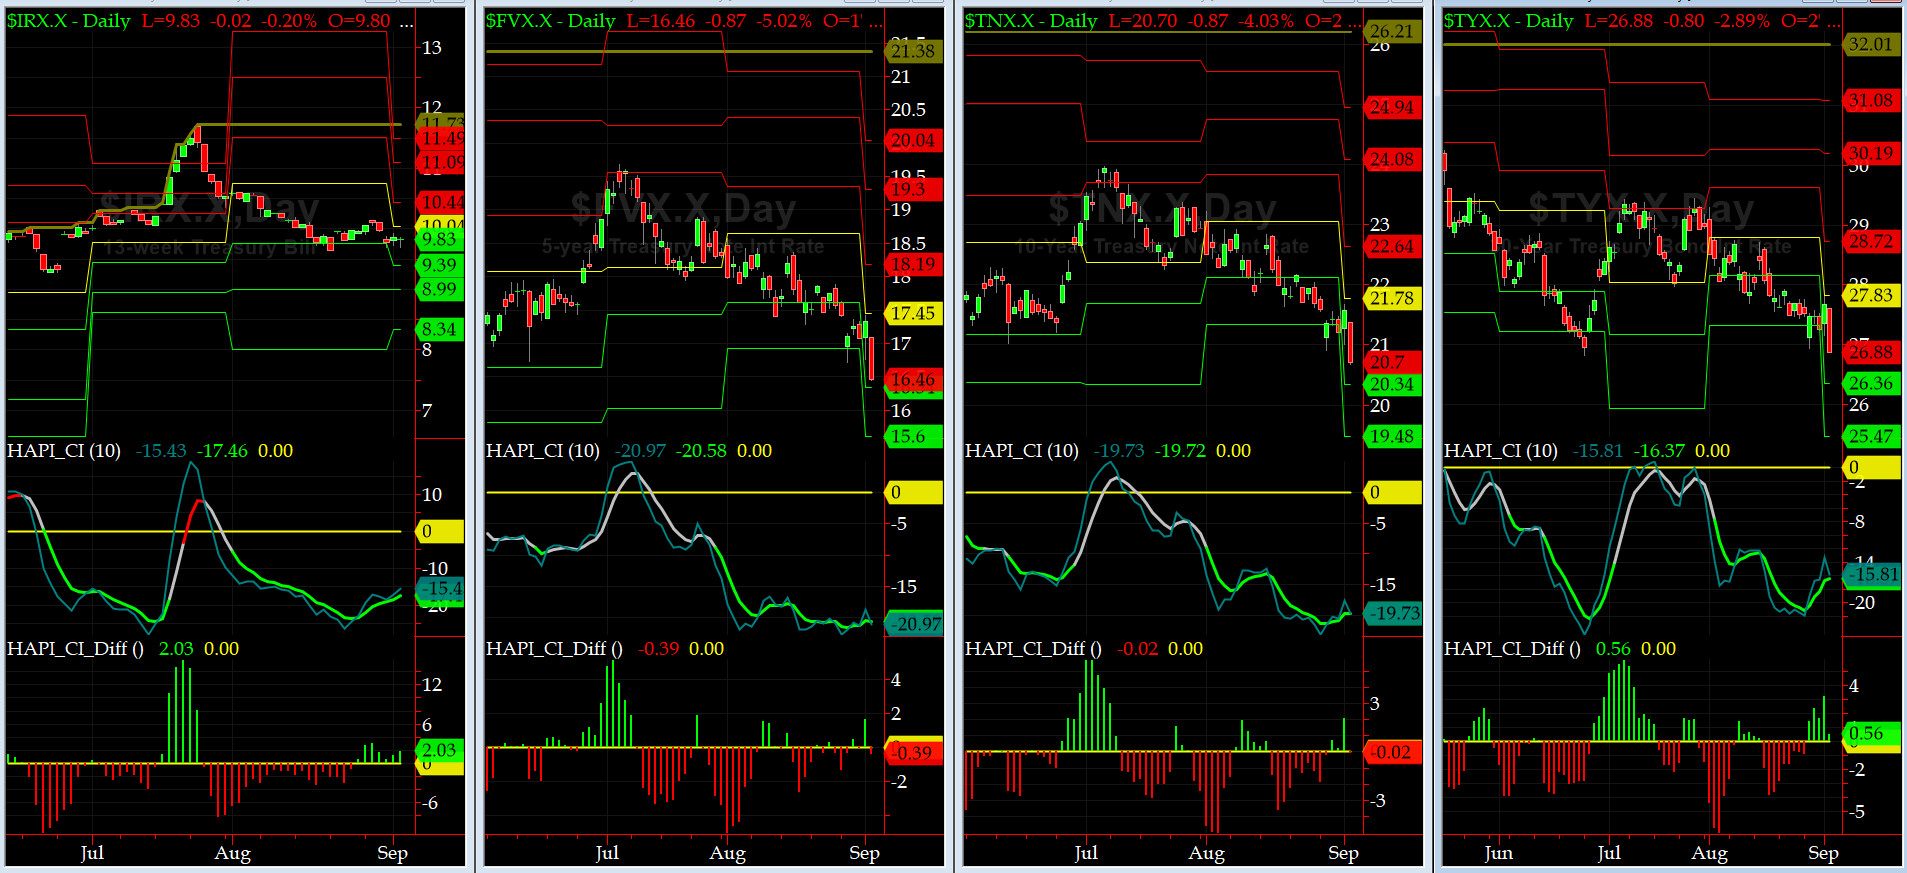
US Treasury T-Notes & T-Bonds Yields Chart
The Treasury Market went sideways last week and went up on Monday as YTM sank. Flight to Quality? ubetcha.....
Fari Hamzei
|


 Proactive Market Timing


