|
Sunday, October 29, 2017, 1745ET
Market Timing Charts, Analysis & Commentary for Issue #215
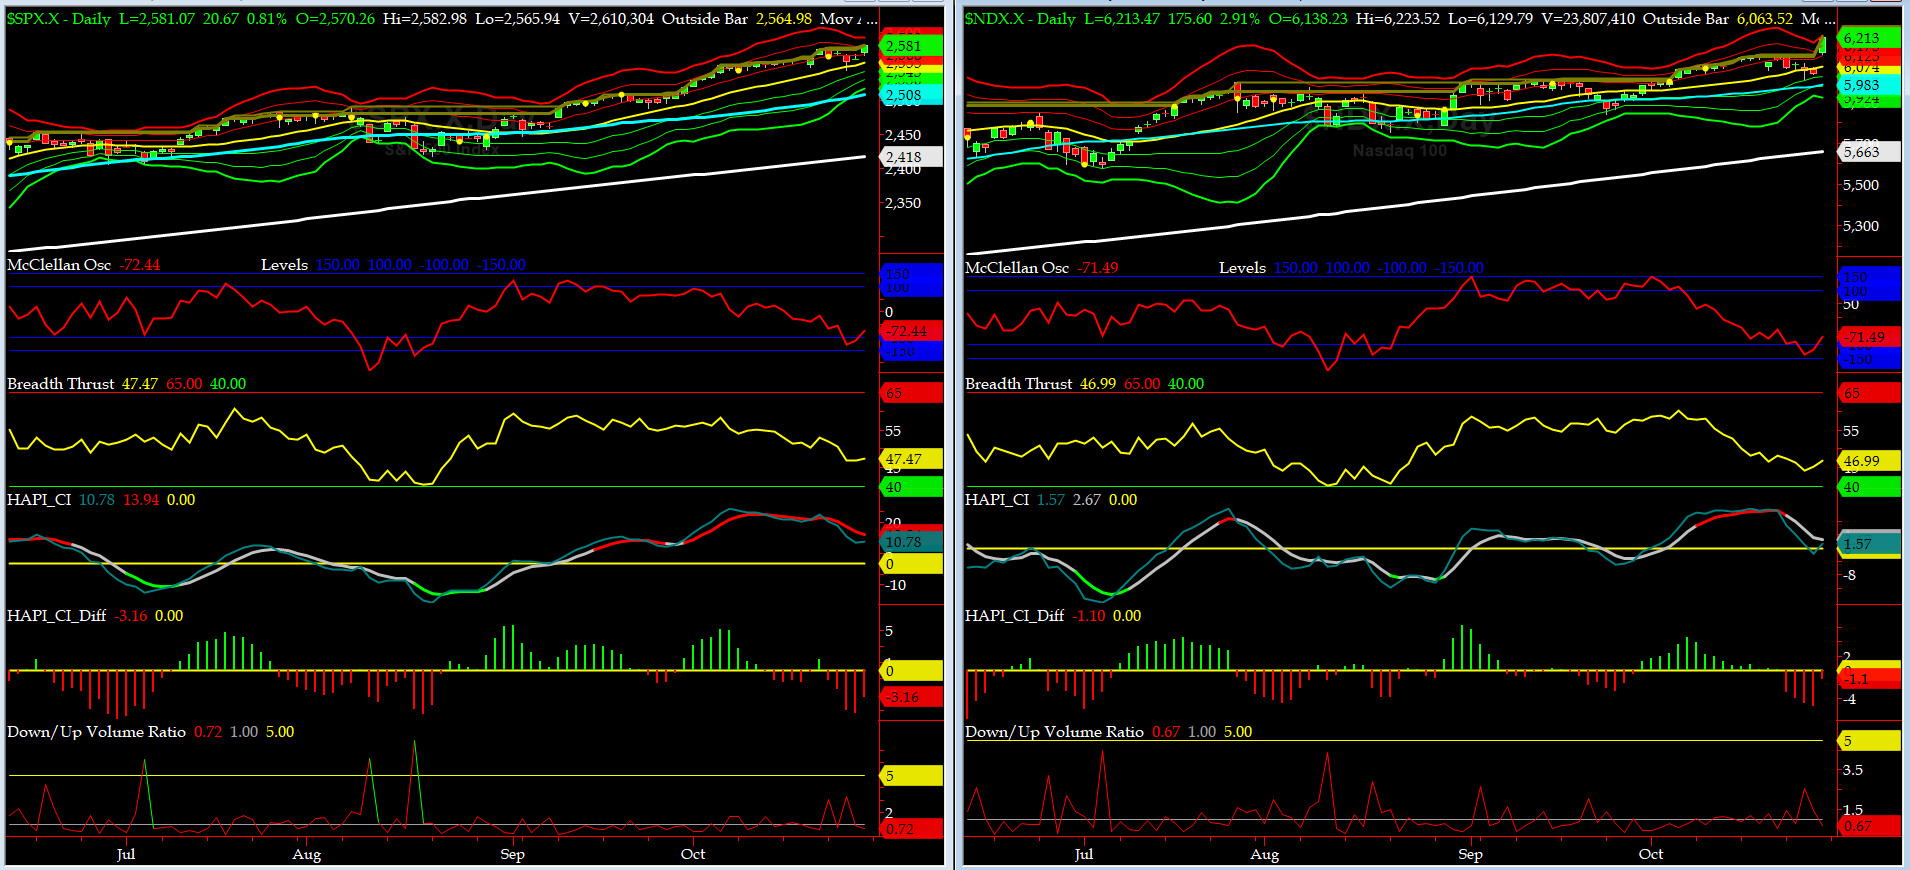
Timer Charts of S&P-500 Cash Index (SPX) + NASDAQ-100 Cash Index (NDX)
Most recent S&P-500 Cash Index (SPX): 2581.07 up +5.86 (up +0.23%) for the week ending on Friday, October 27, 2017, which closed at its +2 sigma.
SPX ALL TIME INTRADAY HIGH = 2582.98 (reached on Friday, Oct 27, 2017)
SPX ALL TIME CLOSING HIGH = 2581.07 (reached on Friday, Oct 27, 2017)
Current DAILY +2 Sigma SPX = 2580 with WEEKLY +2 Sigma = 2580
Current DAILY 0 Sigma (20 day MA) SPX = 2555 with WEEKLY 0 Sigma = 2481
Current DAILY -2 Sigma SPX = 2530 with WEEKLY -2 Sigma = 2383
NYSE McClellan Oscillator = -72 (-150 is start of the O/S area; around -275 to -300 area or lower, we go into the �launch-pad� mode, over +150, we are in O/B area)
NYSE Breadth Thrust = 53.12 (40 is considered as oversold and 65 as overbought)
Thanks to AMZN, MSFT and INTC EPS reports Thursday after markets close, on Friday, SPX and NDX hit it out of the ballpark with bases loaded (every body and their brothers were short the techs)......
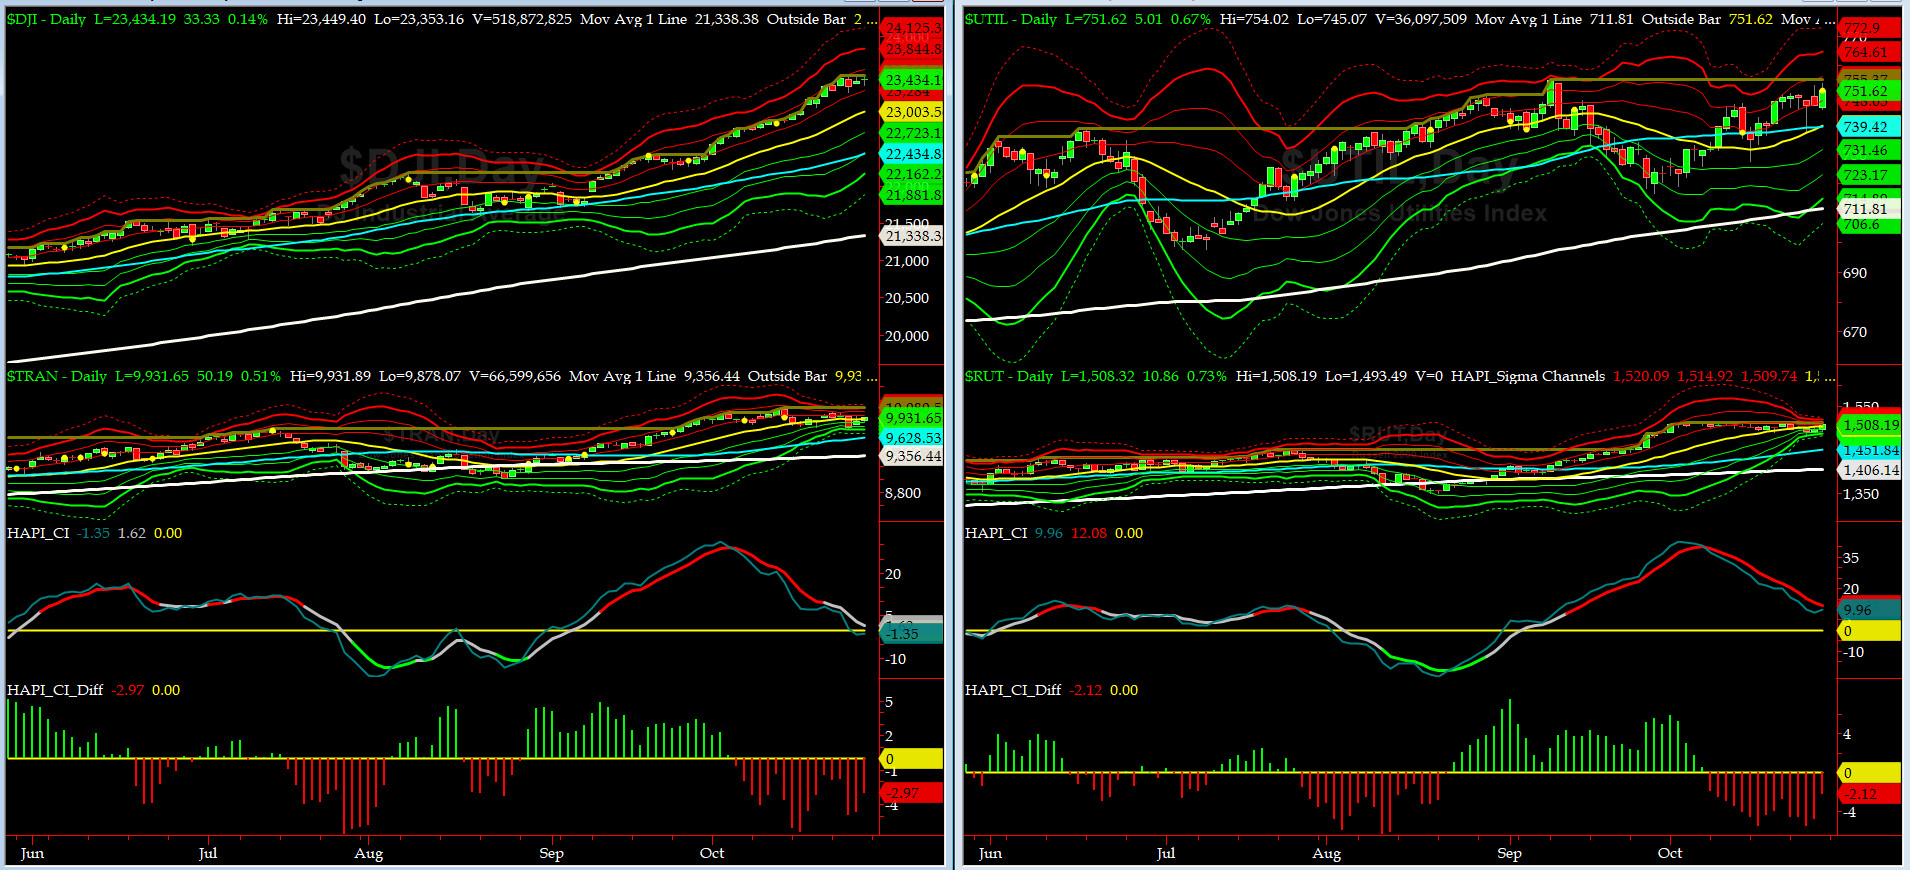
Canaries [in the Coal Mine] Chart for DJ TRAN & RUT Indices
200-Day MA DJ TRAN = 9356 or 6.1% above DJ TRAN (max observed in last 7 yrs = 20.2%, min = -20.3%)
200-Day MA RUT = 1406 or 7.3% above RUT (max observed in last 7 yrs = 21.3%, min = -22.6%)
DJ Transportation Index (proxy for economic conditions 6 to 9 months hence) sold hard on Wednesday & tried to get stabilized by Friday.
Russell 2000 Small Caps Index (proxy for Risk ON/OFF) again drifted down for three days before taking off on Friday but did not put in a new ATH.... RISK is still ON, for now.
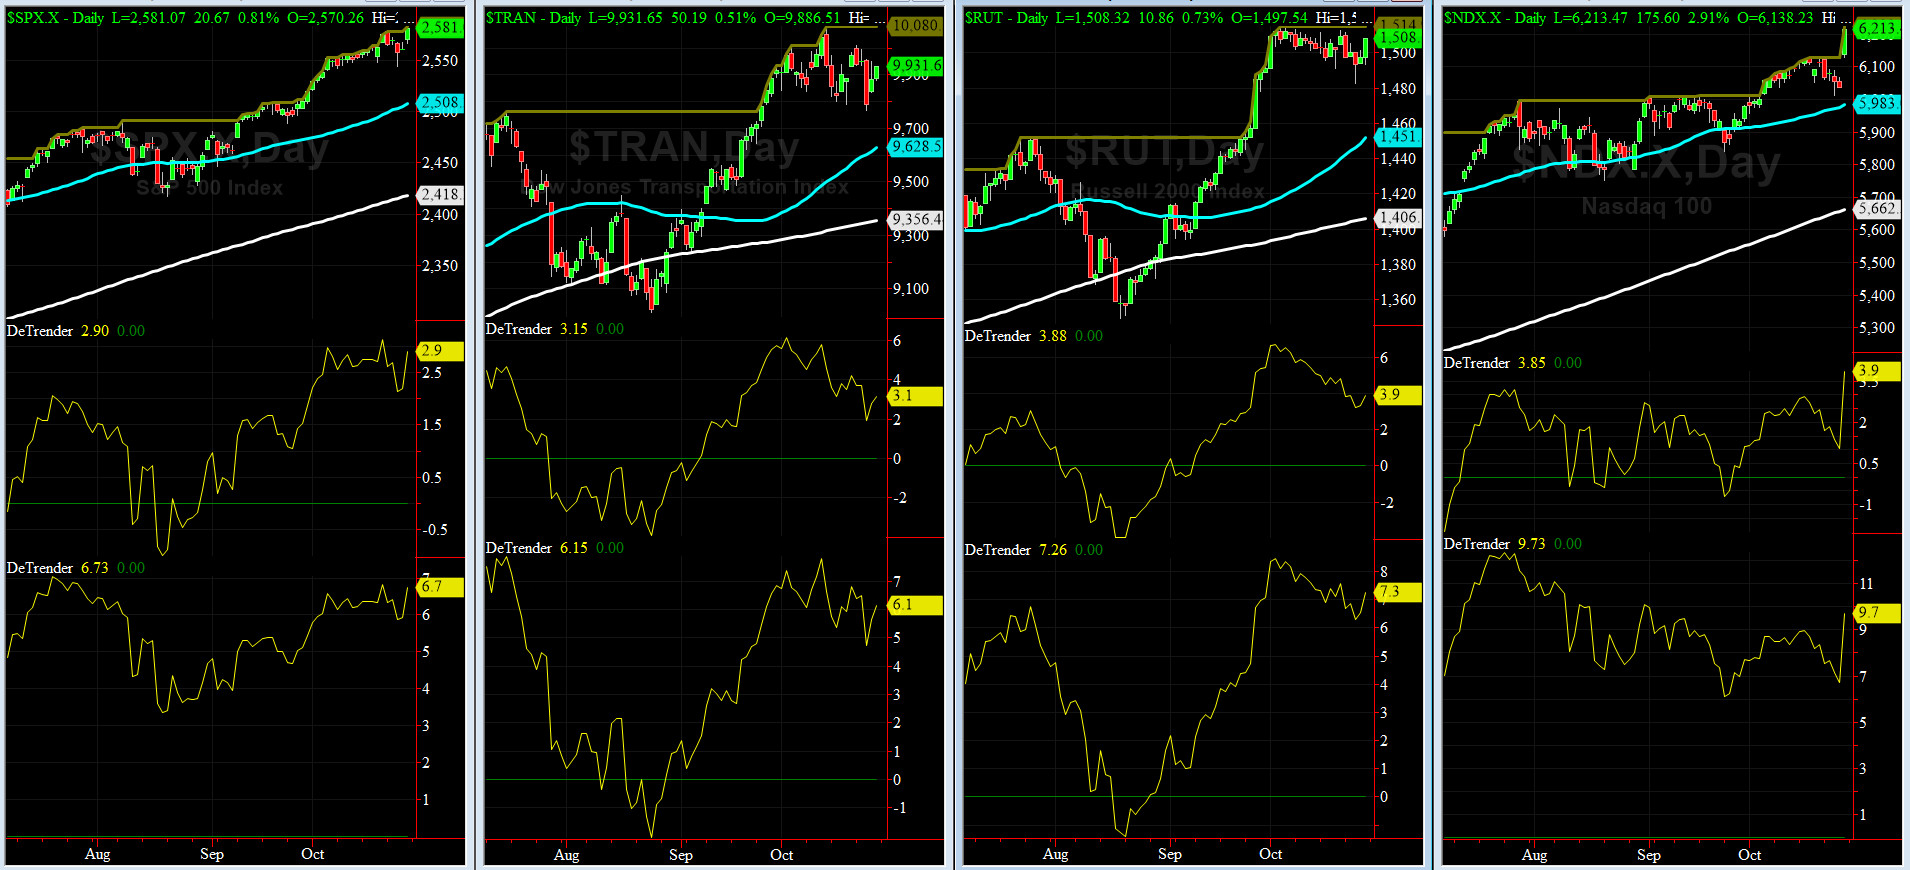
DeTrenders Charts for SPX, NDX, TRAN & RUT Indices
50-Day MA SPX = 2508 or 2.9% below SPX (max observed in last 7 yrs = +8.6%, min = -9.3%)
200-Day MA SPX = 2418 or 6.7% below SPX (max observed in last 7 yrs = 15.2%, min = -14%)
Once again, all of our EIGHT DeTrenders are continue to remain POSITIVE while the DeTrenders for DJ Tran & RUT will continue to be harbingers of future price behavior in broad indices.
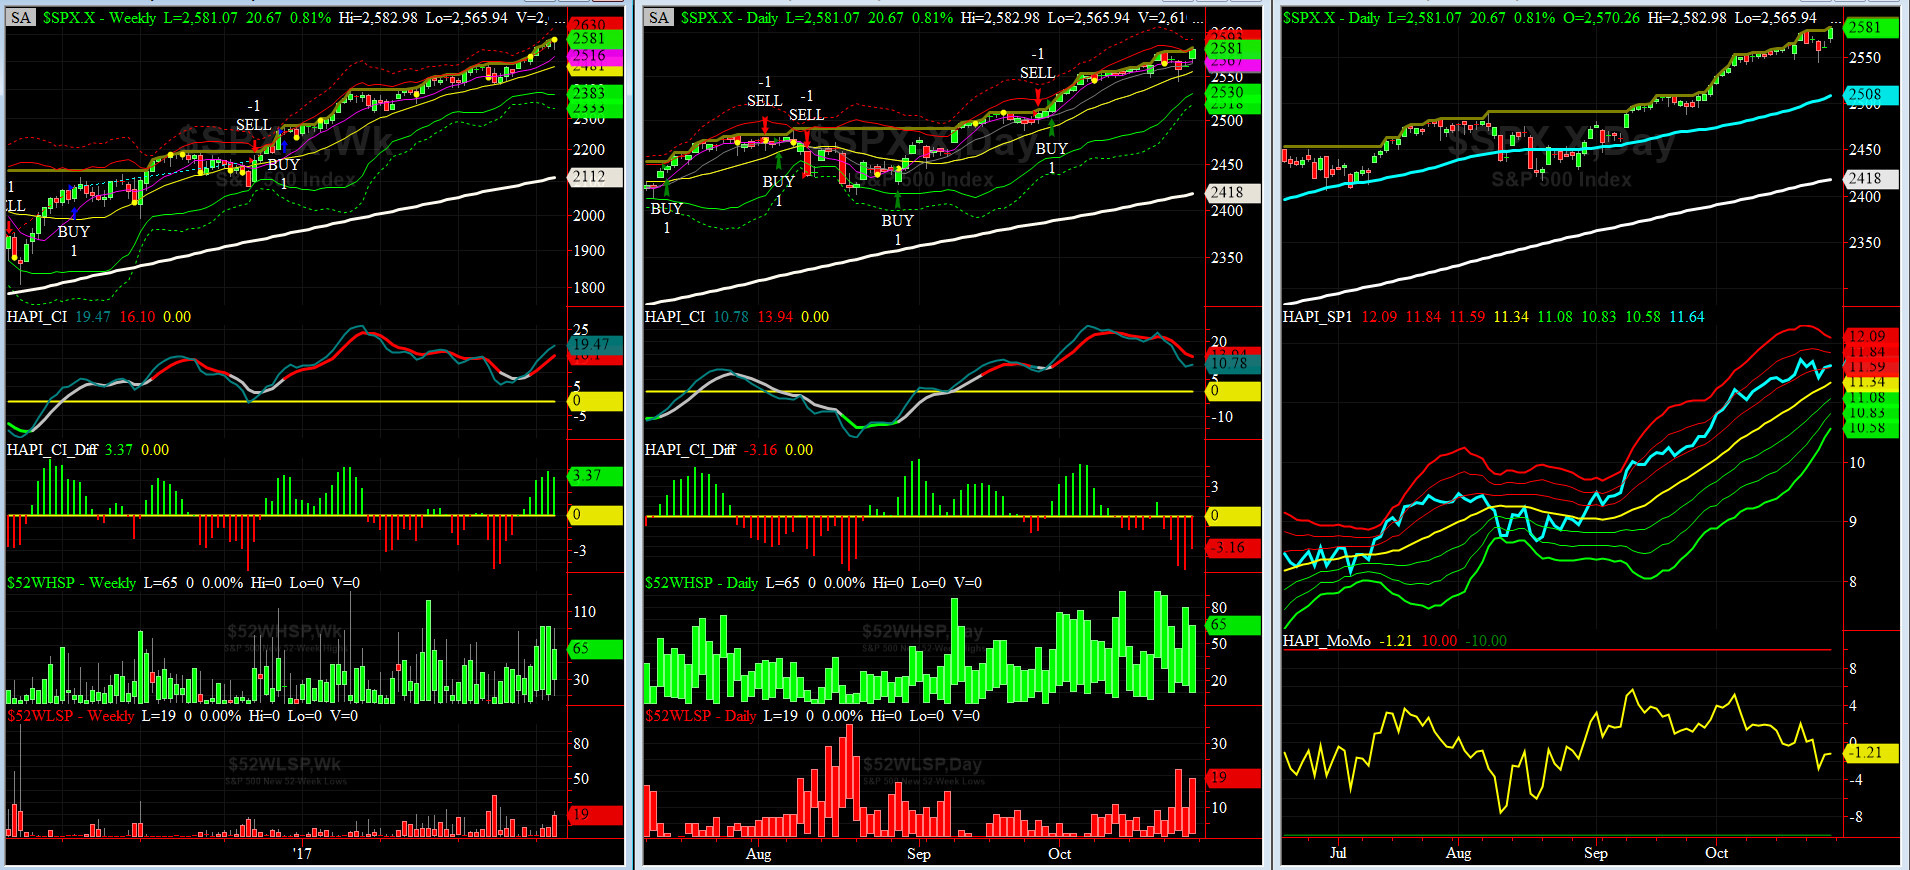
HA_SP1_Momo Chart
WEEKLY Timing Model = on a BUY Signal since Friday 12/16/16 CLOSE at 2258
DAILY Timing Model = on a BUY Signal since Friday 9/29/17 CLOSE at 2519
Max SPX 52wk-highs reading last week = 90 (over 120-140, the local maxima is in)
Max SPX 52wk-Lows reading last week = 22 (over 40-60, the local minima is in)
HA_SP1 closed near its +1 sigma channels
HA_Momo = -1.2 (reversals most likely occur above +10 or below -10)
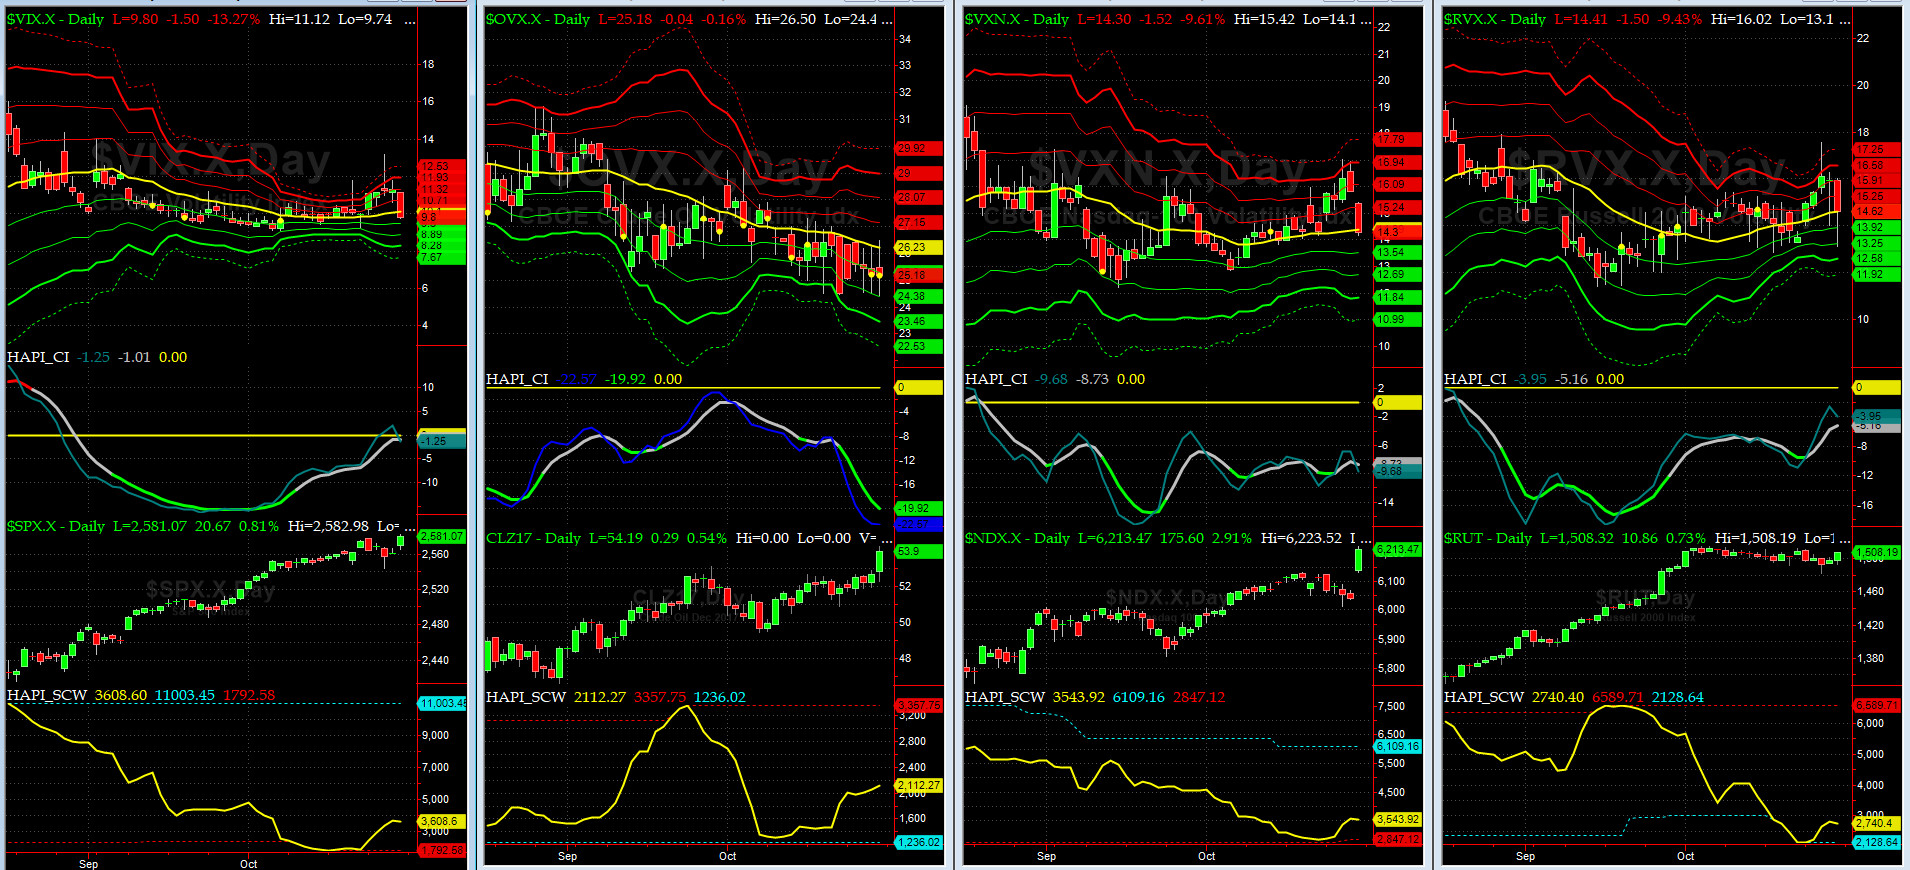
Vol of the Vols Chart
VIX currently stands at 9.8, at about its zero sigma (remember it's the VIX volatility pattern ( its sigma channels) that matters, and not the level of VIX itself (this is per Dr. Robert Whaley, a great mentor and inventor of original VIX, now called VXO ). VIX usually peaks around a test of its +4 sigma).
Last week, VIX had a short-lived spike to ~13.2 but again it was short-lived.
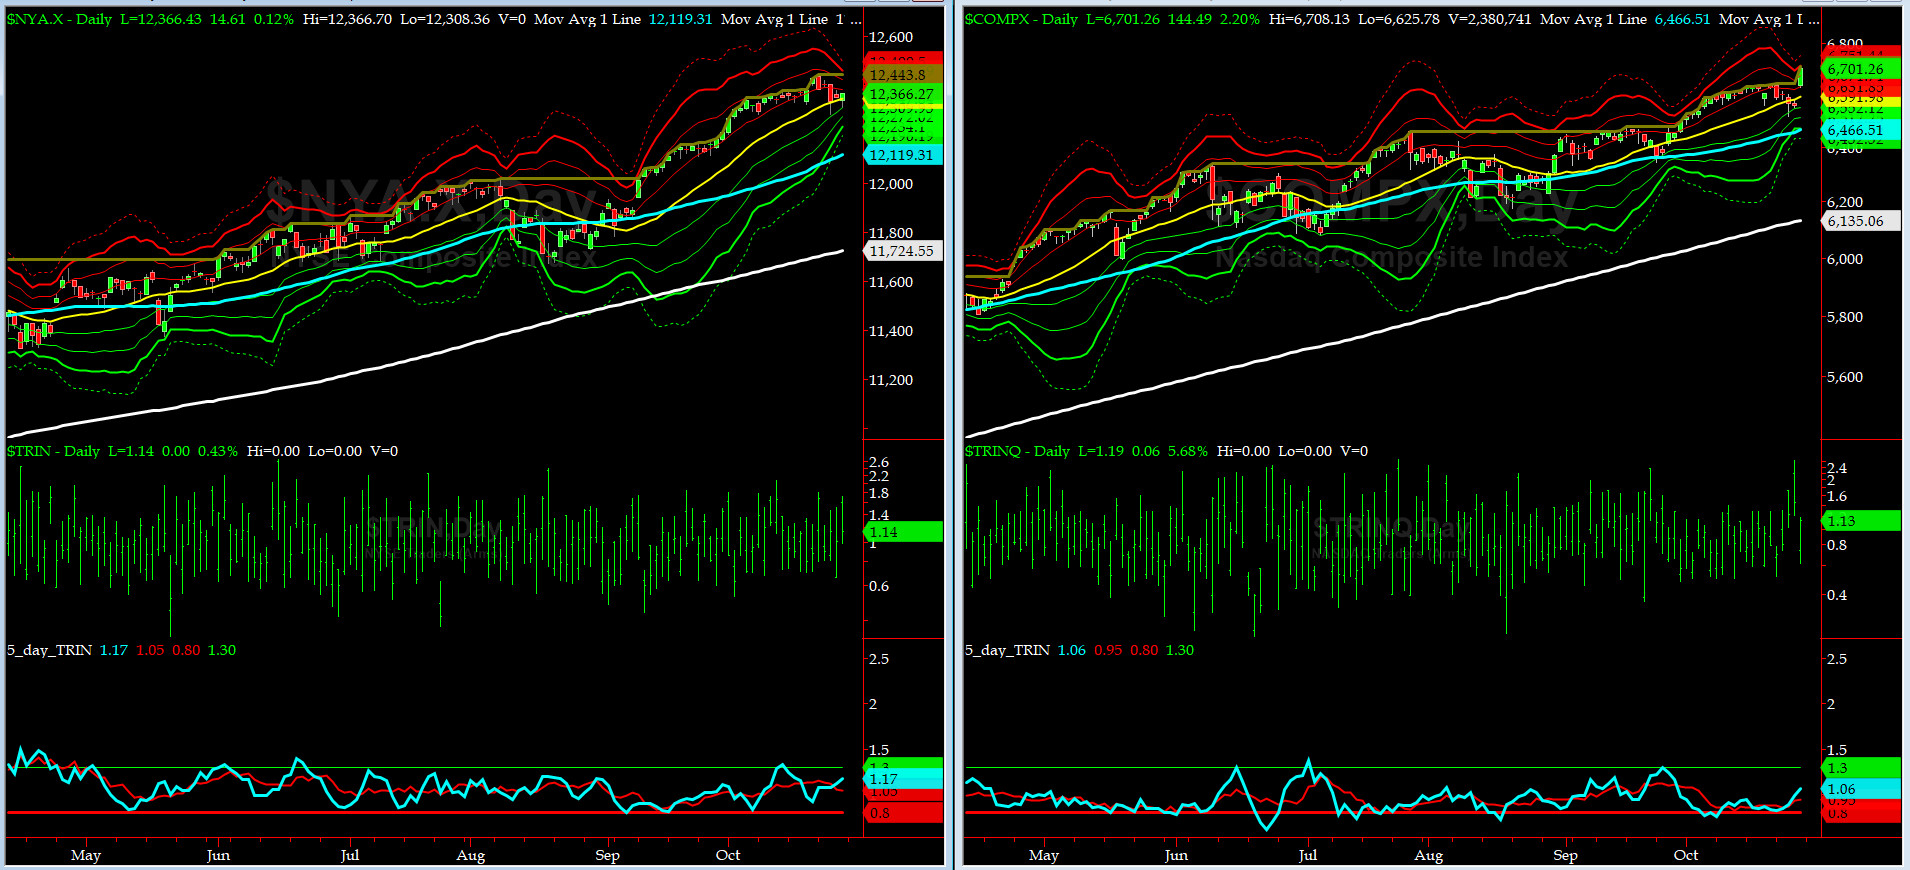
5-day TRIN & TRINQ Charts
Both NYSE & NASDAQ 5-day TRINs are in the NEUTRAL Zone.
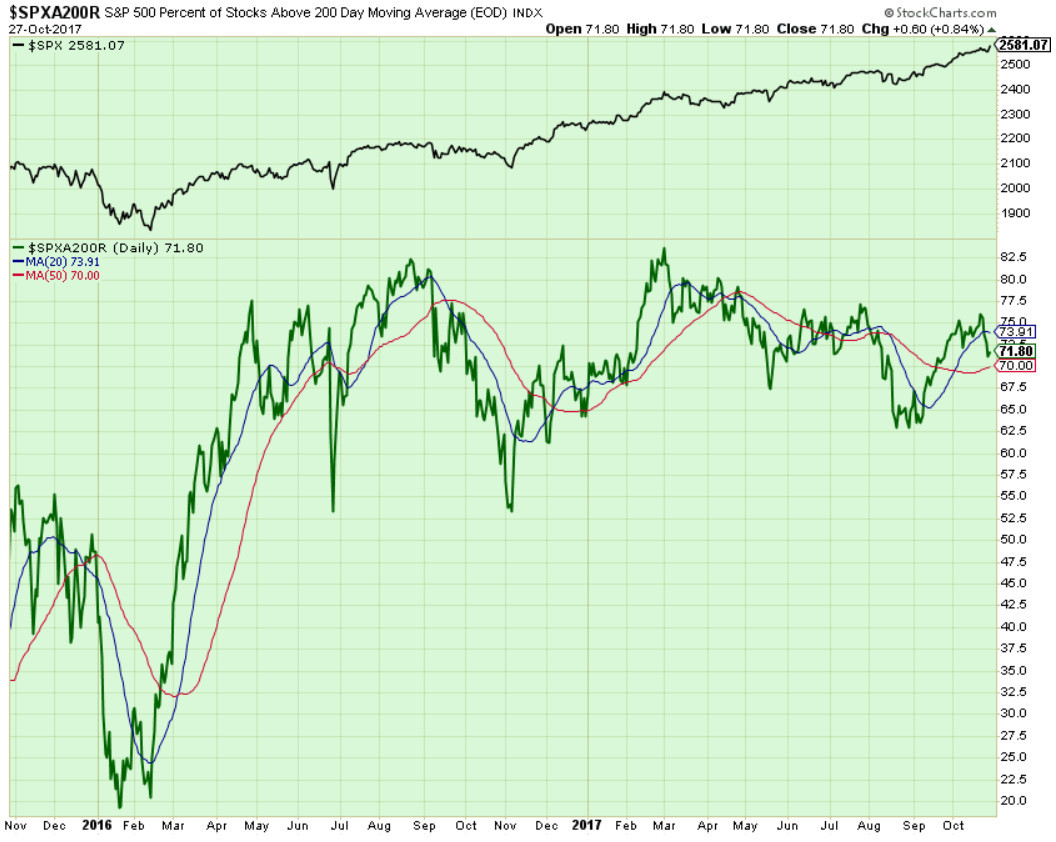
Components of SPX above their respective 200day MA Chart
This past week, this scoring indicator finally broke down and put in a big divergence, dropping from over 76% to 71.8% on Friday while SPX and NDX ran up to ATHs. This concerns us.
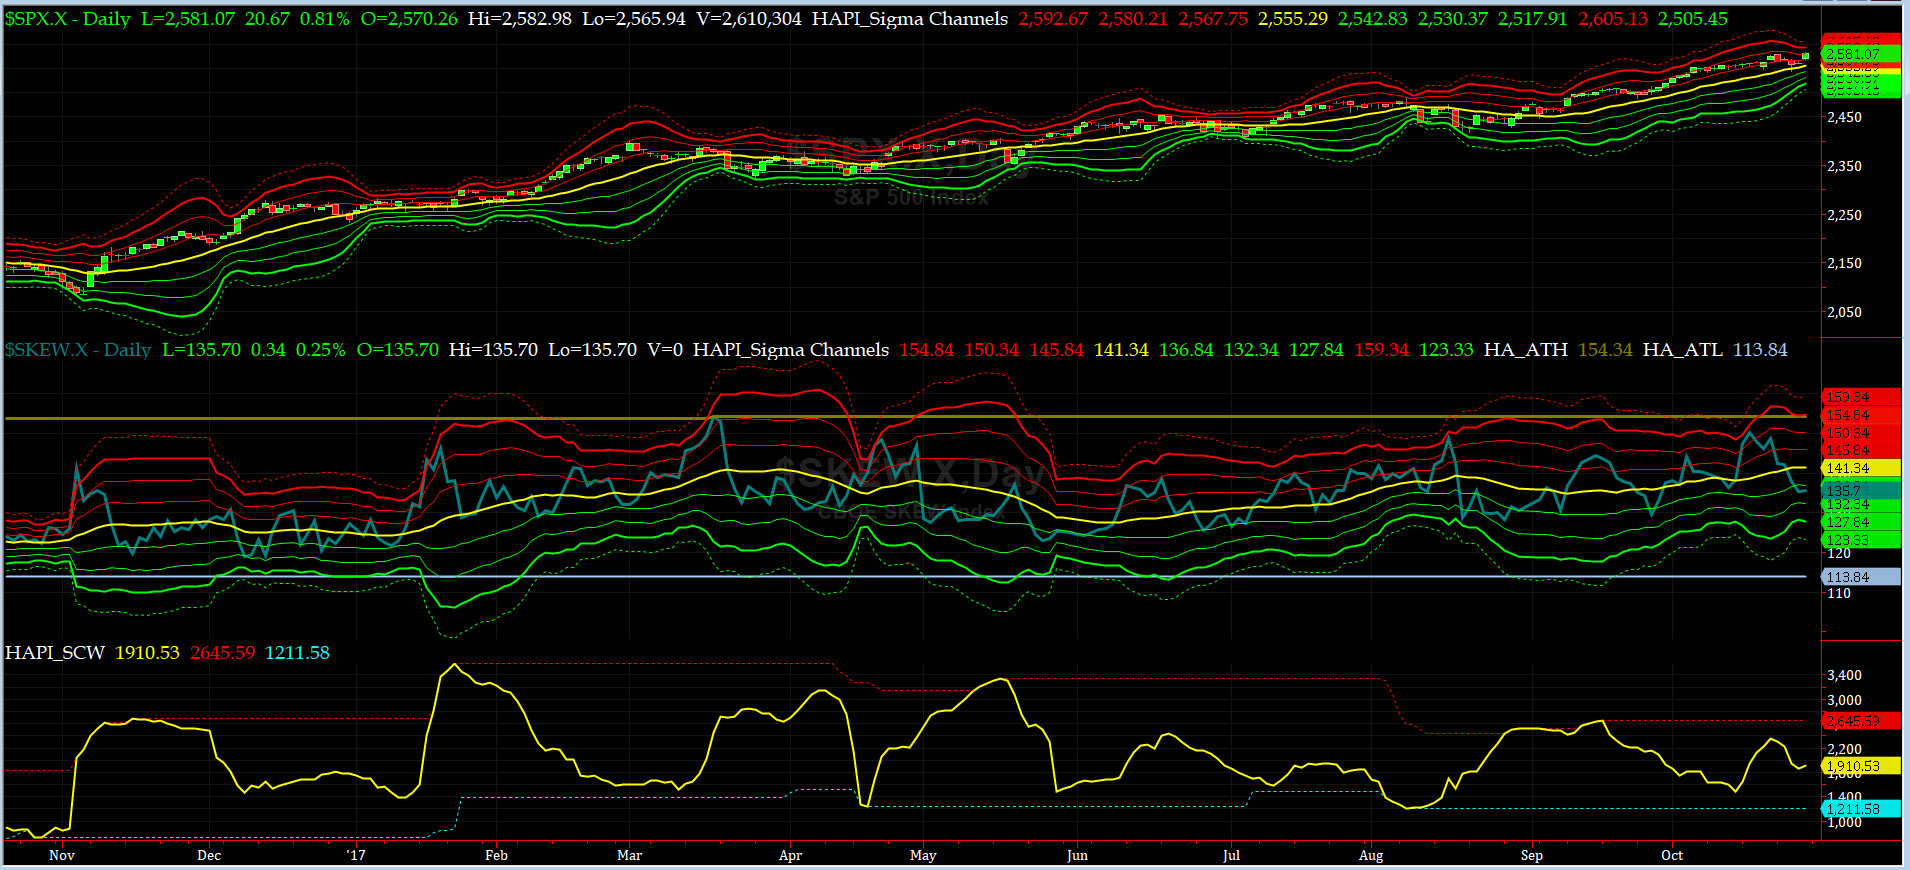
SPX SKEW (Tail Risk) Chart
Last week SPX SKEW (Tail Risk) dropped 3 sigma levels to close at 135.7, or about its -1 sigma (normal = 120-125, range 100-150).
Is all quiet on the Eastern & Mid-Western Fronts? Smart Money for now thinks YES.
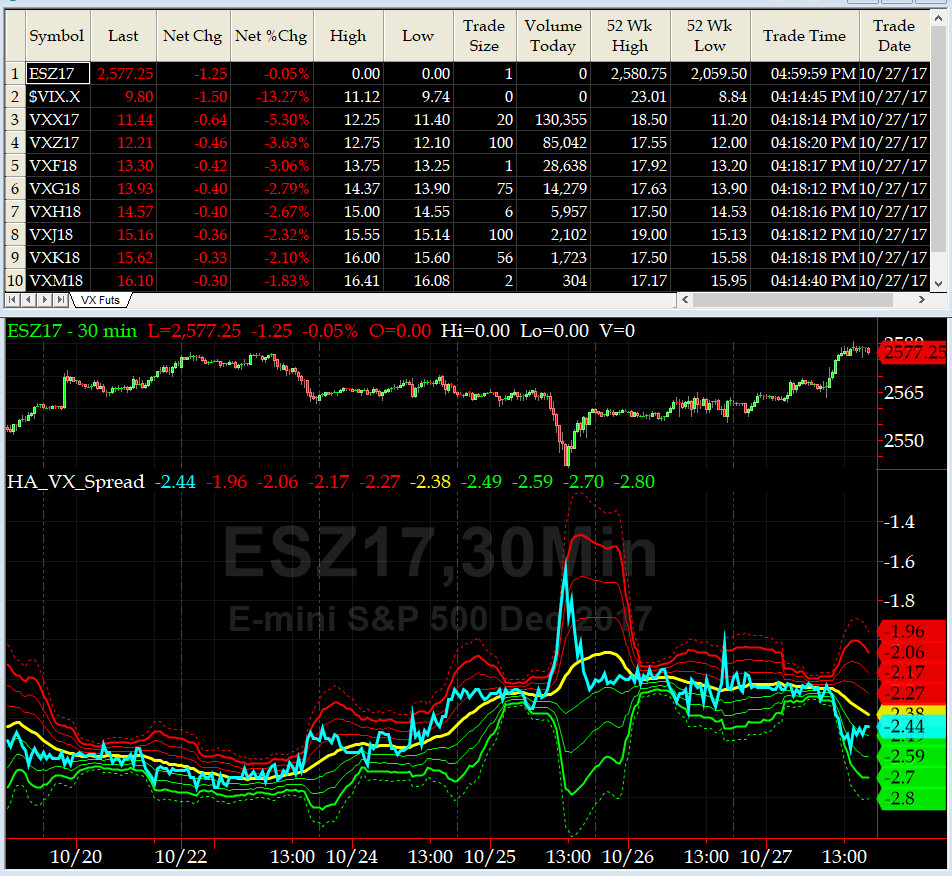
3-month VIX Futures Spread(VX) Chart
The Long NOV17, Short FEB18 Spread continued to trend lower after a massive spike on Wednesday. Equity markets remain near overbought zone.

HA_SP2 Chart
HA_SP2 = 72.4 (Buy signal <= 25, Sell Signal >= 75)
Our favorite prop indicator back to near overbought zone. This week, we will be watching this gem of an indicator very closely.
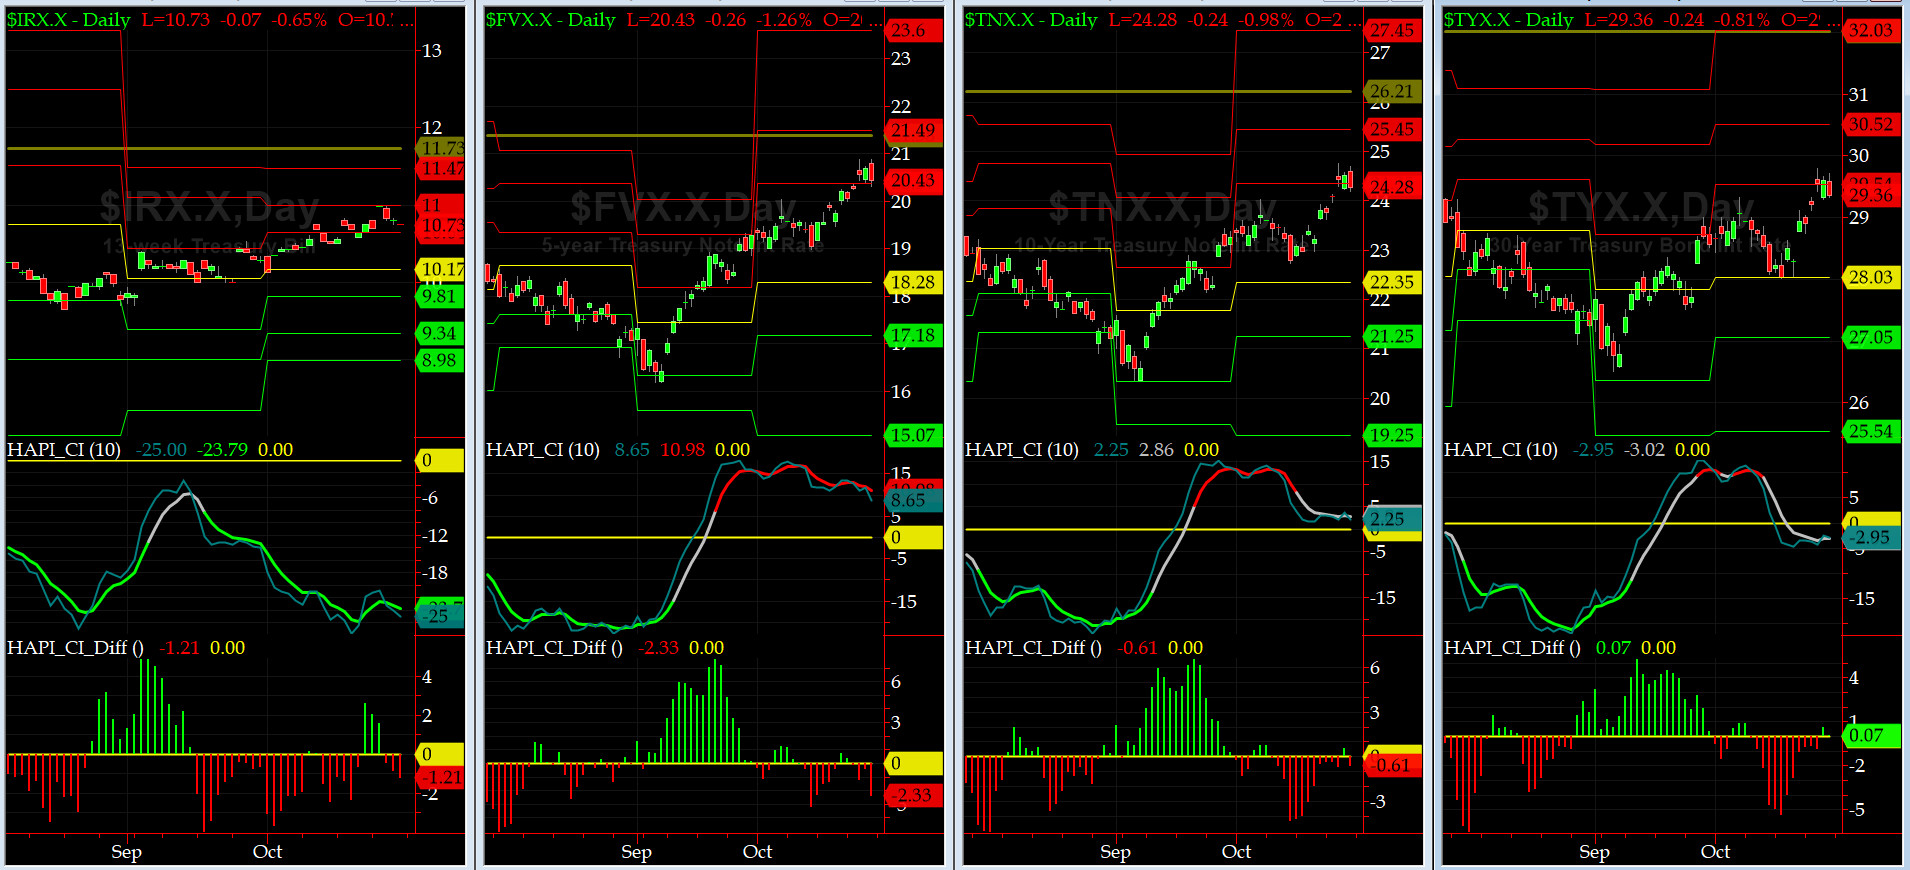
US Treasury T-Notes & T-Bonds Yields Chart
Our Treasury Market sold slowly and consistently throughout the week with Five Year nearing its 3-yr high. The front end of the Yield Curve also had a small up-tick.
Fari Hamzei
|


 Proactive Market Timing


